| Tissue | Expression Dynamics | Abbreviation |
| Esophagus | 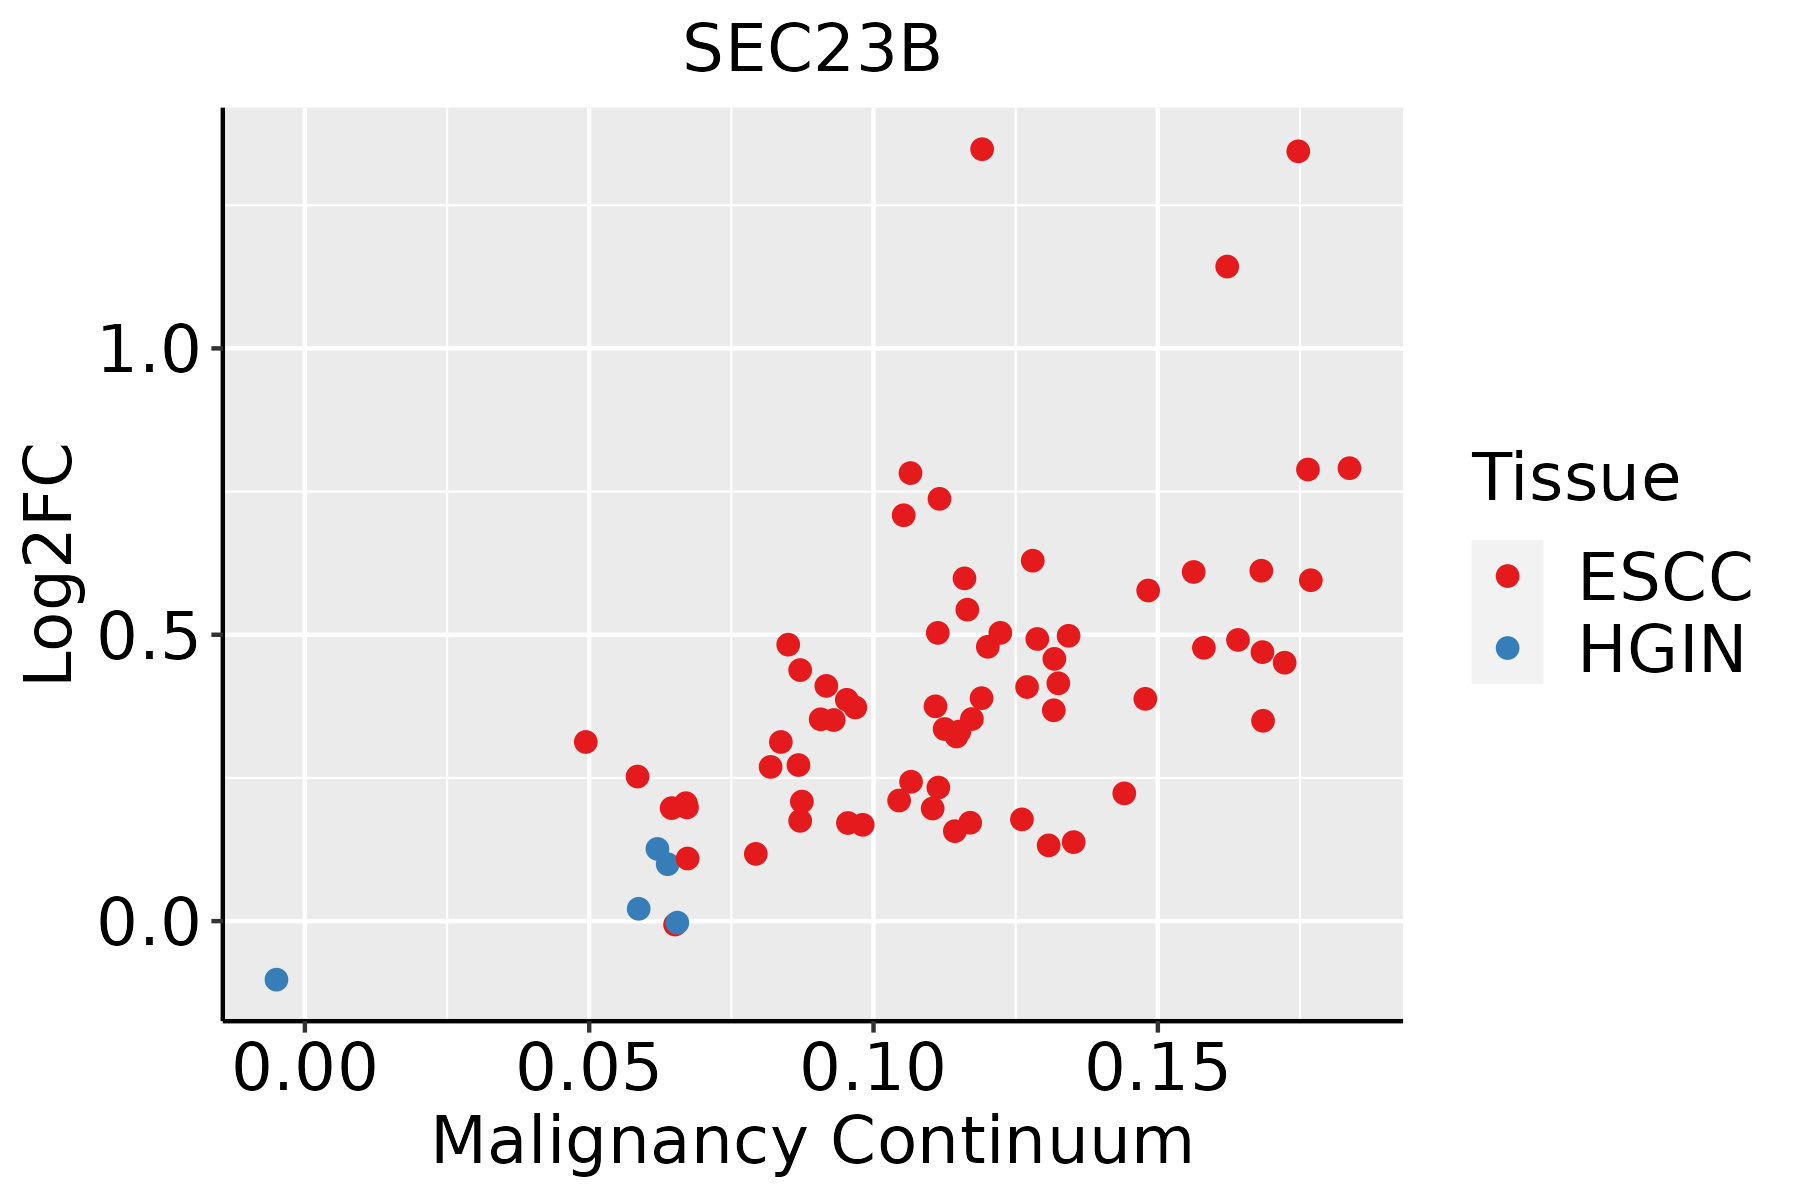 | ESCC: Esophageal squamous cell carcinoma |
| HGIN: High-grade intraepithelial neoplasias |
| LGIN: Low-grade intraepithelial neoplasias |
| Liver | 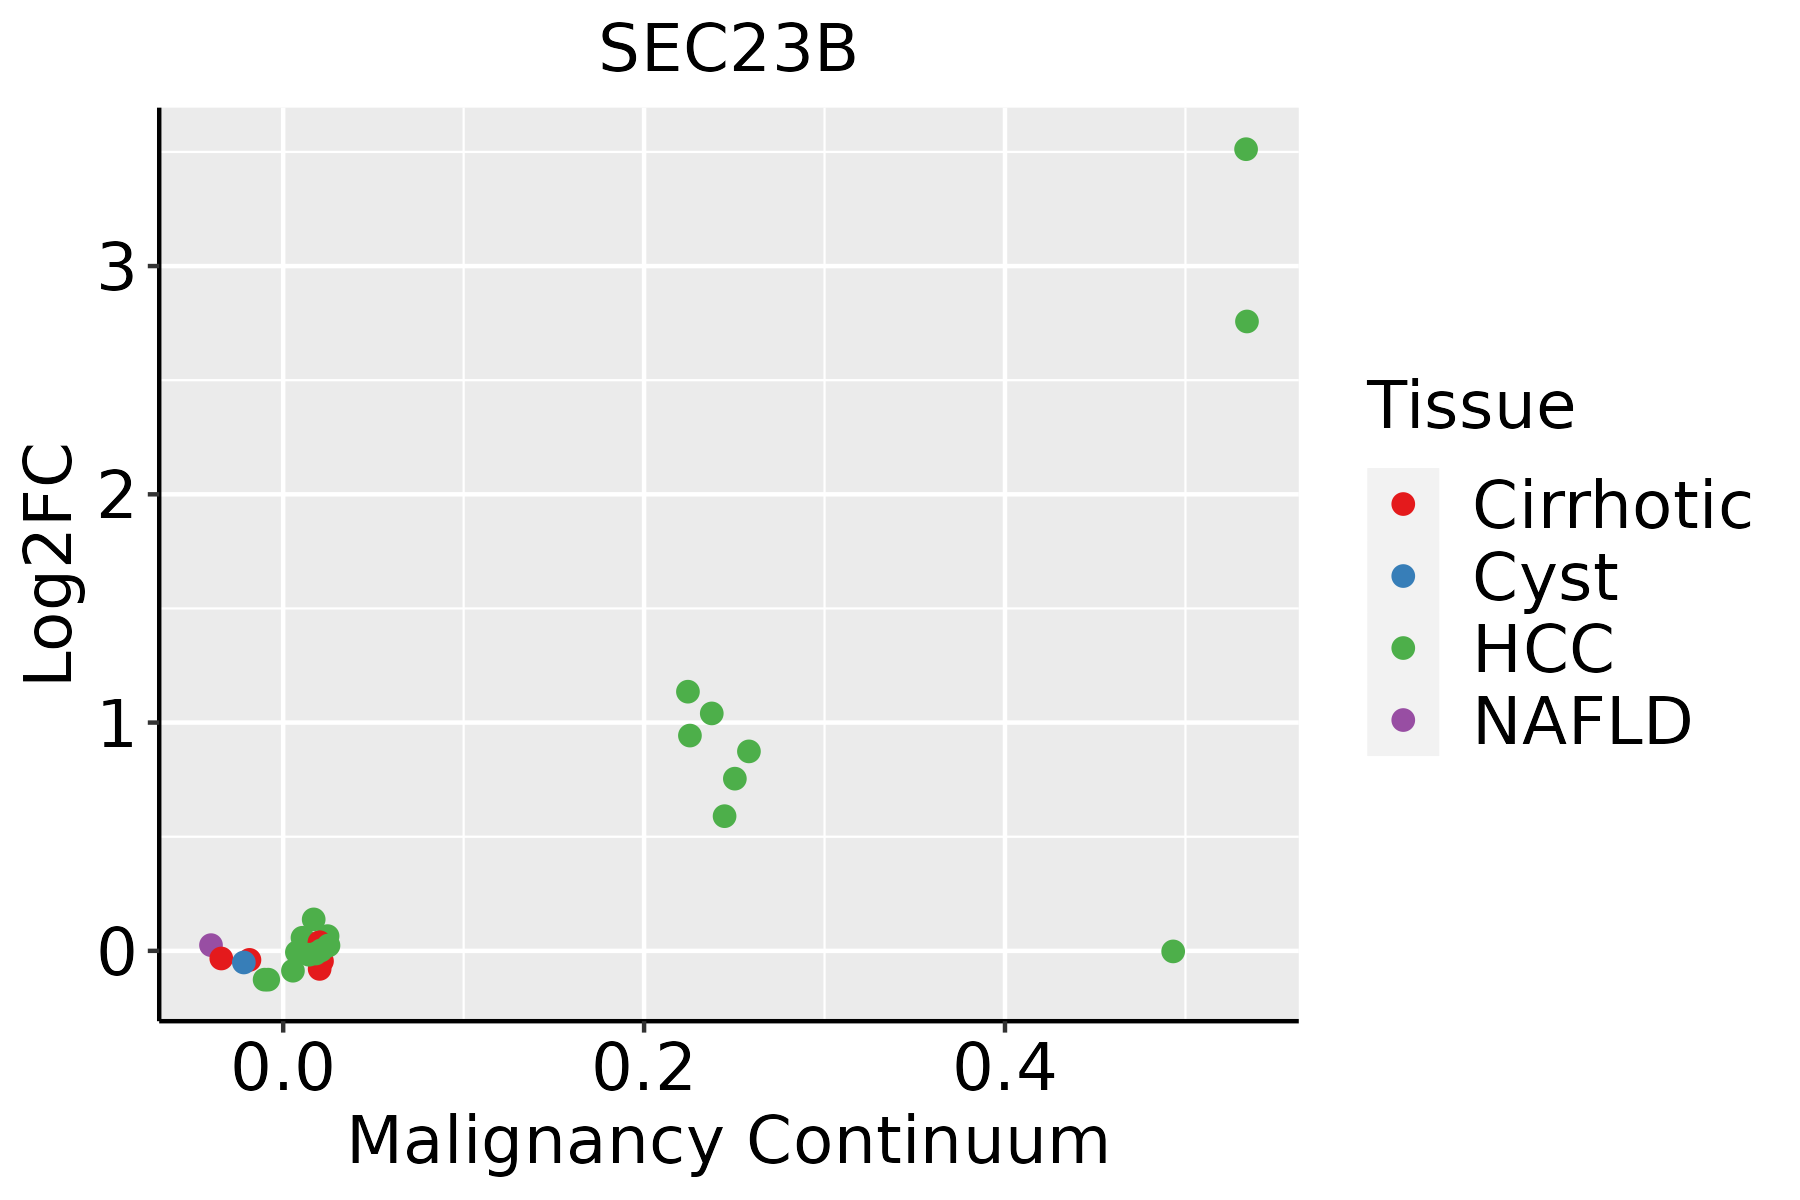 | HCC: Hepatocellular carcinoma |
| NAFLD: Non-alcoholic fatty liver disease |
| Oral Cavity |  | EOLP: Erosive Oral lichen planus |
| LP: leukoplakia |
| NEOLP: Non-erosive oral lichen planus |
| OSCC: Oral squamous cell carcinoma |
| Skin | 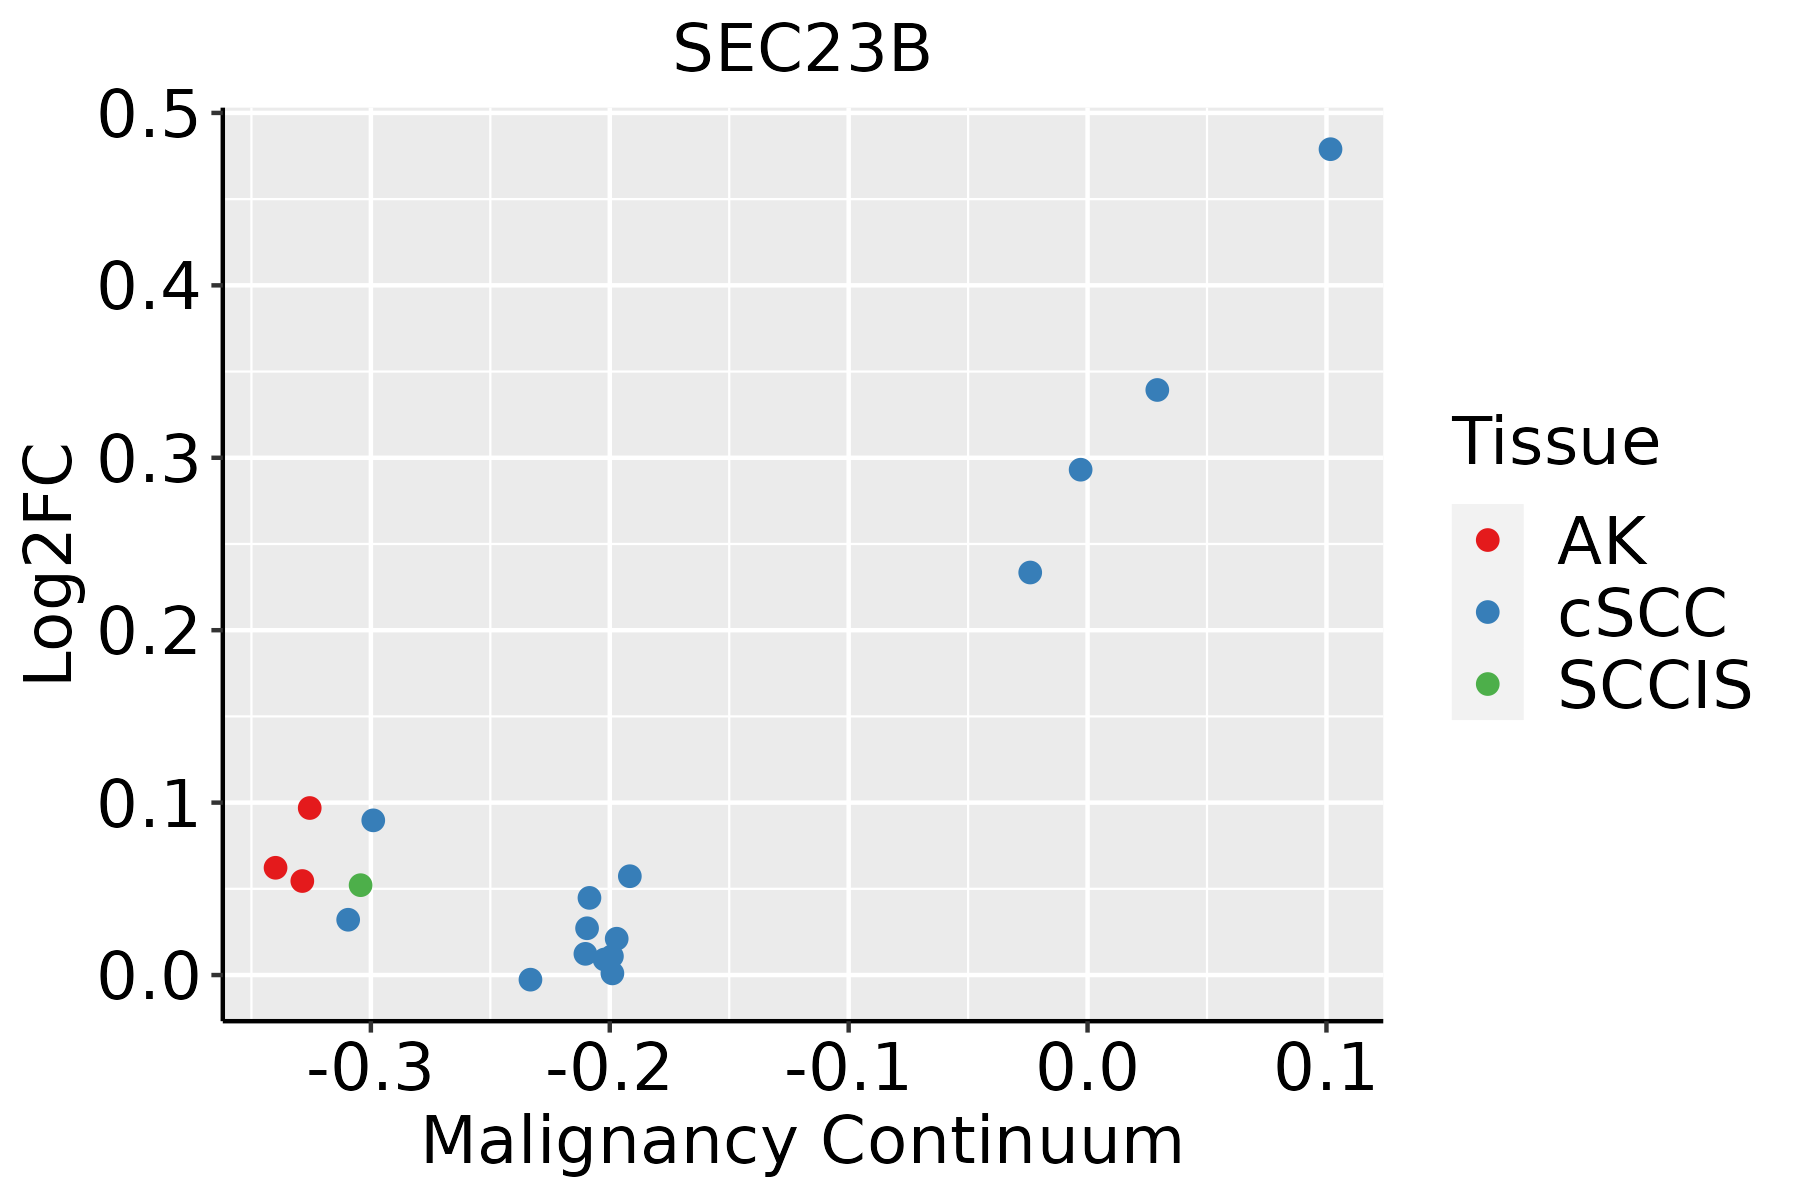 | AK: Actinic keratosis |
| cSCC: Cutaneous squamous cell carcinoma |
| SCCIS:squamous cell carcinoma in situ |
| GO ID | Tissue | Disease Stage | Description | Gene Ratio | Bg Ratio | pvalue | p.adjust | Count |
| GO:004819318 | Esophagus | ESCC | Golgi vesicle transport | 231/8552 | 296/18723 | 1.82e-30 | 9.63e-28 | 231 |
| GO:001605014 | Esophagus | ESCC | vesicle organization | 211/8552 | 300/18723 | 2.85e-18 | 2.87e-16 | 211 |
| GO:000688815 | Esophagus | ESCC | endoplasmic reticulum to Golgi vesicle-mediated transport | 102/8552 | 130/18723 | 1.73e-14 | 9.22e-13 | 102 |
| GO:0006900111 | Esophagus | ESCC | vesicle budding from membrane | 54/8552 | 61/18723 | 2.66e-12 | 1.07e-10 | 54 |
| GO:009011414 | Esophagus | ESCC | COPII-coated vesicle budding | 27/8552 | 29/18723 | 8.09e-08 | 1.39e-06 | 27 |
| GO:00901104 | Esophagus | ESCC | COPII-coated vesicle cargo loading | 14/8552 | 15/18723 | 1.47e-04 | 9.85e-04 | 14 |
| GO:00354595 | Esophagus | ESCC | vesicle cargo loading | 19/8552 | 27/18723 | 8.35e-03 | 2.95e-02 | 19 |
| GO:004819321 | Liver | HCC | Golgi vesicle transport | 217/7958 | 296/18723 | 2.58e-27 | 1.02e-24 | 217 |
| GO:000688821 | Liver | HCC | endoplasmic reticulum to Golgi vesicle-mediated transport | 100/7958 | 130/18723 | 1.15e-15 | 8.67e-14 | 100 |
| GO:001605021 | Liver | HCC | vesicle organization | 194/7958 | 300/18723 | 5.58e-15 | 3.97e-13 | 194 |
| GO:000690021 | Liver | HCC | vesicle budding from membrane | 53/7958 | 61/18723 | 7.38e-13 | 3.80e-11 | 53 |
| GO:00901142 | Liver | HCC | COPII-coated vesicle budding | 27/7958 | 29/18723 | 1.28e-08 | 3.14e-07 | 27 |
| GO:00901102 | Liver | HCC | COPII-coated vesicle cargo loading | 14/7958 | 15/18723 | 5.65e-05 | 5.26e-04 | 14 |
| GO:003545921 | Liver | HCC | vesicle cargo loading | 19/7958 | 27/18723 | 3.18e-03 | 1.47e-02 | 19 |
| GO:004819315 | Oral cavity | OSCC | Golgi vesicle transport | 209/7305 | 296/18723 | 1.39e-28 | 6.30e-26 | 209 |
| GO:00160508 | Oral cavity | OSCC | vesicle organization | 189/7305 | 300/18723 | 2.40e-17 | 2.14e-15 | 189 |
| GO:00068888 | Oral cavity | OSCC | endoplasmic reticulum to Golgi vesicle-mediated transport | 97/7305 | 130/18723 | 1.42e-16 | 1.15e-14 | 97 |
| GO:000690019 | Oral cavity | OSCC | vesicle budding from membrane | 49/7305 | 61/18723 | 4.73e-11 | 1.50e-09 | 49 |
| GO:00901145 | Oral cavity | OSCC | COPII-coated vesicle budding | 24/7305 | 29/18723 | 1.74e-06 | 2.26e-05 | 24 |
| GO:00901103 | Oral cavity | OSCC | COPII-coated vesicle cargo loading | 11/7305 | 15/18723 | 7.49e-03 | 2.75e-02 | 11 |
| Pathway ID | Tissue | Disease Stage | Description | Gene Ratio | Bg Ratio | pvalue | p.adjust | qvalue | Count |
| hsa04141211 | Esophagus | ESCC | Protein processing in endoplasmic reticulum | 147/4205 | 174/8465 | 3.29e-22 | 1.10e-19 | 5.64e-20 | 147 |
| hsa04141310 | Esophagus | ESCC | Protein processing in endoplasmic reticulum | 147/4205 | 174/8465 | 3.29e-22 | 1.10e-19 | 5.64e-20 | 147 |
| hsa0414122 | Liver | HCC | Protein processing in endoplasmic reticulum | 146/4020 | 174/8465 | 7.34e-24 | 2.46e-21 | 1.37e-21 | 146 |
| hsa0414132 | Liver | HCC | Protein processing in endoplasmic reticulum | 146/4020 | 174/8465 | 7.34e-24 | 2.46e-21 | 1.37e-21 | 146 |
| hsa0414130 | Oral cavity | OSCC | Protein processing in endoplasmic reticulum | 143/3704 | 174/8465 | 6.82e-26 | 2.28e-23 | 1.16e-23 | 143 |
| hsa04141113 | Oral cavity | OSCC | Protein processing in endoplasmic reticulum | 143/3704 | 174/8465 | 6.82e-26 | 2.28e-23 | 1.16e-23 | 143 |
| hsa04141210 | Oral cavity | LP | Protein processing in endoplasmic reticulum | 113/2418 | 174/8465 | 8.74e-24 | 5.82e-22 | 3.76e-22 | 113 |
| hsa0414138 | Oral cavity | LP | Protein processing in endoplasmic reticulum | 113/2418 | 174/8465 | 8.74e-24 | 5.82e-22 | 3.76e-22 | 113 |
| hsa0414145 | Oral cavity | EOLP | Protein processing in endoplasmic reticulum | 70/1218 | 174/8465 | 2.84e-17 | 3.06e-15 | 1.81e-15 | 70 |
| hsa0414155 | Oral cavity | EOLP | Protein processing in endoplasmic reticulum | 70/1218 | 174/8465 | 2.84e-17 | 3.06e-15 | 1.81e-15 | 70 |
| Hugo Symbol | Variant Class | Variant Classification | dbSNP RS | HGVSc | HGVSp | HGVSp Short | SWISSPROT | BIOTYPE | SIFT | PolyPhen | Tumor Sample Barcode | Tissue | Histology | Sex | Age | Stage | Therapy Types | Drugs | Outcome |
| SEC23B | SNV | Missense_Mutation | novel | c.1696N>C | p.Asp566His | p.D566H | Q15437 | protein_coding | deleterious(0) | probably_damaging(0.934) | TCGA-AR-A2LH-01 | Breast | breast invasive carcinoma | Female | <65 | III/IV | Chemotherapy | adriamycin | PD |
| SEC23B | SNV | Missense_Mutation | | c.914N>C | p.Gly305Ala | p.G305A | Q15437 | protein_coding | tolerated(0.07) | benign(0.403) | TCGA-BH-A0BW-01 | Breast | breast invasive carcinoma | Female | >=65 | I/II | Chemotherapy | adriamycin | CR |
| SEC23B | SNV | Missense_Mutation | | c.961N>C | p.Asp321His | p.D321H | Q15437 | protein_coding | deleterious(0) | probably_damaging(0.977) | TCGA-E9-A1ND-01 | Breast | breast invasive carcinoma | Female | >=65 | I/II | Hormone Therapy | aromasin | SD |
| SEC23B | insertion | Frame_Shift_Ins | novel | c.1599_1600insCCCGAAAGTAAGCAGCCCCAGT | p.Phe534ProfsTer37 | p.F534Pfs*37 | Q15437 | protein_coding | | | TCGA-AN-A0FX-01 | Breast | breast invasive carcinoma | Female | <65 | I/II | Unknown | Unknown | SD |
| SEC23B | deletion | Frame_Shift_Del | novel | c.307_343delGAGGTGAATCAACCTGCCGAATTGATGCCCCAGTTTT | p.Glu103LeufsTer6 | p.E103Lfs*6 | Q15437 | protein_coding | | | TCGA-BH-A0DD-01 | Breast | breast invasive carcinoma | Male | <65 | I/II | Chemotherapy | docetaxel | CR |
| SEC23B | insertion | Nonsense_Mutation | novel | c.196_197insGAACCCGGGAG | p.Cys66Ter | p.C66* | Q15437 | protein_coding | | | TCGA-BH-A0DS-01 | Breast | breast invasive carcinoma | Female | >=65 | III/IV | Chemotherapy | cyclophosphamide | SD |
| SEC23B | insertion | Frame_Shift_Ins | novel | c.198_199insGGAGGCTGCAGTGAGCTGAGATGGGAAAA | p.Lys67GlyfsTer48 | p.K67Gfs*48 | Q15437 | protein_coding | | | TCGA-BH-A0DS-01 | Breast | breast invasive carcinoma | Female | >=65 | III/IV | Chemotherapy | cyclophosphamide | SD |
| SEC23B | SNV | Missense_Mutation | novel | c.338N>G | p.Gln113Arg | p.Q113R | Q15437 | protein_coding | deleterious(0.01) | benign(0.14) | TCGA-2W-A8YY-01 | Cervix | cervical & endocervical cancer | Female | <65 | I/II | Chemotherapy | cisplatin | CR |
| SEC23B | SNV | Missense_Mutation | | c.526N>T | p.His176Tyr | p.H176Y | Q15437 | protein_coding | tolerated(0.09) | benign(0.405) | TCGA-EK-A3GK-01 | Cervix | cervical & endocervical cancer | Female | <65 | I/II | Unknown | Unknown | SD |
| SEC23B | SNV | Missense_Mutation | novel | c.279N>C | p.Gln93His | p.Q93H | Q15437 | protein_coding | tolerated(1) | benign(0.009) | TCGA-JW-A5VL-01 | Cervix | cervical & endocervical cancer | Female | <65 | I/II | Unknown | Unknown | SD |


