| Tissue | Expression Dynamics | Abbreviation |
| Colorectum (GSE201348) |  | FAP: Familial adenomatous polyposis |
| CRC: Colorectal cancer |
| Colorectum (HTA11) |  | AD: Adenomas |
| SER: Sessile serrated lesions |
| MSI-H: Microsatellite-high colorectal cancer |
| MSS: Microsatellite stable colorectal cancer |
| Esophagus |  | ESCC: Esophageal squamous cell carcinoma |
| HGIN: High-grade intraepithelial neoplasias |
| LGIN: Low-grade intraepithelial neoplasias |
| Liver | 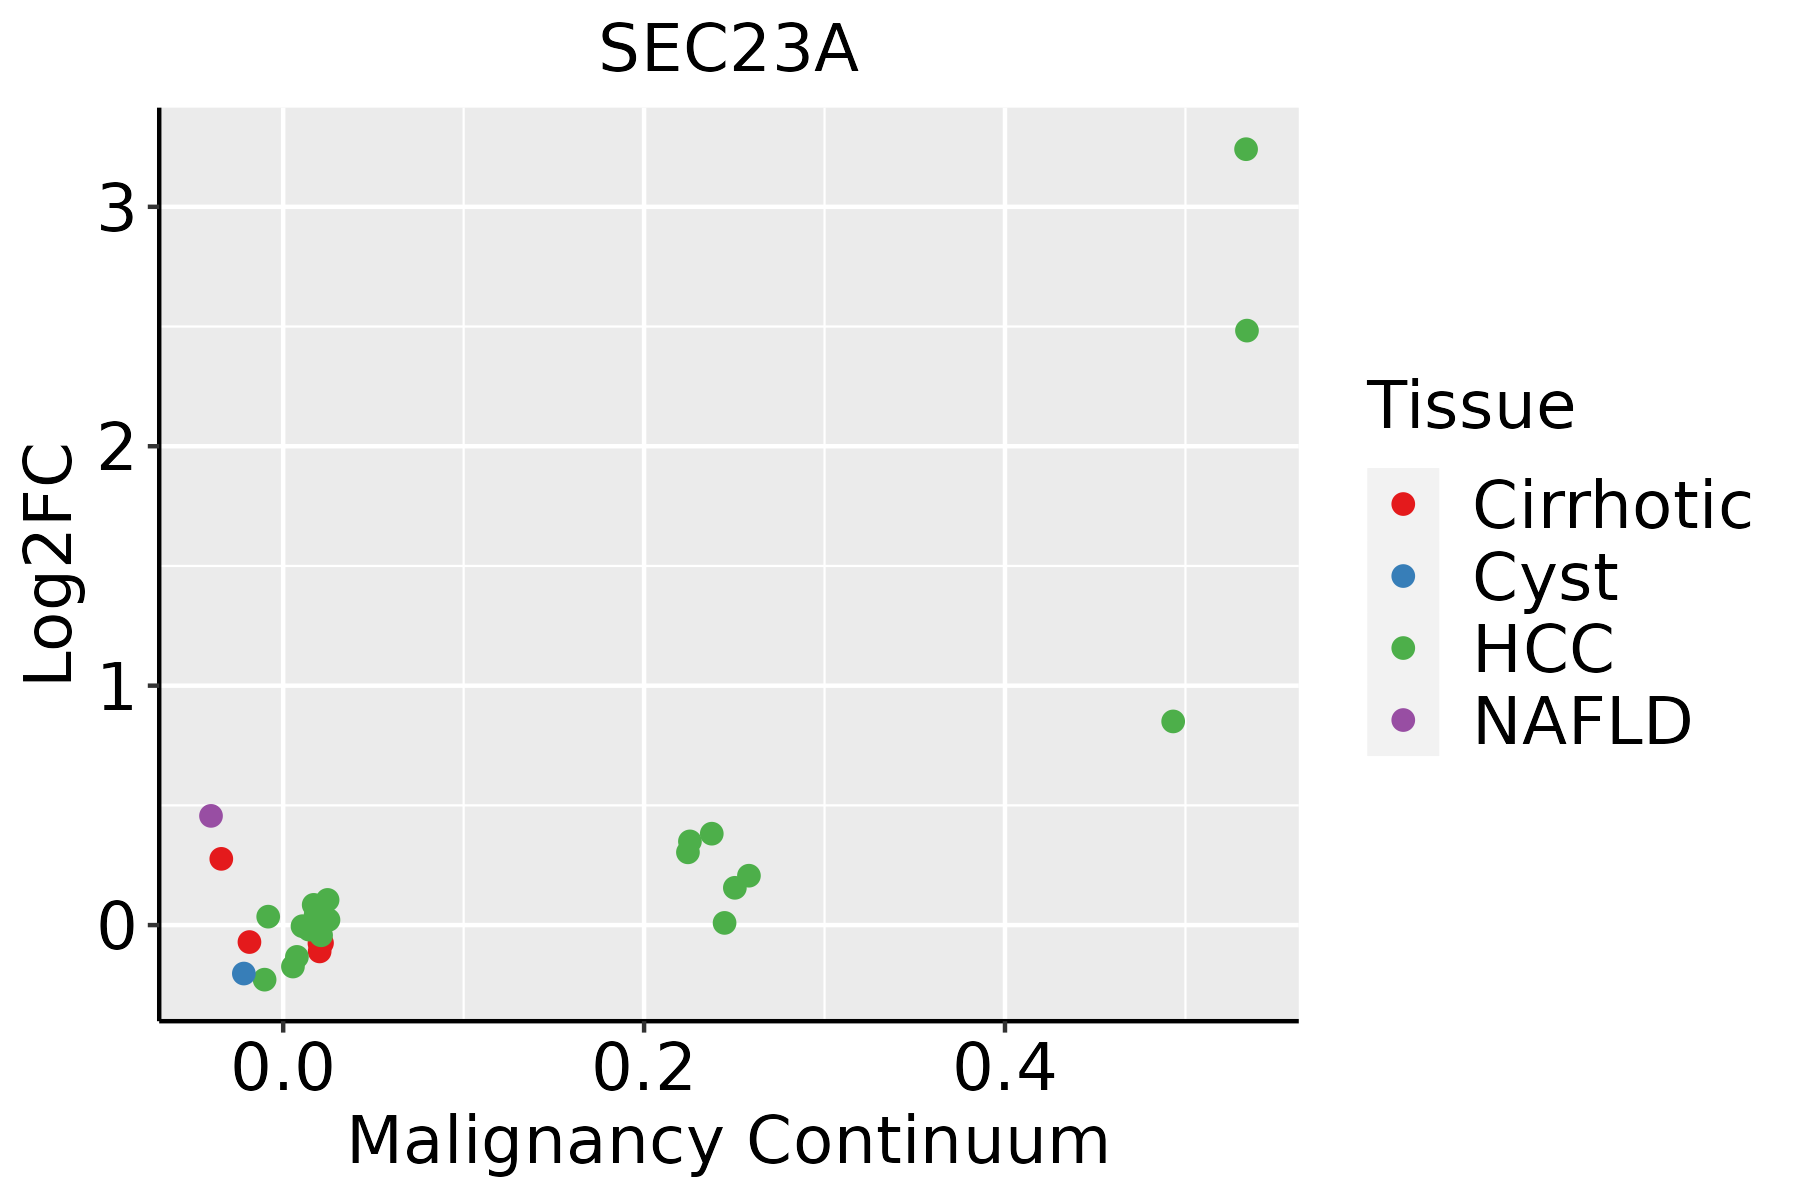 | HCC: Hepatocellular carcinoma |
| NAFLD: Non-alcoholic fatty liver disease |
| Lung | 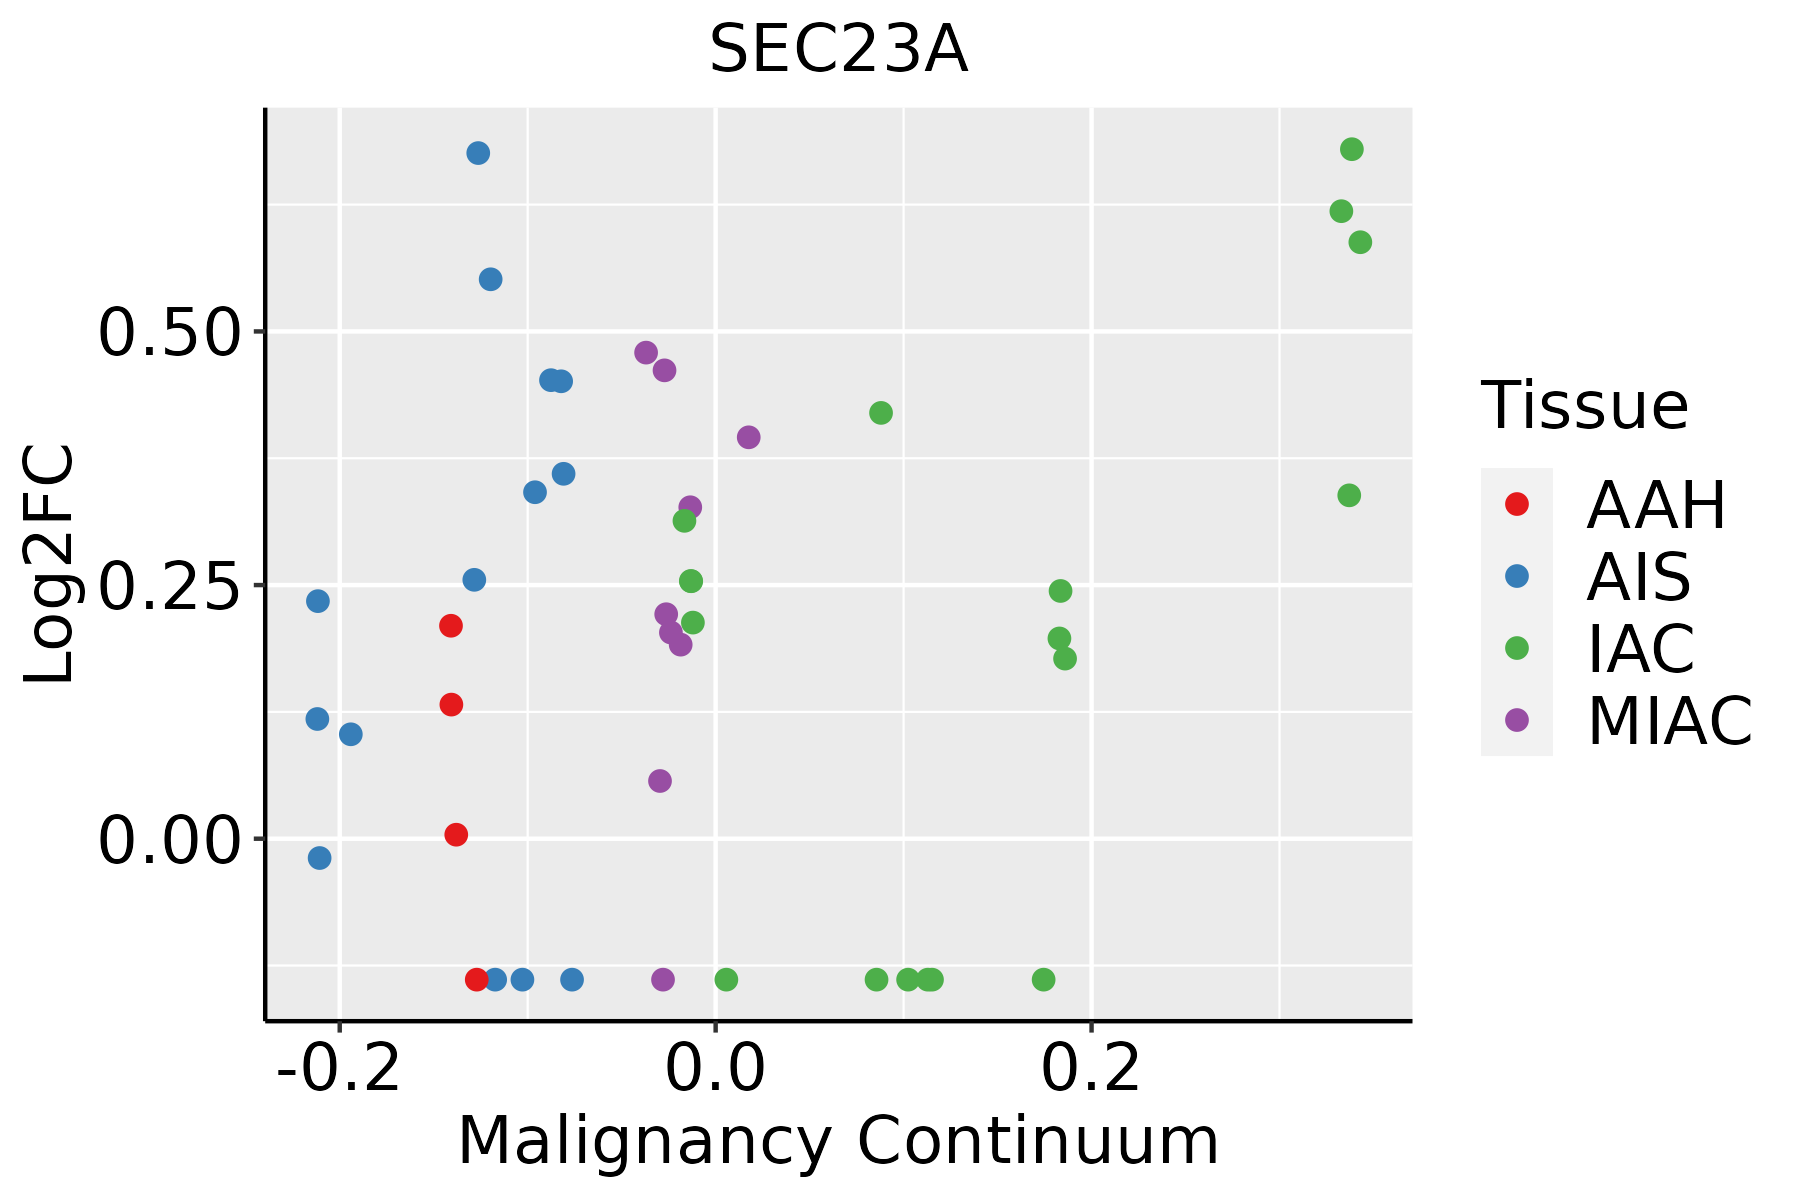 | AAH: Atypical adenomatous hyperplasia |
| AIS: Adenocarcinoma in situ |
| IAC: Invasive lung adenocarcinoma |
| MIA: Minimally invasive adenocarcinoma |
| Oral Cavity |  | EOLP: Erosive Oral lichen planus |
| LP: leukoplakia |
| NEOLP: Non-erosive oral lichen planus |
| OSCC: Oral squamous cell carcinoma |
| Skin |  | AK: Actinic keratosis |
| cSCC: Cutaneous squamous cell carcinoma |
| SCCIS:squamous cell carcinoma in situ |
| Thyroid | 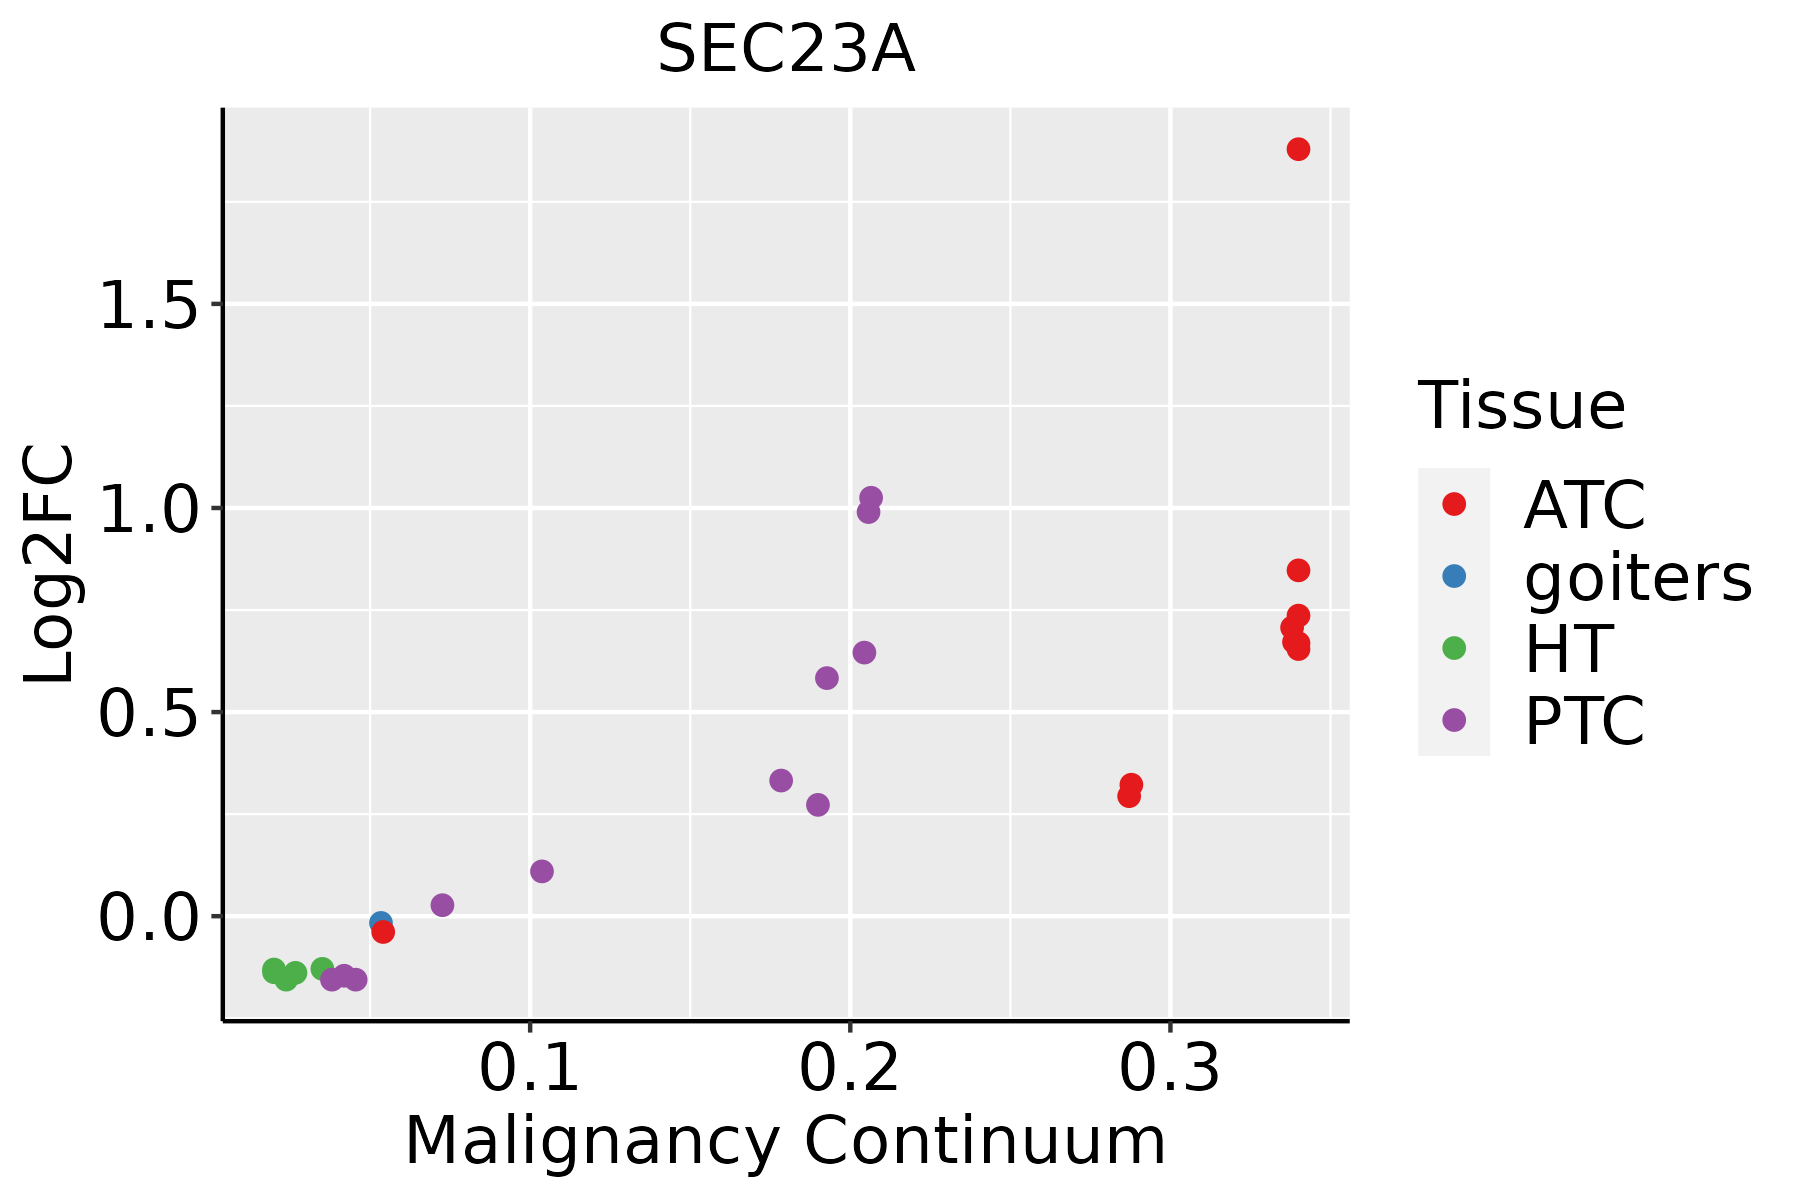 | ATC: Anaplastic thyroid cancer |
| HT: Hashimoto's thyroiditis |
| PTC: Papillary thyroid cancer |
| GO ID | Tissue | Disease Stage | Description | Gene Ratio | Bg Ratio | pvalue | p.adjust | Count |
| GO:0072659 | Colorectum | AD | protein localization to plasma membrane | 122/3918 | 284/18723 | 2.86e-17 | 1.49e-14 | 122 |
| GO:1990778 | Colorectum | AD | protein localization to cell periphery | 129/3918 | 333/18723 | 5.51e-14 | 1.15e-11 | 129 |
| GO:0048193 | Colorectum | AD | Golgi vesicle transport | 109/3918 | 296/18723 | 1.80e-10 | 1.68e-08 | 109 |
| GO:0006900 | Colorectum | AD | vesicle budding from membrane | 32/3918 | 61/18723 | 5.38e-08 | 2.81e-06 | 32 |
| GO:0016050 | Colorectum | AD | vesicle organization | 101/3918 | 300/18723 | 1.65e-07 | 7.17e-06 | 101 |
| GO:0006888 | Colorectum | AD | endoplasmic reticulum to Golgi vesicle-mediated transport | 44/3918 | 130/18723 | 4.13e-04 | 4.68e-03 | 44 |
| GO:00726592 | Colorectum | MSS | protein localization to plasma membrane | 113/3467 | 284/18723 | 3.23e-17 | 1.55e-14 | 113 |
| GO:19907782 | Colorectum | MSS | protein localization to cell periphery | 120/3467 | 333/18723 | 2.02e-14 | 5.47e-12 | 120 |
| GO:00481932 | Colorectum | MSS | Golgi vesicle transport | 101/3467 | 296/18723 | 9.09e-11 | 9.77e-09 | 101 |
| GO:00069002 | Colorectum | MSS | vesicle budding from membrane | 31/3467 | 61/18723 | 1.17e-08 | 7.06e-07 | 31 |
| GO:00160502 | Colorectum | MSS | vesicle organization | 93/3467 | 300/18723 | 1.04e-07 | 4.97e-06 | 93 |
| GO:00068882 | Colorectum | MSS | endoplasmic reticulum to Golgi vesicle-mediated transport | 44/3467 | 130/18723 | 2.17e-05 | 4.60e-04 | 44 |
| GO:0090114 | Colorectum | MSS | COPII-coated vesicle budding | 12/3467 | 29/18723 | 3.60e-03 | 2.66e-02 | 12 |
| GO:0035459 | Colorectum | MSS | vesicle cargo loading | 11/3467 | 27/18723 | 6.03e-03 | 4.04e-02 | 11 |
| GO:00726594 | Colorectum | FAP | protein localization to plasma membrane | 95/2622 | 284/18723 | 4.86e-17 | 9.93e-14 | 95 |
| GO:19907784 | Colorectum | FAP | protein localization to cell periphery | 100/2622 | 333/18723 | 2.19e-14 | 2.68e-11 | 100 |
| GO:00481934 | Colorectum | FAP | Golgi vesicle transport | 77/2622 | 296/18723 | 2.86e-08 | 2.62e-06 | 77 |
| GO:00069004 | Colorectum | FAP | vesicle budding from membrane | 26/2622 | 61/18723 | 4.65e-08 | 3.86e-06 | 26 |
| GO:00160503 | Colorectum | FAP | vesicle organization | 74/2622 | 300/18723 | 5.16e-07 | 2.66e-05 | 74 |
| GO:00901141 | Colorectum | FAP | COPII-coated vesicle budding | 11/2622 | 29/18723 | 1.20e-03 | 1.14e-02 | 11 |
| Pathway ID | Tissue | Disease Stage | Description | Gene Ratio | Bg Ratio | pvalue | p.adjust | qvalue | Count |
| hsa04141 | Colorectum | AD | Protein processing in endoplasmic reticulum | 80/2092 | 174/8465 | 5.96e-10 | 1.25e-08 | 7.96e-09 | 80 |
| hsa041411 | Colorectum | AD | Protein processing in endoplasmic reticulum | 80/2092 | 174/8465 | 5.96e-10 | 1.25e-08 | 7.96e-09 | 80 |
| hsa041414 | Colorectum | MSS | Protein processing in endoplasmic reticulum | 75/1875 | 174/8465 | 3.78e-10 | 8.44e-09 | 5.17e-09 | 75 |
| hsa041415 | Colorectum | MSS | Protein processing in endoplasmic reticulum | 75/1875 | 174/8465 | 3.78e-10 | 8.44e-09 | 5.17e-09 | 75 |
| hsa041418 | Colorectum | FAP | Protein processing in endoplasmic reticulum | 50/1404 | 174/8465 | 3.64e-05 | 3.68e-04 | 2.24e-04 | 50 |
| hsa041419 | Colorectum | FAP | Protein processing in endoplasmic reticulum | 50/1404 | 174/8465 | 3.64e-05 | 3.68e-04 | 2.24e-04 | 50 |
| hsa04141211 | Esophagus | ESCC | Protein processing in endoplasmic reticulum | 147/4205 | 174/8465 | 3.29e-22 | 1.10e-19 | 5.64e-20 | 147 |
| hsa04141310 | Esophagus | ESCC | Protein processing in endoplasmic reticulum | 147/4205 | 174/8465 | 3.29e-22 | 1.10e-19 | 5.64e-20 | 147 |
| hsa0414114 | Liver | Cirrhotic | Protein processing in endoplasmic reticulum | 114/2530 | 174/8465 | 1.16e-22 | 9.67e-21 | 5.96e-21 | 114 |
| hsa0414115 | Liver | Cirrhotic | Protein processing in endoplasmic reticulum | 114/2530 | 174/8465 | 1.16e-22 | 9.67e-21 | 5.96e-21 | 114 |
| hsa0414122 | Liver | HCC | Protein processing in endoplasmic reticulum | 146/4020 | 174/8465 | 7.34e-24 | 2.46e-21 | 1.37e-21 | 146 |
| hsa0414132 | Liver | HCC | Protein processing in endoplasmic reticulum | 146/4020 | 174/8465 | 7.34e-24 | 2.46e-21 | 1.37e-21 | 146 |
| hsa0414116 | Lung | IAC | Protein processing in endoplasmic reticulum | 37/1053 | 174/8465 | 6.53e-04 | 5.73e-03 | 3.81e-03 | 37 |
| hsa0414117 | Lung | IAC | Protein processing in endoplasmic reticulum | 37/1053 | 174/8465 | 6.53e-04 | 5.73e-03 | 3.81e-03 | 37 |
| hsa0414123 | Lung | AIS | Protein processing in endoplasmic reticulum | 35/961 | 174/8465 | 4.88e-04 | 4.39e-03 | 2.81e-03 | 35 |
| hsa0414133 | Lung | AIS | Protein processing in endoplasmic reticulum | 35/961 | 174/8465 | 4.88e-04 | 4.39e-03 | 2.81e-03 | 35 |
| hsa0414130 | Oral cavity | OSCC | Protein processing in endoplasmic reticulum | 143/3704 | 174/8465 | 6.82e-26 | 2.28e-23 | 1.16e-23 | 143 |
| hsa04141113 | Oral cavity | OSCC | Protein processing in endoplasmic reticulum | 143/3704 | 174/8465 | 6.82e-26 | 2.28e-23 | 1.16e-23 | 143 |
| hsa0414145 | Oral cavity | EOLP | Protein processing in endoplasmic reticulum | 70/1218 | 174/8465 | 2.84e-17 | 3.06e-15 | 1.81e-15 | 70 |
| hsa0414155 | Oral cavity | EOLP | Protein processing in endoplasmic reticulum | 70/1218 | 174/8465 | 2.84e-17 | 3.06e-15 | 1.81e-15 | 70 |
| Hugo Symbol | Variant Class | Variant Classification | dbSNP RS | HGVSc | HGVSp | HGVSp Short | SWISSPROT | BIOTYPE | SIFT | PolyPhen | Tumor Sample Barcode | Tissue | Histology | Sex | Age | Stage | Therapy Types | Drugs | Outcome |
| SEC23A | SNV | Missense_Mutation | | c.1330N>A | p.Cys444Ser | p.C444S | Q15436 | protein_coding | tolerated(1) | benign(0.001) | TCGA-AN-A0FV-01 | Breast | breast invasive carcinoma | Female | <65 | I/II | Unknown | Unknown | SD |
| SEC23A | SNV | Missense_Mutation | novel | c.2071G>A | p.Asp691Asn | p.D691N | Q15436 | protein_coding | deleterious(0.01) | probably_damaging(0.965) | TCGA-BH-A0B6-01 | Breast | breast invasive carcinoma | Female | <65 | I/II | Unknown | Unknown | SD |
| SEC23A | SNV | Missense_Mutation | | c.893C>T | p.Pro298Leu | p.P298L | Q15436 | protein_coding | deleterious(0.02) | possibly_damaging(0.782) | TCGA-C8-A12T-01 | Breast | breast invasive carcinoma | Female | <65 | I/II | Unknown | Unknown | SD |
| SEC23A | SNV | Missense_Mutation | | c.1690G>A | p.Asp564Asn | p.D564N | Q15436 | protein_coding | deleterious(0.04) | benign(0.06) | TCGA-GM-A2DB-01 | Breast | breast invasive carcinoma | Female | <65 | I/II | Chemotherapy | taxol | CR |
| SEC23A | insertion | Frame_Shift_Ins | novel | c.640_641insAT | p.Ala214AspfsTer24 | p.A214Dfs*24 | Q15436 | protein_coding | | | TCGA-BH-A0AY-01 | Breast | breast invasive carcinoma | Female | <65 | I/II | Chemotherapy | | SD |
| SEC23A | insertion | Nonsense_Mutation | novel | c.638_639insTCCCAGCACTTTGGGAGGCTGAGGTGGGC | p.Gln213HisfsTer8 | p.Q213Hfs*8 | Q15436 | protein_coding | | | TCGA-BH-A0AY-01 | Breast | breast invasive carcinoma | Female | <65 | I/II | Chemotherapy | | SD |
| SEC23A | SNV | Missense_Mutation | rs756632254 | c.197N>A | p.Cys66Tyr | p.C66Y | Q15436 | protein_coding | deleterious(0) | probably_damaging(1) | TCGA-2W-A8YY-01 | Cervix | cervical & endocervical cancer | Female | <65 | I/II | Chemotherapy | cisplatin | CR |
| SEC23A | SNV | Missense_Mutation | rs572679988 | c.1478G>A | p.Arg493His | p.R493H | Q15436 | protein_coding | tolerated(0.09) | possibly_damaging(0.531) | TCGA-EA-A3HU-01 | Cervix | cervical & endocervical cancer | Female | <65 | I/II | Unknown | Unknown | SD |
| SEC23A | SNV | Missense_Mutation | | c.344C>G | p.Ser115Cys | p.S115C | Q15436 | protein_coding | deleterious(0.02) | possibly_damaging(0.827) | TCGA-EK-A2PL-01 | Cervix | cervical & endocervical cancer | Female | <65 | III/IV | Unknown | Unknown | SD |
| SEC23A | SNV | Missense_Mutation | | c.1828C>G | p.Gln610Glu | p.Q610E | Q15436 | protein_coding | tolerated(1) | benign(0.001) | TCGA-FU-A40J-01 | Cervix | cervical & endocervical cancer | Female | <65 | III/IV | Chemotherapy | carboplatin | CR |


