
|
|||||
|
 | |
| |
| |
| |
| |
| |
|
Gene: SEC22C |
Gene summary for SEC22C |
| Gene information | Species | Human | Gene symbol | SEC22C | Gene ID | 9117 |
| Gene name | SEC22 homolog C, vesicle trafficking protein | |
| Gene Alias | SEC22L3 | |
| Cytomap | 3p22.1 | |
| Gene Type | protein-coding | GO ID | GO:0006810 | UniProtAcc | A0A024R2Q1 |
Top |
Malignant transformation analysis |
| Identification of the aberrant gene expression in precancerous and cancerous lesions by comparing the gene expression of stem-like cells in diseased tissues with normal stem cells |
| Entrez ID | Symbol | Replicates | Species | Organ | Tissue | Adj P-value | Log2FC | Malignancy |
| 9117 | SEC22C | LZE4T | Human | Esophagus | ESCC | 1.33e-11 | 3.51e-01 | 0.0811 |
| 9117 | SEC22C | LZE7T | Human | Esophagus | ESCC | 5.52e-04 | 2.20e-01 | 0.0667 |
| 9117 | SEC22C | LZE8T | Human | Esophagus | ESCC | 2.21e-04 | 3.51e-02 | 0.067 |
| 9117 | SEC22C | LZE24T | Human | Esophagus | ESCC | 3.04e-05 | 1.68e-01 | 0.0596 |
| 9117 | SEC22C | LZE6T | Human | Esophagus | ESCC | 9.37e-06 | 1.38e-01 | 0.0845 |
| 9117 | SEC22C | P2T-E | Human | Esophagus | ESCC | 1.79e-11 | 1.73e-01 | 0.1177 |
| 9117 | SEC22C | P4T-E | Human | Esophagus | ESCC | 7.55e-23 | 4.57e-01 | 0.1323 |
| 9117 | SEC22C | P5T-E | Human | Esophagus | ESCC | 5.12e-15 | 1.69e-01 | 0.1327 |
| 9117 | SEC22C | P8T-E | Human | Esophagus | ESCC | 4.69e-13 | 1.36e-01 | 0.0889 |
| 9117 | SEC22C | P9T-E | Human | Esophagus | ESCC | 1.40e-09 | 1.68e-01 | 0.1131 |
| 9117 | SEC22C | P10T-E | Human | Esophagus | ESCC | 1.32e-15 | 2.63e-01 | 0.116 |
| 9117 | SEC22C | P11T-E | Human | Esophagus | ESCC | 6.20e-12 | 4.87e-01 | 0.1426 |
| 9117 | SEC22C | P12T-E | Human | Esophagus | ESCC | 4.31e-25 | 5.43e-01 | 0.1122 |
| 9117 | SEC22C | P15T-E | Human | Esophagus | ESCC | 1.60e-13 | 2.18e-01 | 0.1149 |
| 9117 | SEC22C | P16T-E | Human | Esophagus | ESCC | 4.18e-23 | 2.24e-01 | 0.1153 |
| 9117 | SEC22C | P17T-E | Human | Esophagus | ESCC | 4.78e-05 | 2.61e-01 | 0.1278 |
| 9117 | SEC22C | P19T-E | Human | Esophagus | ESCC | 3.43e-09 | 5.26e-01 | 0.1662 |
| 9117 | SEC22C | P20T-E | Human | Esophagus | ESCC | 5.23e-10 | 1.17e-01 | 0.1124 |
| 9117 | SEC22C | P21T-E | Human | Esophagus | ESCC | 1.49e-31 | 5.15e-01 | 0.1617 |
| 9117 | SEC22C | P22T-E | Human | Esophagus | ESCC | 1.08e-24 | 3.13e-01 | 0.1236 |
| Page: 1 2 3 4 5 |
| Tissue | Expression Dynamics | Abbreviation |
| Esophagus | 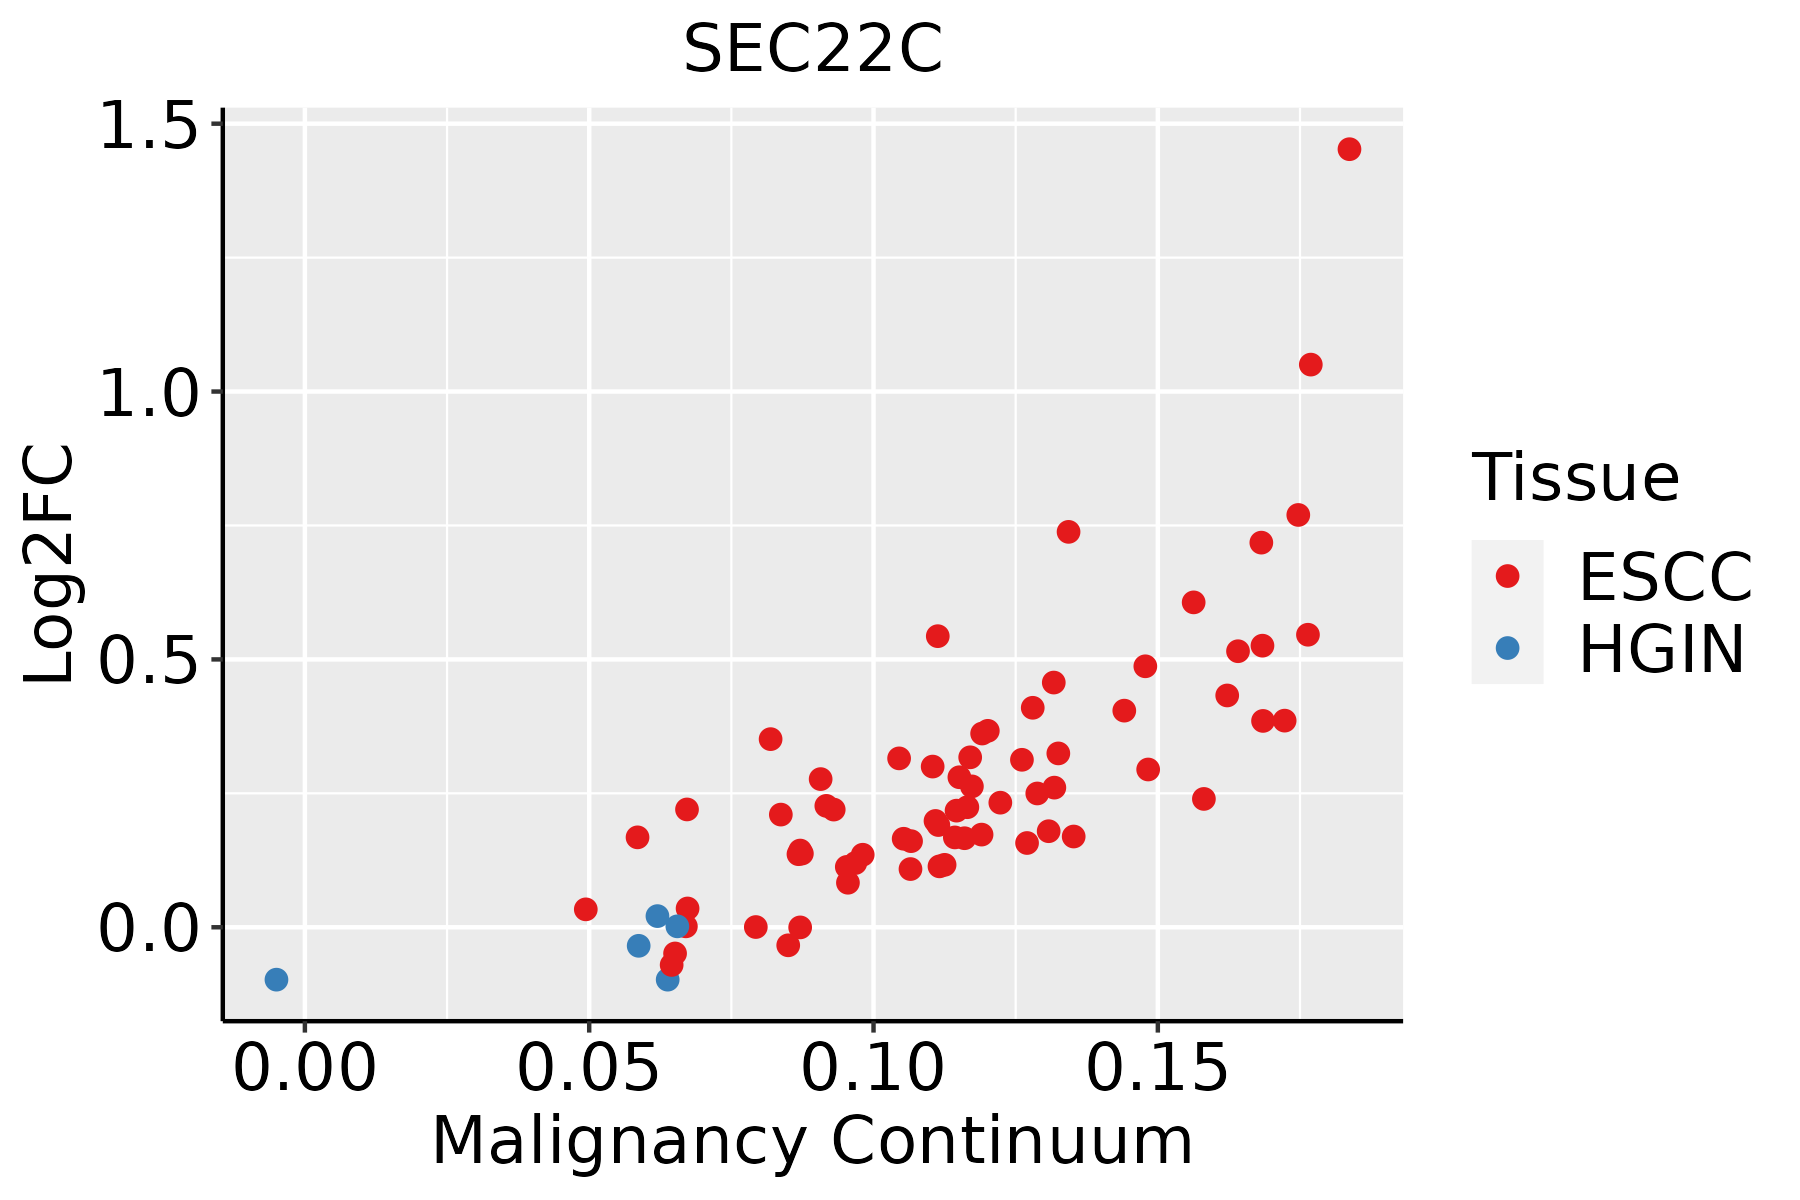 | ESCC: Esophageal squamous cell carcinoma |
| HGIN: High-grade intraepithelial neoplasias | ||
| LGIN: Low-grade intraepithelial neoplasias | ||
| Liver | 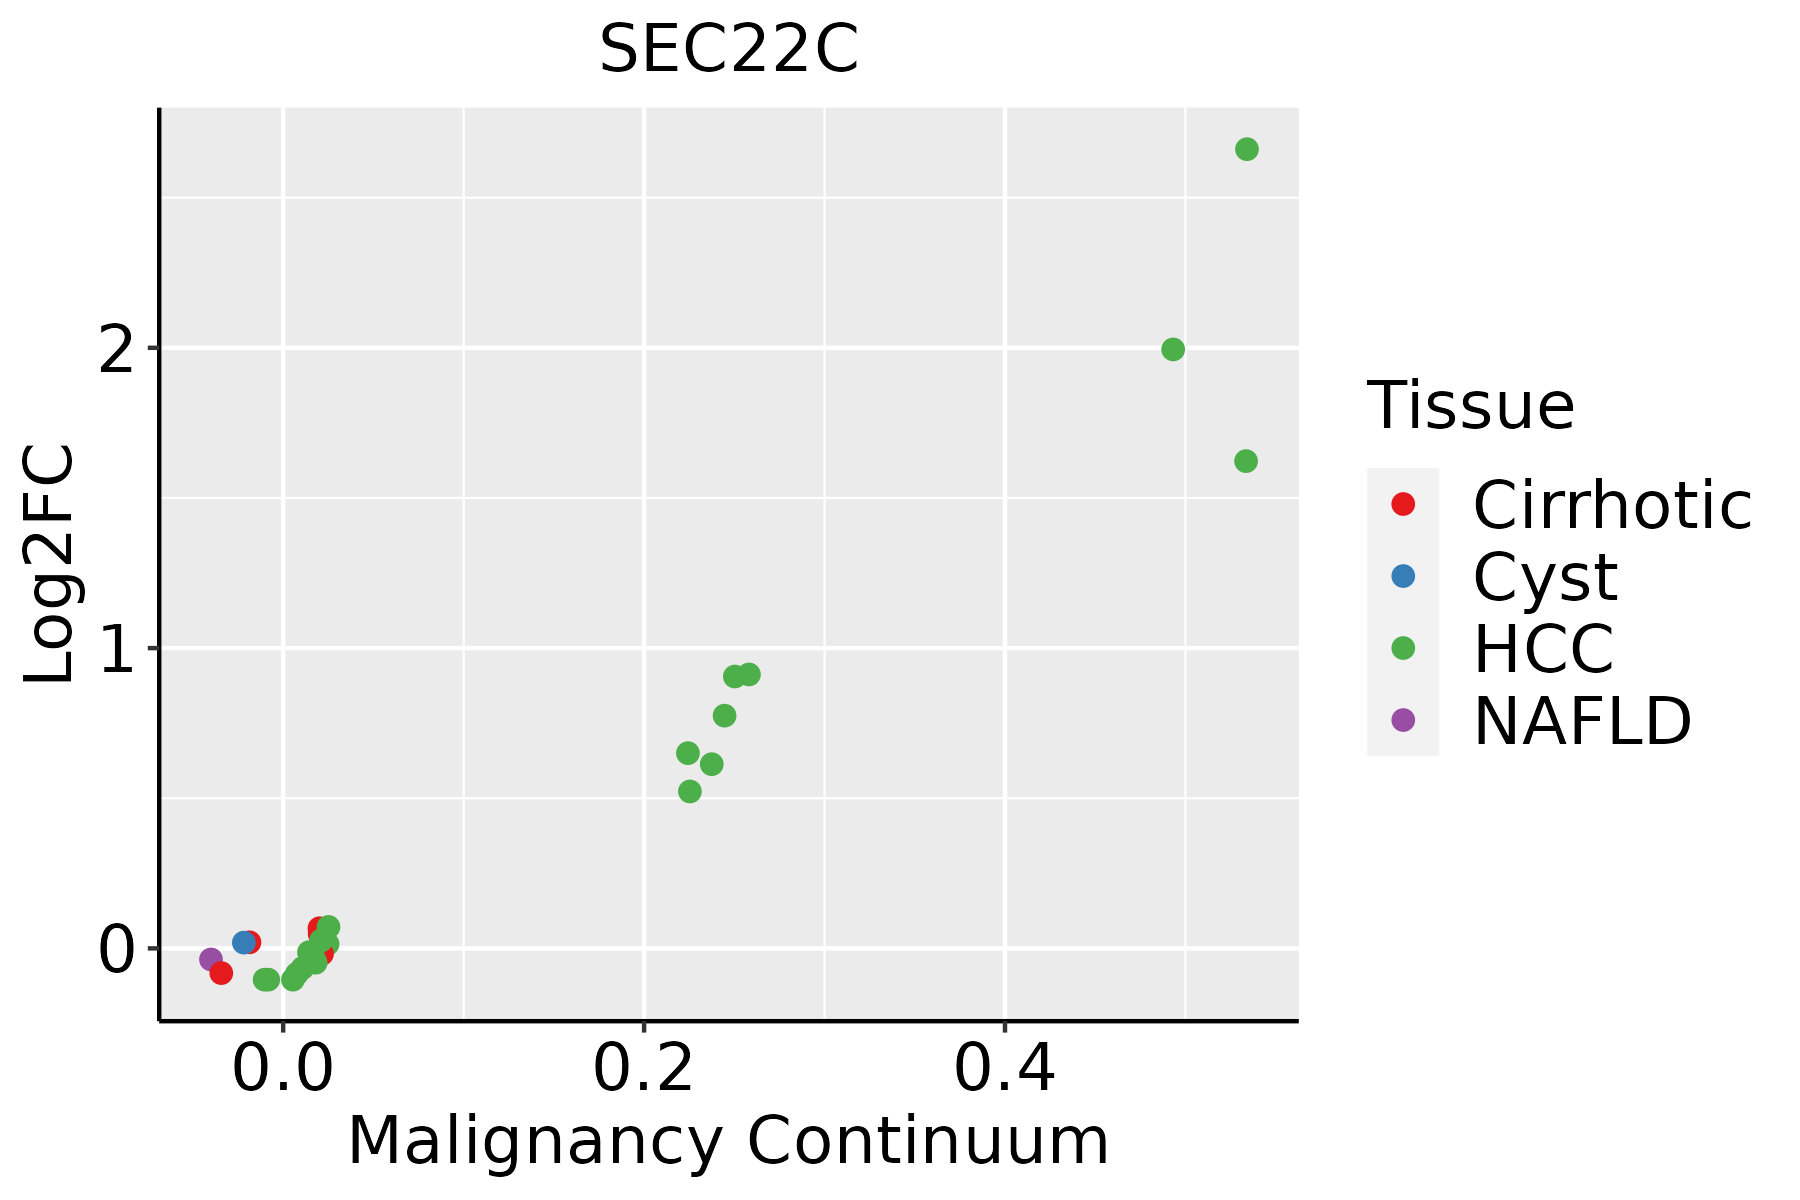 | HCC: Hepatocellular carcinoma |
| NAFLD: Non-alcoholic fatty liver disease | ||
| Oral Cavity | 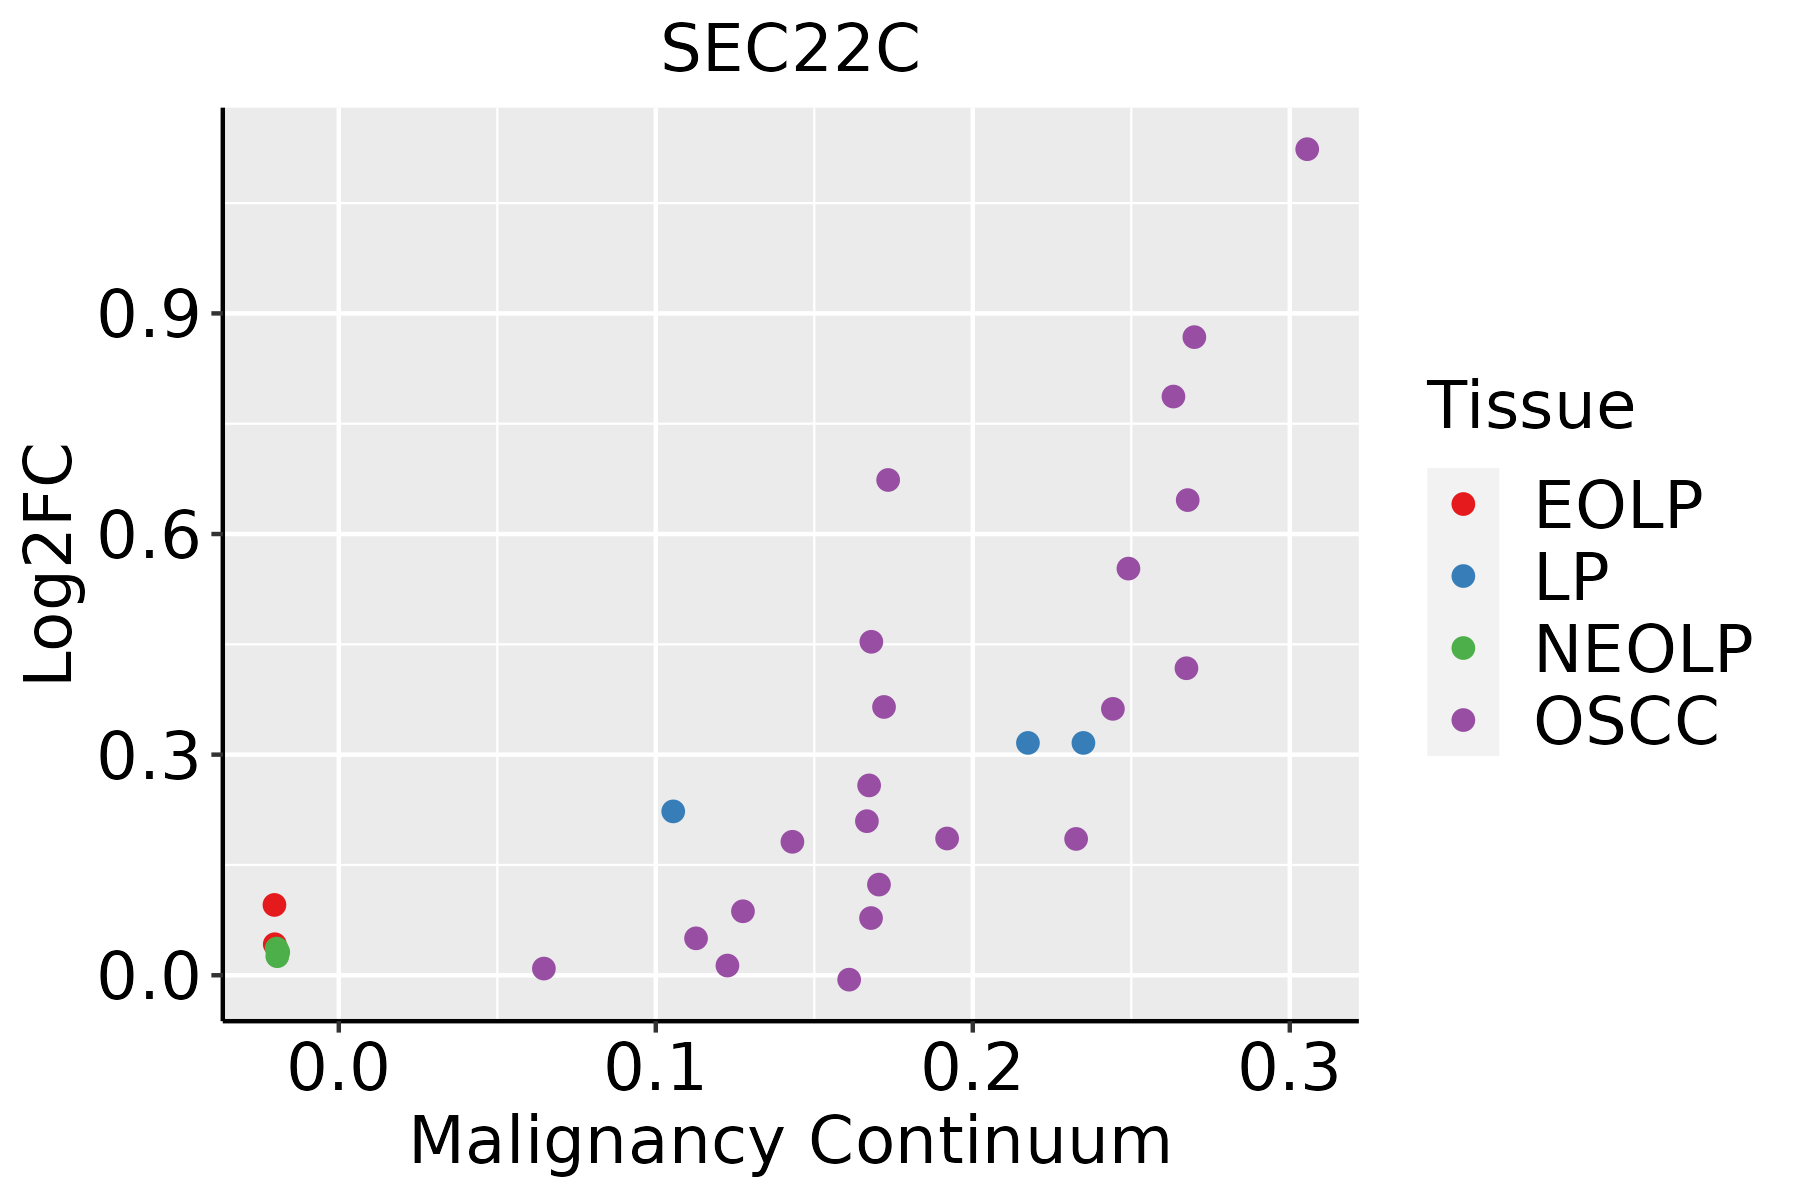 | EOLP: Erosive Oral lichen planus |
| LP: leukoplakia | ||
| NEOLP: Non-erosive oral lichen planus | ||
| OSCC: Oral squamous cell carcinoma | ||
| Prostate | 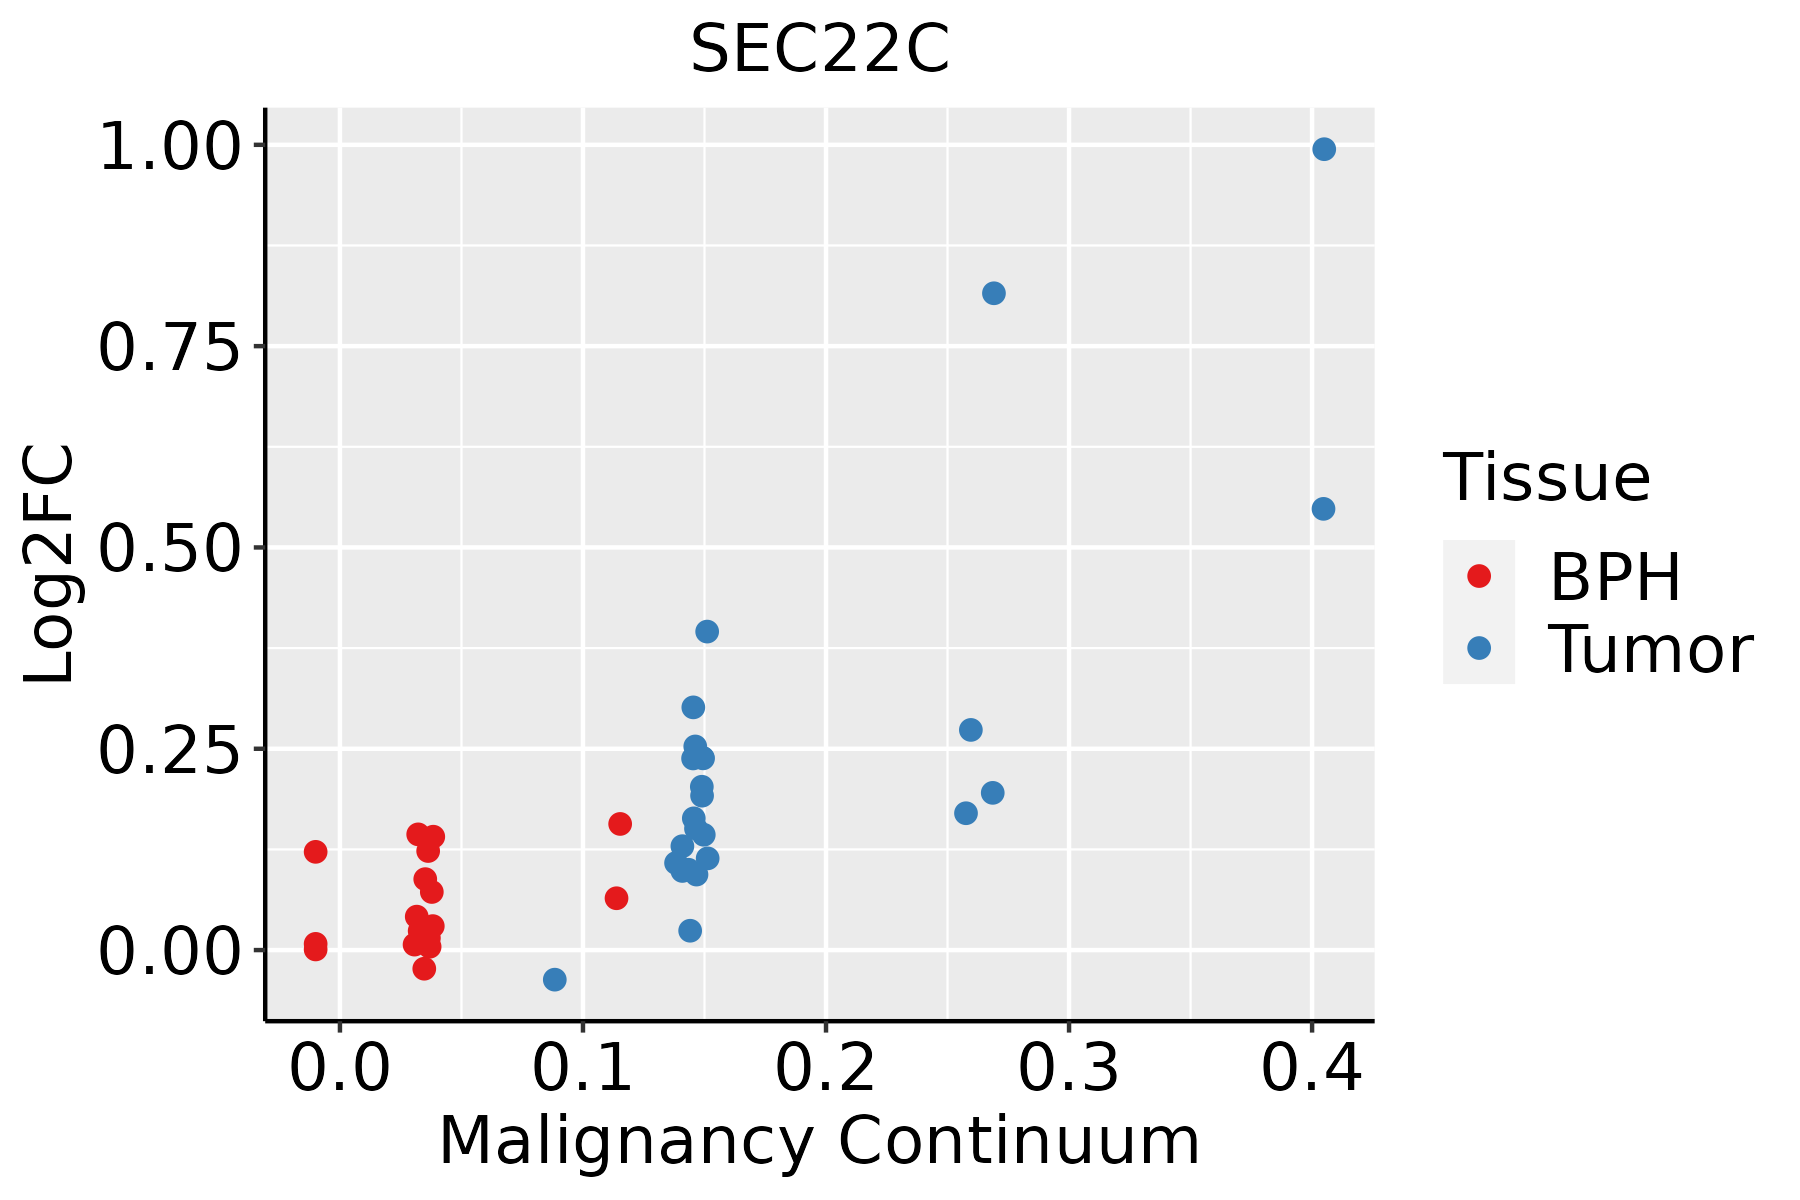 | BPH: Benign Prostatic Hyperplasia |
| Skin | 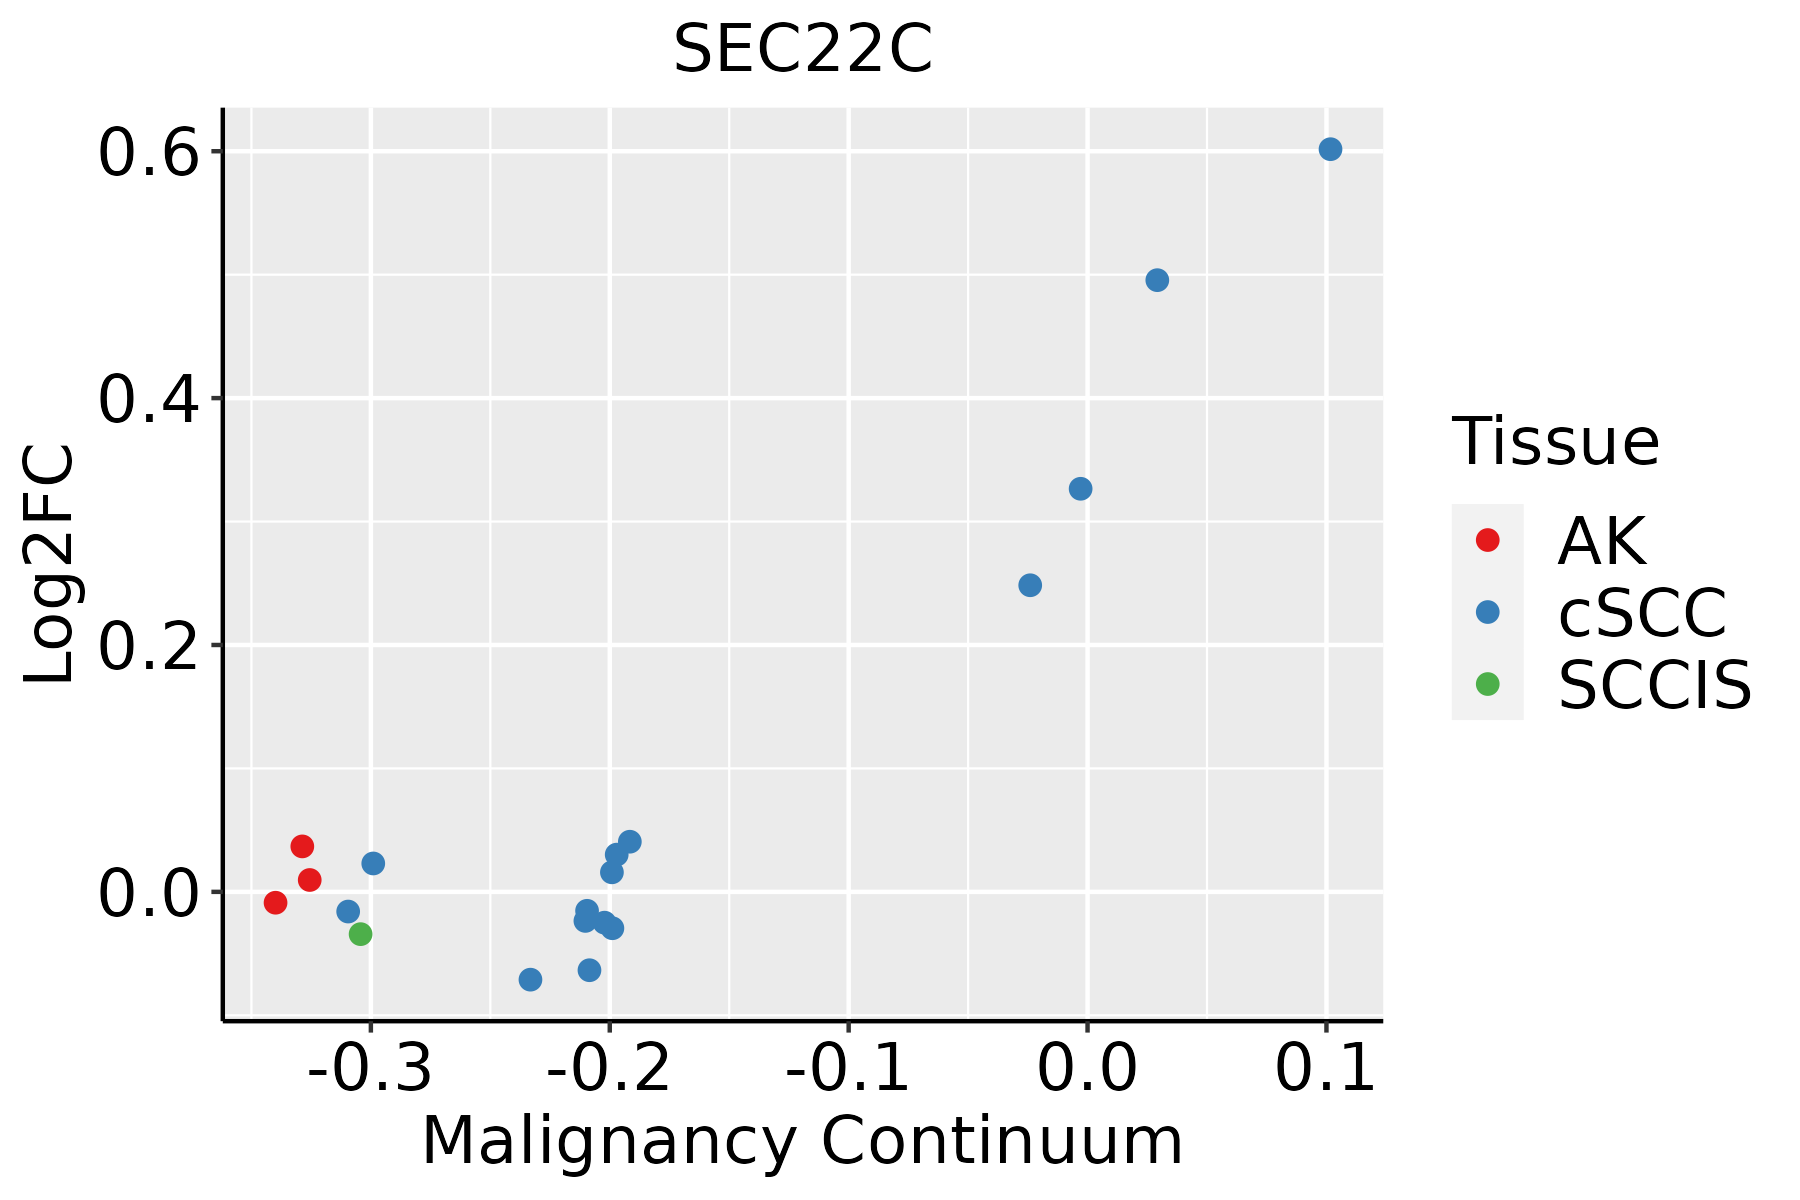 | AK: Actinic keratosis |
| cSCC: Cutaneous squamous cell carcinoma | ||
| SCCIS:squamous cell carcinoma in situ | ||
| Thyroid | 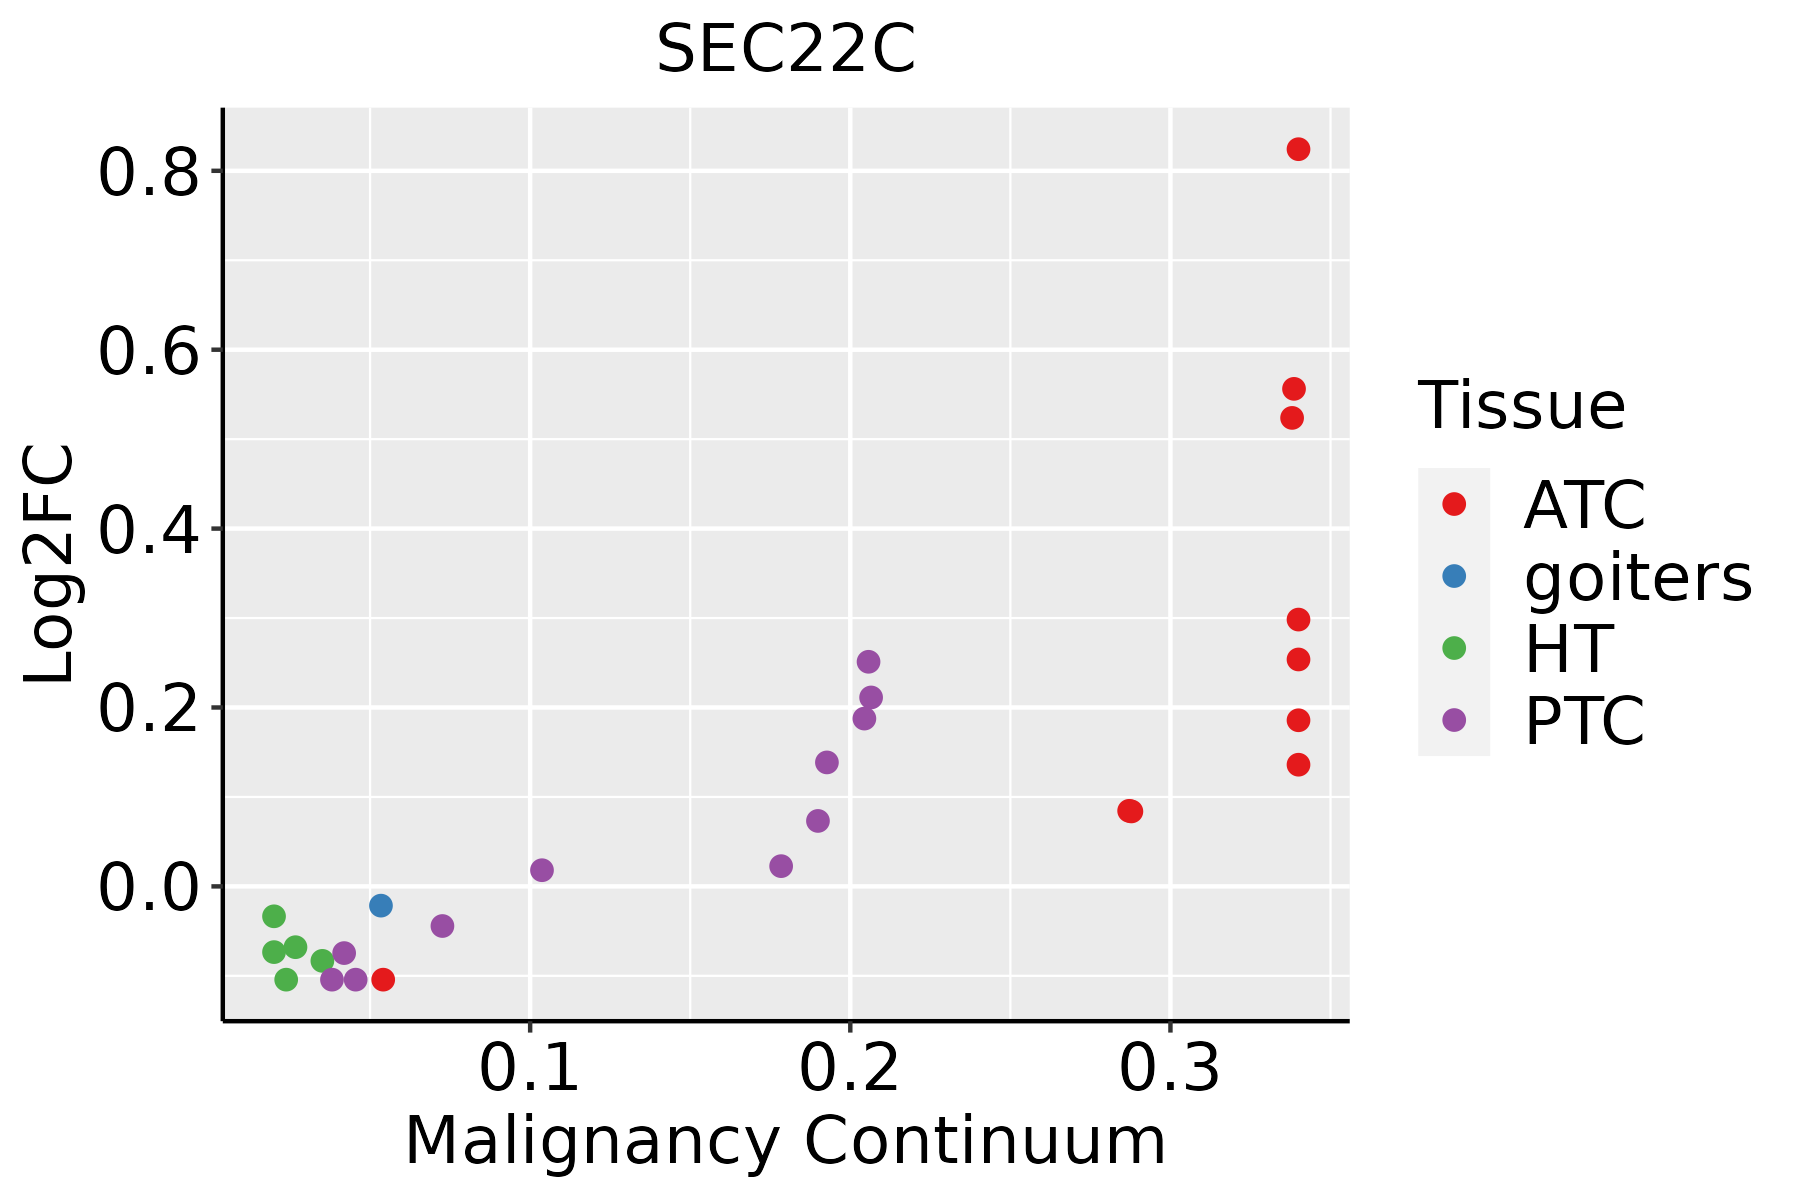 | ATC: Anaplastic thyroid cancer |
| HT: Hashimoto's thyroiditis | ||
| PTC: Papillary thyroid cancer |
| ∗log2FC in expression of this searched gene in stem-like cells from each diseased tissue sample relative to stem-like cells in normal samples in each tissue plotted against the malignancy continuum. Samples are colored based on if they are from different disease stage. |
Top |
Malignant transformation related pathway analysis |
| Find out the enriched GO biological processes and KEGG pathways involved in transition from healthy to precancer to cancer |
| Tissue | Disease Stage | Enriched GO biological Processes |
| Colorectum | AD |  |
| Colorectum | SER |  |
| Colorectum | MSS |  |
| Colorectum | MSI-H |  |
| Colorectum | FAP |  |
| ∗Top 15 enriched GO BP terms are showed in the bar plot of each disease state in each tissue. Each row represents a significant GO biological process which is colored according to the -log10(p.adjust). |
| Page: 1 2 3 4 5 6 7 8 9 |
| GO ID | Tissue | Disease Stage | Description | Gene Ratio | Bg Ratio | pvalue | p.adjust | Count |
| GO:004819318 | Esophagus | ESCC | Golgi vesicle transport | 231/8552 | 296/18723 | 1.82e-30 | 9.63e-28 | 231 |
| GO:000688815 | Esophagus | ESCC | endoplasmic reticulum to Golgi vesicle-mediated transport | 102/8552 | 130/18723 | 1.73e-14 | 9.22e-13 | 102 |
| GO:004819321 | Liver | HCC | Golgi vesicle transport | 217/7958 | 296/18723 | 2.58e-27 | 1.02e-24 | 217 |
| GO:000688821 | Liver | HCC | endoplasmic reticulum to Golgi vesicle-mediated transport | 100/7958 | 130/18723 | 1.15e-15 | 8.67e-14 | 100 |
| GO:004819315 | Oral cavity | OSCC | Golgi vesicle transport | 209/7305 | 296/18723 | 1.39e-28 | 6.30e-26 | 209 |
| GO:00068888 | Oral cavity | OSCC | endoplasmic reticulum to Golgi vesicle-mediated transport | 97/7305 | 130/18723 | 1.42e-16 | 1.15e-14 | 97 |
| GO:004819314 | Prostate | Tumor | Golgi vesicle transport | 105/3246 | 296/18723 | 3.55e-14 | 4.33e-12 | 105 |
| GO:000688813 | Prostate | Tumor | endoplasmic reticulum to Golgi vesicle-mediated transport | 49/3246 | 130/18723 | 2.49e-08 | 8.33e-07 | 49 |
| GO:0048193110 | Skin | cSCC | Golgi vesicle transport | 153/4864 | 296/18723 | 1.85e-21 | 3.41e-19 | 153 |
| GO:000688810 | Skin | cSCC | endoplasmic reticulum to Golgi vesicle-mediated transport | 73/4864 | 130/18723 | 2.60e-13 | 1.57e-11 | 73 |
| GO:004819320 | Thyroid | PTC | Golgi vesicle transport | 186/5968 | 296/18723 | 3.09e-28 | 1.22e-25 | 186 |
| GO:000688817 | Thyroid | PTC | endoplasmic reticulum to Golgi vesicle-mediated transport | 83/5968 | 130/18723 | 6.19e-14 | 3.52e-12 | 83 |
| GO:0048193111 | Thyroid | ATC | Golgi vesicle transport | 189/6293 | 296/18723 | 9.58e-27 | 5.05e-24 | 189 |
| GO:000688823 | Thyroid | ATC | endoplasmic reticulum to Golgi vesicle-mediated transport | 84/6293 | 130/18723 | 4.40e-13 | 1.97e-11 | 84 |
| Page: 1 |
| Pathway ID | Tissue | Disease Stage | Description | Gene Ratio | Bg Ratio | pvalue | p.adjust | qvalue | Count |
| Page: 1 |
Top |
Cell-cell communication analysis |
| Identification of potential cell-cell interactions between two cell types and their ligand-receptor pairs for different disease states |
| Ligand | Receptor | LRpair | Pathway | Tissue | Disease Stage |
| Page: 1 |
Top |
Single-cell gene regulatory network inference analysis |
| Find out the significant the regulons (TFs) and the target genes of each regulon across cell types for different disease states |
| TF | Cell Type | Tissue | Disease Stage | Target Gene | RSS | Regulon Activity |
| ∗The dot plots of a searched regulon are shown for all cell subpopulations in each disease state of each tissue based on the regulon specific score inferred using pySCENIC and by calculating the average expression. |
| Page: 1 |
Top |
Somatic mutation of malignant transformation related genes |
| Annotation of somatic variants for genes involved in malignant transformation |
| Hugo Symbol | Variant Class | Variant Classification | dbSNP RS | HGVSc | HGVSp | HGVSp Short | SWISSPROT | BIOTYPE | SIFT | PolyPhen | Tumor Sample Barcode | Tissue | Histology | Sex | Age | Stage | Therapy Types | Drugs | Outcome |
| SEC22C | SNV | Missense_Mutation | novel | c.448N>A | p.Pro150Thr | p.P150T | Q9BRL7 | protein_coding | deleterious(0.04) | probably_damaging(0.999) | TCGA-OL-A66J-01 | Breast | breast invasive carcinoma | Female | >=65 | I/II | Unknown | Unknown | SD |
| SEC22C | SNV | Missense_Mutation | rs767627993 | c.25N>A | p.Val9Met | p.V9M | Q9BRL7 | protein_coding | deleterious(0) | possibly_damaging(0.791) | TCGA-AZ-6601-01 | Colorectum | colon adenocarcinoma | Male | >=65 | I/II | Unknown | Unknown | PD |
| SEC22C | SNV | Missense_Mutation | rs759546532 | c.31N>T | p.Arg11Trp | p.R11W | Q9BRL7 | protein_coding | deleterious(0) | probably_damaging(0.999) | TCGA-G4-6304-01 | Colorectum | colon adenocarcinoma | Female | >=65 | I/II | Chemotherapy | fluorouracil | PD |
| SEC22C | SNV | Missense_Mutation | rs777387356 | c.331G>A | p.Ala111Thr | p.A111T | Q9BRL7 | protein_coding | tolerated(0.15) | possibly_damaging(0.726) | TCGA-DY-A1DD-01 | Colorectum | rectum adenocarcinoma | Female | >=65 | III/IV | Unknown | Unknown | SD |
| SEC22C | deletion | Frame_Shift_Del | c.830delN | p.Phe277SerfsTer3 | p.F277Sfs*3 | Q9BRL7 | protein_coding | TCGA-AA-3811-01 | Colorectum | colon adenocarcinoma | Female | >=65 | III/IV | Unknown | Unknown | PD | |||
| SEC22C | SNV | Missense_Mutation | c.693N>A | p.Phe231Leu | p.F231L | Q9BRL7 | protein_coding | tolerated(0.07) | benign(0.359) | TCGA-A5-A0GM-01 | Endometrium | uterine corpus endometrioid carcinoma | Female | <65 | I/II | Unknown | Unknown | SD | |
| SEC22C | SNV | Missense_Mutation | c.475G>T | p.Asp159Tyr | p.D159Y | Q9BRL7 | protein_coding | deleterious(0.01) | possibly_damaging(0.556) | TCGA-AP-A056-01 | Endometrium | uterine corpus endometrioid carcinoma | Female | <65 | I/II | Unknown | Unknown | SD | |
| SEC22C | SNV | Missense_Mutation | rs773396306 | c.206N>T | p.Ala69Val | p.A69V | Q9BRL7 | protein_coding | deleterious(0.01) | probably_damaging(0.946) | TCGA-AP-A059-01 | Endometrium | uterine corpus endometrioid carcinoma | Female | >=65 | I/II | Unknown | Unknown | SD |
| SEC22C | SNV | Missense_Mutation | novel | c.101G>T | p.Arg34Met | p.R34M | Q9BRL7 | protein_coding | deleterious(0) | probably_damaging(0.921) | TCGA-AP-A1DK-01 | Endometrium | uterine corpus endometrioid carcinoma | Female | <65 | I/II | Unknown | Unknown | SD |
| SEC22C | SNV | Missense_Mutation | rs777387356 | c.331G>A | p.Ala111Thr | p.A111T | Q9BRL7 | protein_coding | tolerated(0.15) | possibly_damaging(0.726) | TCGA-AX-A0J1-01 | Endometrium | uterine corpus endometrioid carcinoma | Female | >=65 | I/II | Unknown | Unknown | SD |
| Page: 1 2 3 |
Top |
Related drugs of malignant transformation related genes |
| Identification of chemicals and drugs interact with genes involved in malignant transfromation |
| (DGIdb 4.0) |
| Entrez ID | Symbol | Category | Interaction Types | Drug Claim Name | Drug Name | PMIDs |
| Page: 1 |

Copyright 2023-Present -The University of Texas Health Science Center at Houston |