
|
|||||
|
 | |
| |
| |
| |
| |
| |
|
Gene: SEC22A |
Gene summary for SEC22A |
| Gene information | Species | Human | Gene symbol | SEC22A | Gene ID | 26984 |
| Gene name | SEC22 homolog A, vesicle trafficking protein | |
| Gene Alias | SEC22L2 | |
| Cytomap | 3q21.1 | |
| Gene Type | protein-coding | GO ID | GO:0006810 | UniProtAcc | Q96IW7 |
Top |
Malignant transformation analysis |
| Identification of the aberrant gene expression in precancerous and cancerous lesions by comparing the gene expression of stem-like cells in diseased tissues with normal stem cells |
| Entrez ID | Symbol | Replicates | Species | Organ | Tissue | Adj P-value | Log2FC | Malignancy |
| 26984 | SEC22A | CCI_1 | Human | Cervix | CC | 1.26e-06 | 6.69e-01 | 0.528 |
| 26984 | SEC22A | CCI_2 | Human | Cervix | CC | 7.43e-14 | 1.01e+00 | 0.5249 |
| 26984 | SEC22A | CCI_3 | Human | Cervix | CC | 2.47e-22 | 1.00e+00 | 0.516 |
| 26984 | SEC22A | sample3 | Human | Cervix | CC | 6.07e-04 | 1.48e-01 | 0.1387 |
| 26984 | SEC22A | LZE4T | Human | Esophagus | ESCC | 3.00e-13 | 4.61e-01 | 0.0811 |
| 26984 | SEC22A | LZE7T | Human | Esophagus | ESCC | 7.43e-03 | 1.66e-01 | 0.0667 |
| 26984 | SEC22A | LZE8T | Human | Esophagus | ESCC | 6.92e-06 | 1.38e-01 | 0.067 |
| 26984 | SEC22A | LZE20T | Human | Esophagus | ESCC | 2.17e-05 | 2.00e-01 | 0.0662 |
| 26984 | SEC22A | LZE24T | Human | Esophagus | ESCC | 2.31e-17 | 3.25e-01 | 0.0596 |
| 26984 | SEC22A | LZE6T | Human | Esophagus | ESCC | 2.32e-02 | 1.43e-01 | 0.0845 |
| 26984 | SEC22A | P2T-E | Human | Esophagus | ESCC | 9.24e-10 | 1.72e-01 | 0.1177 |
| 26984 | SEC22A | P4T-E | Human | Esophagus | ESCC | 8.54e-14 | 2.06e-01 | 0.1323 |
| 26984 | SEC22A | P5T-E | Human | Esophagus | ESCC | 6.23e-09 | 1.96e-01 | 0.1327 |
| 26984 | SEC22A | P8T-E | Human | Esophagus | ESCC | 7.11e-15 | 3.17e-01 | 0.0889 |
| 26984 | SEC22A | P9T-E | Human | Esophagus | ESCC | 1.34e-14 | 2.85e-01 | 0.1131 |
| 26984 | SEC22A | P10T-E | Human | Esophagus | ESCC | 6.91e-22 | 4.04e-01 | 0.116 |
| 26984 | SEC22A | P11T-E | Human | Esophagus | ESCC | 2.78e-13 | 4.61e-01 | 0.1426 |
| 26984 | SEC22A | P12T-E | Human | Esophagus | ESCC | 2.48e-13 | 2.38e-01 | 0.1122 |
| 26984 | SEC22A | P15T-E | Human | Esophagus | ESCC | 2.93e-22 | 3.66e-01 | 0.1149 |
| 26984 | SEC22A | P16T-E | Human | Esophagus | ESCC | 8.30e-16 | 3.00e-01 | 0.1153 |
| Page: 1 2 3 4 |
| Tissue | Expression Dynamics | Abbreviation |
| Cervix | 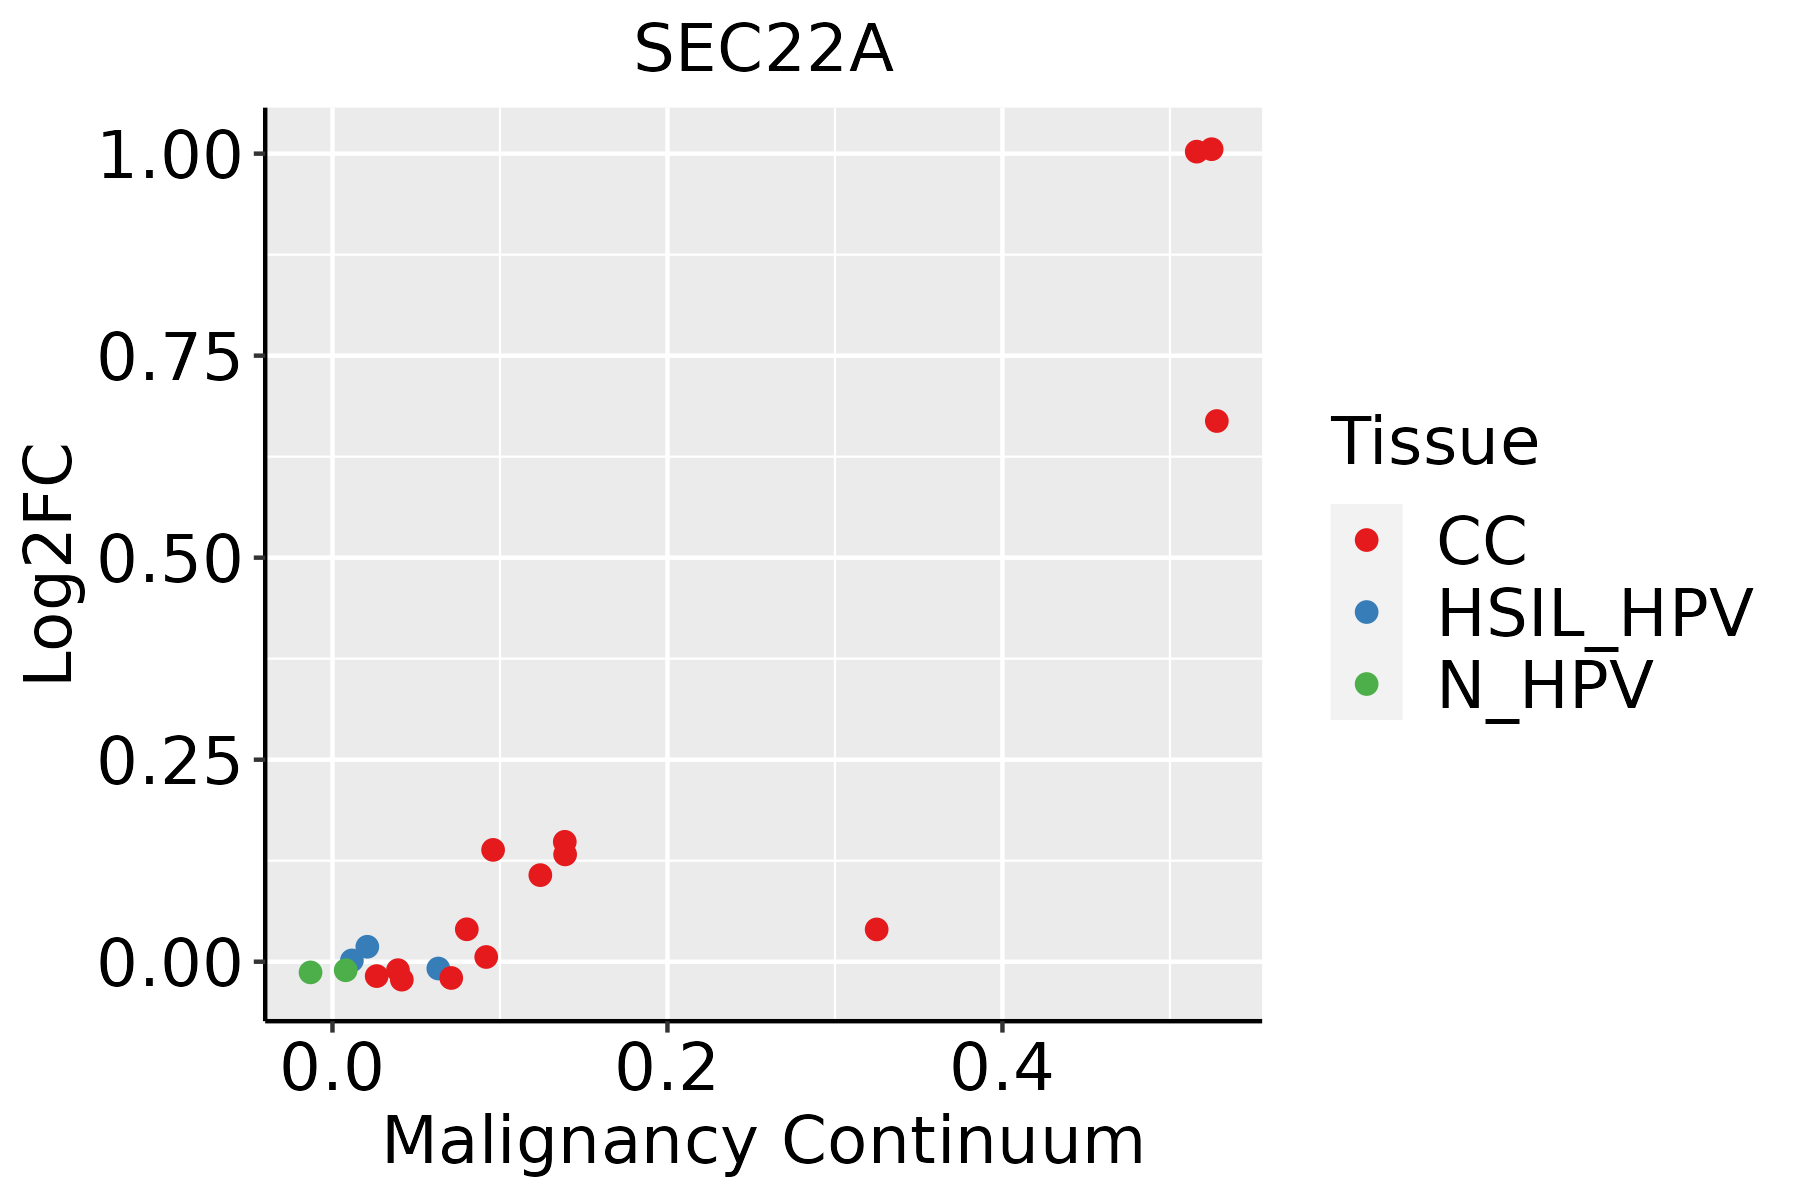 | CC: Cervix cancer |
| HSIL_HPV: HPV-infected high-grade squamous intraepithelial lesions | ||
| N_HPV: HPV-infected normal cervix | ||
| Esophagus |  | ESCC: Esophageal squamous cell carcinoma |
| HGIN: High-grade intraepithelial neoplasias | ||
| LGIN: Low-grade intraepithelial neoplasias | ||
| Oral Cavity | 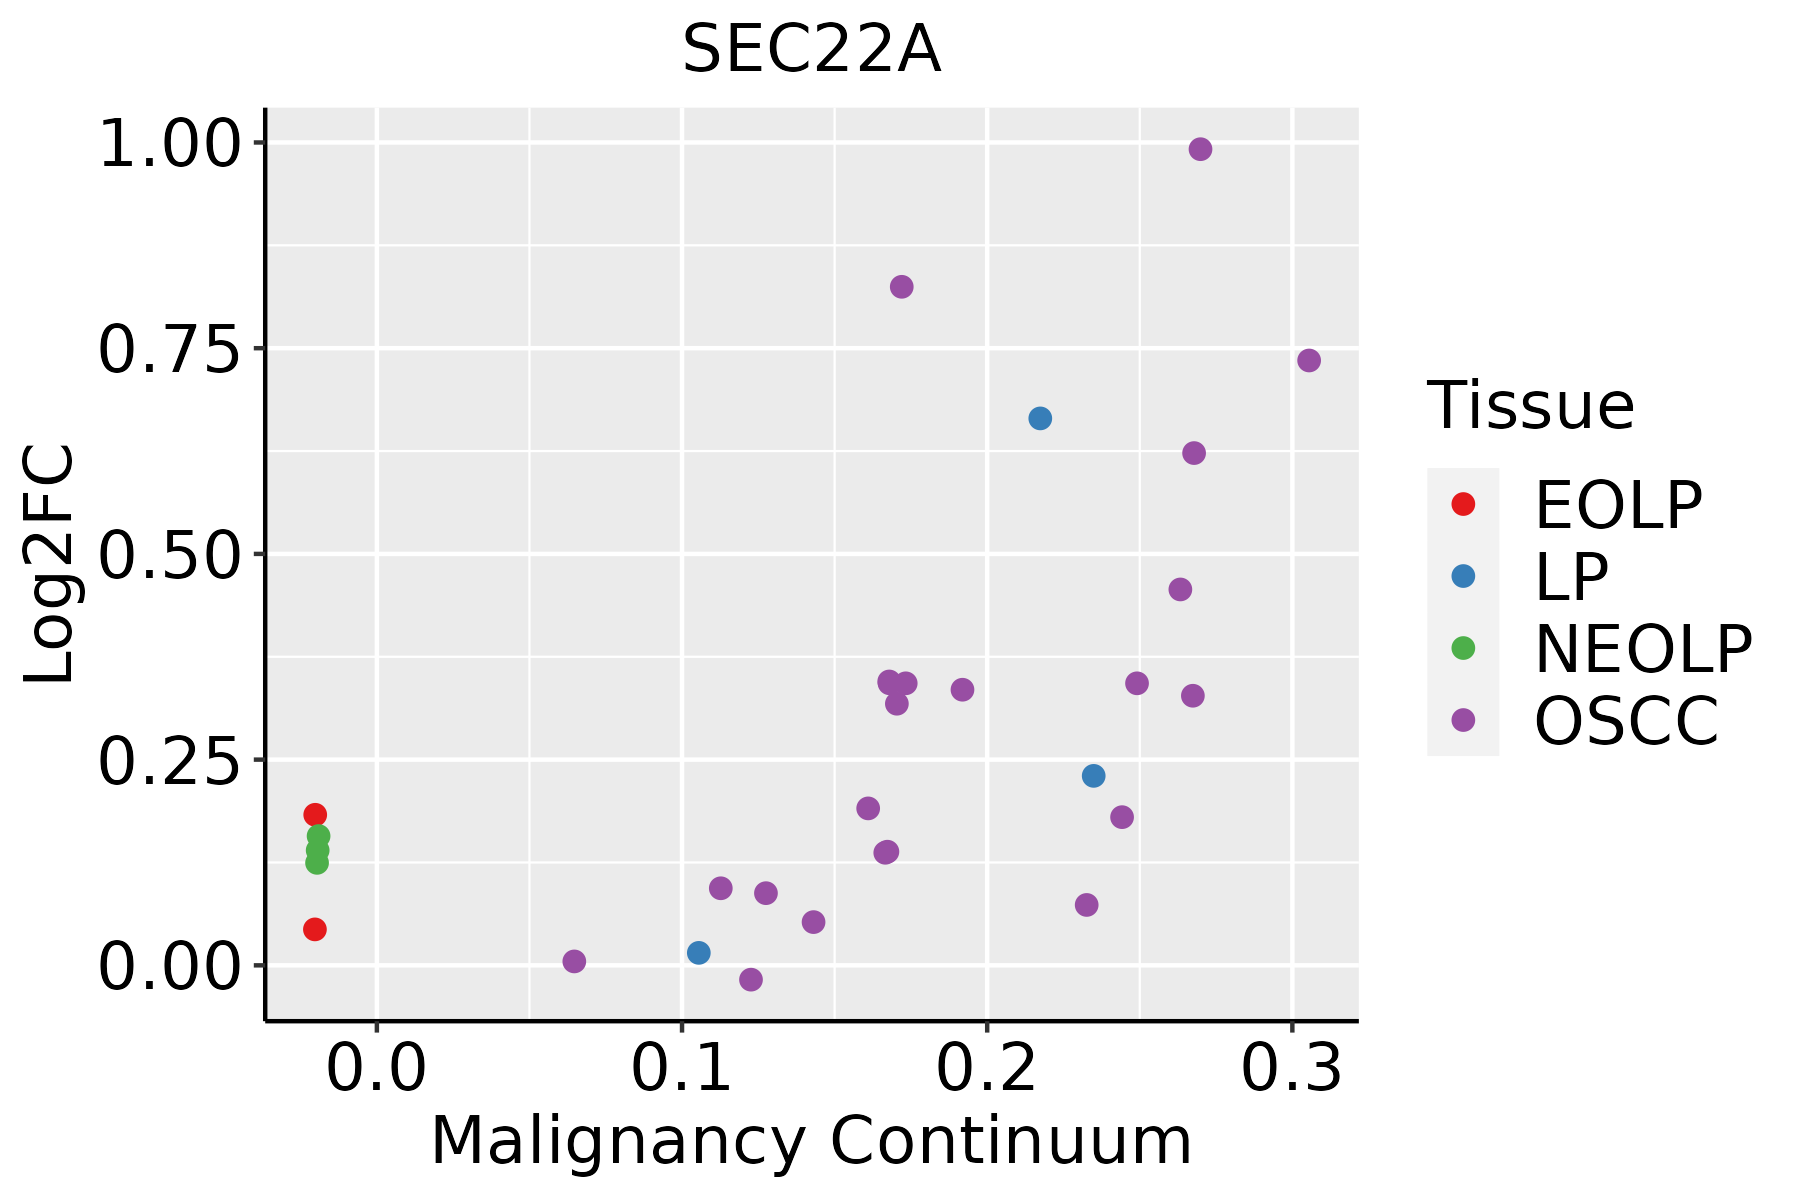 | EOLP: Erosive Oral lichen planus |
| LP: leukoplakia | ||
| NEOLP: Non-erosive oral lichen planus | ||
| OSCC: Oral squamous cell carcinoma |
| ∗log2FC in expression of this searched gene in stem-like cells from each diseased tissue sample relative to stem-like cells in normal samples in each tissue plotted against the malignancy continuum. Samples are colored based on if they are from different disease stage. |
Top |
Malignant transformation related pathway analysis |
| Find out the enriched GO biological processes and KEGG pathways involved in transition from healthy to precancer to cancer |
| Tissue | Disease Stage | Enriched GO biological Processes |
| Colorectum | AD |  |
| Colorectum | SER |  |
| Colorectum | MSS |  |
| Colorectum | MSI-H |  |
| Colorectum | FAP |  |
| ∗Top 15 enriched GO BP terms are showed in the bar plot of each disease state in each tissue. Each row represents a significant GO biological process which is colored according to the -log10(p.adjust). |
| Page: 1 2 3 4 5 6 7 8 9 |
| GO ID | Tissue | Disease Stage | Description | Gene Ratio | Bg Ratio | pvalue | p.adjust | Count |
| GO:00481938 | Cervix | CC | Golgi vesicle transport | 58/2311 | 296/18723 | 2.24e-04 | 2.54e-03 | 58 |
| GO:004819318 | Esophagus | ESCC | Golgi vesicle transport | 231/8552 | 296/18723 | 1.82e-30 | 9.63e-28 | 231 |
| GO:000688815 | Esophagus | ESCC | endoplasmic reticulum to Golgi vesicle-mediated transport | 102/8552 | 130/18723 | 1.73e-14 | 9.22e-13 | 102 |
| GO:004819315 | Oral cavity | OSCC | Golgi vesicle transport | 209/7305 | 296/18723 | 1.39e-28 | 6.30e-26 | 209 |
| GO:00068888 | Oral cavity | OSCC | endoplasmic reticulum to Golgi vesicle-mediated transport | 97/7305 | 130/18723 | 1.42e-16 | 1.15e-14 | 97 |
| GO:004819322 | Oral cavity | EOLP | Golgi vesicle transport | 72/2218 | 296/18723 | 1.43e-09 | 9.55e-08 | 72 |
| GO:000688822 | Oral cavity | EOLP | endoplasmic reticulum to Golgi vesicle-mediated transport | 29/2218 | 130/18723 | 5.29e-04 | 4.56e-03 | 29 |
| Page: 1 |
| Pathway ID | Tissue | Disease Stage | Description | Gene Ratio | Bg Ratio | pvalue | p.adjust | qvalue | Count |
| Page: 1 |
Top |
Cell-cell communication analysis |
| Identification of potential cell-cell interactions between two cell types and their ligand-receptor pairs for different disease states |
| Ligand | Receptor | LRpair | Pathway | Tissue | Disease Stage |
| Page: 1 |
Top |
Single-cell gene regulatory network inference analysis |
| Find out the significant the regulons (TFs) and the target genes of each regulon across cell types for different disease states |
| TF | Cell Type | Tissue | Disease Stage | Target Gene | RSS | Regulon Activity |
| ∗The dot plots of a searched regulon are shown for all cell subpopulations in each disease state of each tissue based on the regulon specific score inferred using pySCENIC and by calculating the average expression. |
| Page: 1 |
Top |
Somatic mutation of malignant transformation related genes |
| Annotation of somatic variants for genes involved in malignant transformation |
| Hugo Symbol | Variant Class | Variant Classification | dbSNP RS | HGVSc | HGVSp | HGVSp Short | SWISSPROT | BIOTYPE | SIFT | PolyPhen | Tumor Sample Barcode | Tissue | Histology | Sex | Age | Stage | Therapy Types | Drugs | Outcome |
| SEC22A | SNV | Missense_Mutation | novel | c.56N>T | p.Ser19Phe | p.S19F | Q96IW7 | protein_coding | deleterious(0) | probably_damaging(0.986) | TCGA-PE-A5DE-01 | Breast | breast invasive carcinoma | Female | <65 | I/II | Chemotherapy | taxotere | CR |
| SEC22A | deletion | Frame_Shift_Del | novel | c.432_435delNNNN | p.Ile145SerfsTer2 | p.I145Sfs*2 | Q96IW7 | protein_coding | TCGA-LL-A5YO-01 | Breast | breast invasive carcinoma | Female | <65 | I/II | Chemotherapy | taxotere | CR | ||
| SEC22A | SNV | Missense_Mutation | c.122N>T | p.Ser41Leu | p.S41L | Q96IW7 | protein_coding | deleterious(0) | benign(0.318) | TCGA-AZ-4315-01 | Colorectum | colon adenocarcinoma | Male | <65 | I/II | Unknown | Unknown | SD | |
| SEC22A | SNV | Missense_Mutation | novel | c.469N>A | p.Glu157Lys | p.E157K | Q96IW7 | protein_coding | deleterious(0) | benign(0.15) | TCGA-CA-6717-01 | Colorectum | colon adenocarcinoma | Male | <65 | I/II | Chemotherapy | oxaliplatin | CR |
| SEC22A | SNV | Missense_Mutation | c.697C>A | p.Leu233Ile | p.L233I | Q96IW7 | protein_coding | tolerated(0.57) | probably_damaging(0.987) | TCGA-D5-6928-01 | Colorectum | colon adenocarcinoma | Male | >=65 | I/II | Unknown | Unknown | SD | |
| SEC22A | SNV | Missense_Mutation | novel | c.733N>A | p.Leu245Ile | p.L245I | Q96IW7 | protein_coding | deleterious(0.02) | benign(0.055) | TCGA-F5-6814-01 | Colorectum | rectum adenocarcinoma | Male | <65 | I/II | Unknown | Unknown | SD |
| SEC22A | SNV | Missense_Mutation | novel | c.161N>C | p.Lys54Thr | p.K54T | Q96IW7 | protein_coding | deleterious(0.05) | benign(0.409) | TCGA-AJ-A5DW-01 | Endometrium | uterine corpus endometrioid carcinoma | Female | <65 | I/II | Unknown | Unknown | SD |
| SEC22A | SNV | Missense_Mutation | c.389N>T | p.Arg130Met | p.R130M | Q96IW7 | protein_coding | tolerated(0.12) | probably_damaging(0.994) | TCGA-AP-A059-01 | Endometrium | uterine corpus endometrioid carcinoma | Female | >=65 | I/II | Unknown | Unknown | SD | |
| SEC22A | SNV | Missense_Mutation | novel | c.31N>T | p.Arg11Cys | p.R11C | Q96IW7 | protein_coding | deleterious(0) | probably_damaging(0.99) | TCGA-AX-A05Z-01 | Endometrium | uterine corpus endometrioid carcinoma | Female | <65 | III/IV | Chemotherapy | adriamycin | SD |
| SEC22A | SNV | Missense_Mutation | novel | c.628N>T | p.Gly210Cys | p.G210C | Q96IW7 | protein_coding | deleterious(0) | probably_damaging(0.97) | TCGA-AX-A1CE-01 | Endometrium | uterine corpus endometrioid carcinoma | Female | <65 | I/II | Unspecific | Paclitaxel | SD |
| Page: 1 2 3 4 |
Top |
Related drugs of malignant transformation related genes |
| Identification of chemicals and drugs interact with genes involved in malignant transfromation |
| (DGIdb 4.0) |
| Entrez ID | Symbol | Category | Interaction Types | Drug Claim Name | Drug Name | PMIDs |
| Page: 1 |

Copyright 2023-Present -The University of Texas Health Science Center at Houston |