
|
|||||
|
 | |
| |
| |
| |
| |
| |
|
Gene: SEC16A |
Gene summary for SEC16A |
| Gene information | Species | Human | Gene symbol | SEC16A | Gene ID | 9919 |
| Gene name | SEC16 homolog A, endoplasmic reticulum export factor | |
| Gene Alias | KIAA0310 | |
| Cytomap | 9q34.3 | |
| Gene Type | protein-coding | GO ID | GO:0006810 | UniProtAcc | F1T0I1 |
Top |
Malignant transformation analysis |
| Identification of the aberrant gene expression in precancerous and cancerous lesions by comparing the gene expression of stem-like cells in diseased tissues with normal stem cells |
| Entrez ID | Symbol | Replicates | Species | Organ | Tissue | Adj P-value | Log2FC | Malignancy |
| 9919 | SEC16A | LZE4T | Human | Esophagus | ESCC | 6.04e-05 | 9.97e-02 | 0.0811 |
| 9919 | SEC16A | LZE7T | Human | Esophagus | ESCC | 5.51e-13 | 3.64e-01 | 0.0667 |
| 9919 | SEC16A | LZE8T | Human | Esophagus | ESCC | 9.82e-03 | 5.42e-02 | 0.067 |
| 9919 | SEC16A | LZE24T | Human | Esophagus | ESCC | 6.47e-06 | 2.17e-01 | 0.0596 |
| 9919 | SEC16A | LZE21T | Human | Esophagus | ESCC | 2.70e-02 | 1.87e-01 | 0.0655 |
| 9919 | SEC16A | P1T-E | Human | Esophagus | ESCC | 2.17e-05 | 4.13e-01 | 0.0875 |
| 9919 | SEC16A | P2T-E | Human | Esophagus | ESCC | 1.96e-17 | 2.46e-01 | 0.1177 |
| 9919 | SEC16A | P4T-E | Human | Esophagus | ESCC | 8.24e-04 | 9.66e-02 | 0.1323 |
| 9919 | SEC16A | P5T-E | Human | Esophagus | ESCC | 2.57e-06 | -5.97e-03 | 0.1327 |
| 9919 | SEC16A | P8T-E | Human | Esophagus | ESCC | 3.38e-25 | 5.36e-01 | 0.0889 |
| 9919 | SEC16A | P9T-E | Human | Esophagus | ESCC | 1.16e-10 | 1.08e-01 | 0.1131 |
| 9919 | SEC16A | P10T-E | Human | Esophagus | ESCC | 1.18e-08 | 1.36e-01 | 0.116 |
| 9919 | SEC16A | P11T-E | Human | Esophagus | ESCC | 1.07e-07 | 4.02e-01 | 0.1426 |
| 9919 | SEC16A | P12T-E | Human | Esophagus | ESCC | 8.44e-12 | 7.50e-02 | 0.1122 |
| 9919 | SEC16A | P15T-E | Human | Esophagus | ESCC | 8.39e-09 | 1.97e-01 | 0.1149 |
| 9919 | SEC16A | P16T-E | Human | Esophagus | ESCC | 2.69e-15 | 4.62e-02 | 0.1153 |
| 9919 | SEC16A | P17T-E | Human | Esophagus | ESCC | 1.23e-03 | 7.74e-02 | 0.1278 |
| 9919 | SEC16A | P19T-E | Human | Esophagus | ESCC | 3.59e-03 | 1.70e-01 | 0.1662 |
| 9919 | SEC16A | P20T-E | Human | Esophagus | ESCC | 1.13e-04 | 3.35e-02 | 0.1124 |
| 9919 | SEC16A | P21T-E | Human | Esophagus | ESCC | 9.88e-19 | 3.10e-01 | 0.1617 |
| Page: 1 2 3 4 5 |
| Tissue | Expression Dynamics | Abbreviation |
| Esophagus |  | ESCC: Esophageal squamous cell carcinoma |
| HGIN: High-grade intraepithelial neoplasias | ||
| LGIN: Low-grade intraepithelial neoplasias | ||
| Liver | 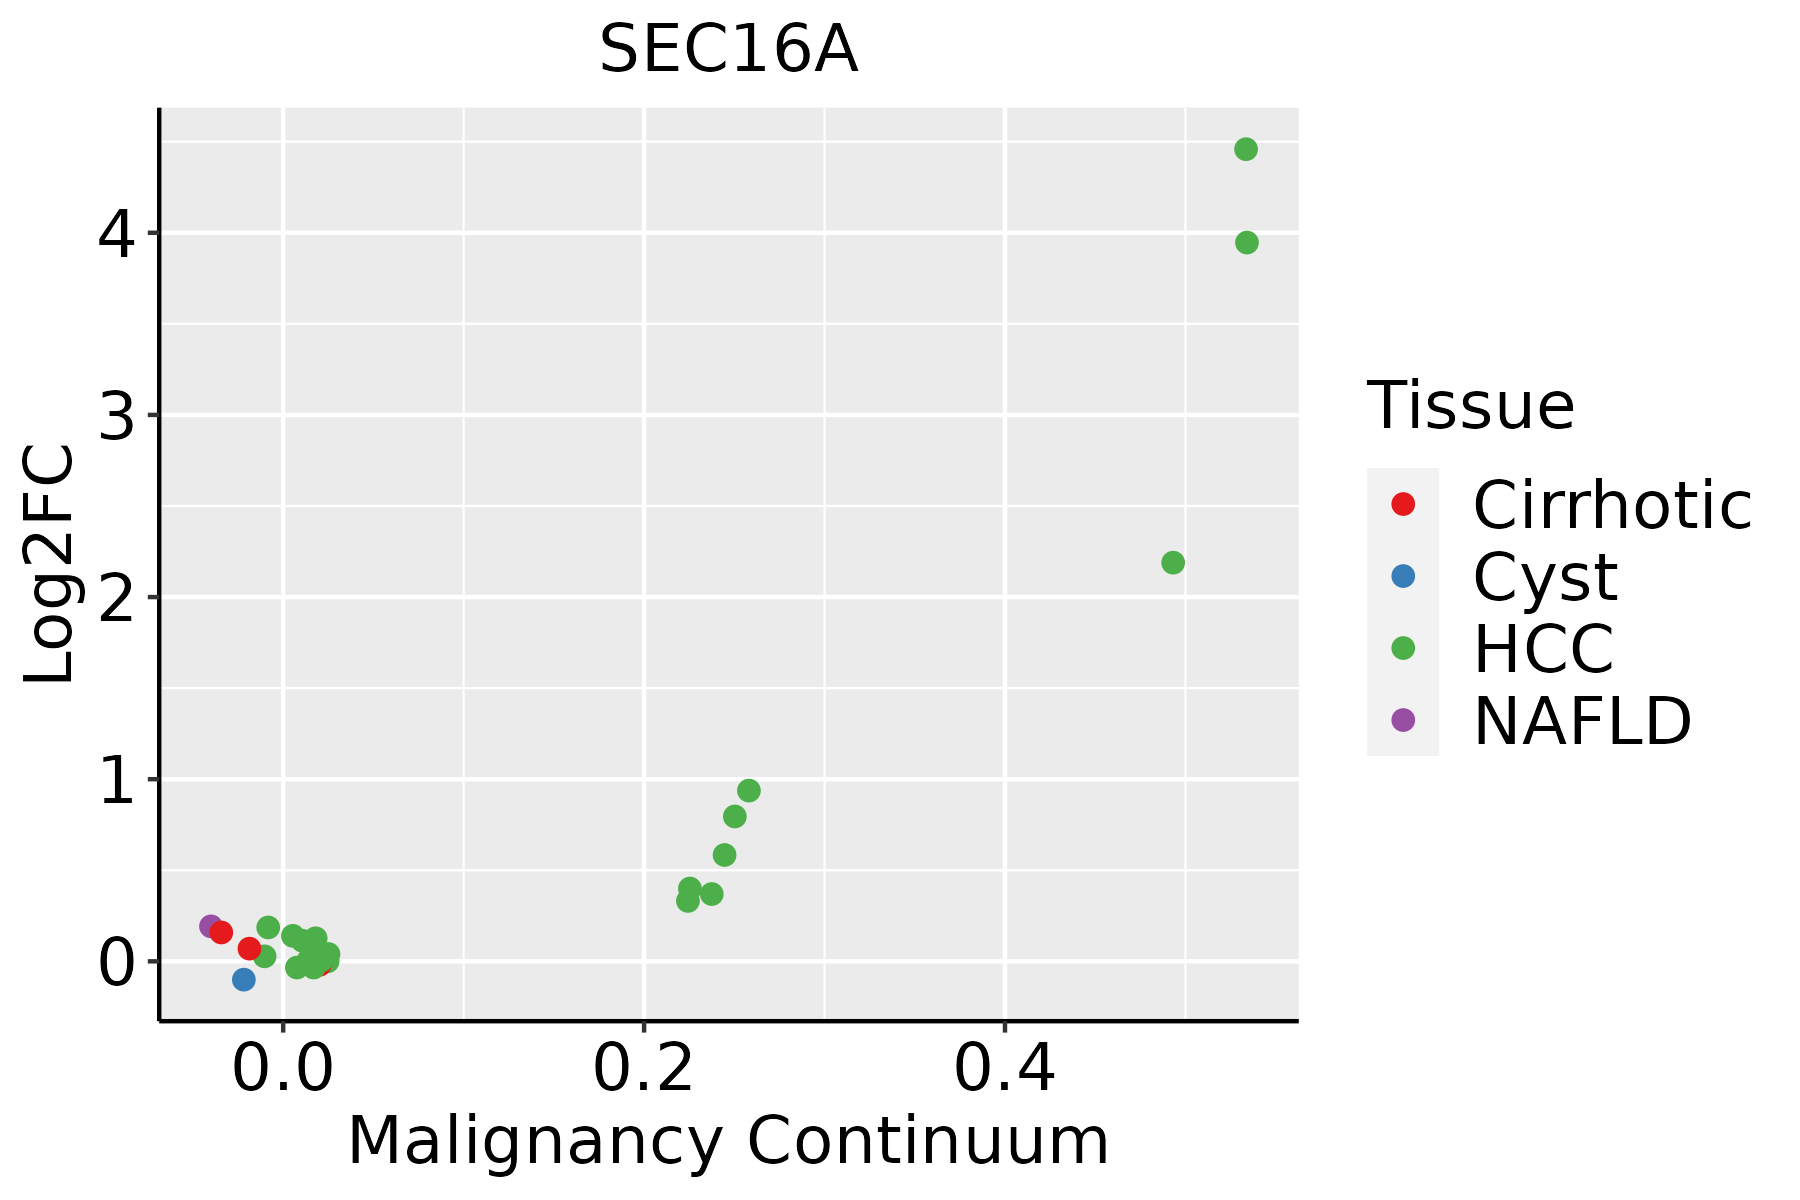 | HCC: Hepatocellular carcinoma |
| NAFLD: Non-alcoholic fatty liver disease | ||
| Oral Cavity |  | EOLP: Erosive Oral lichen planus |
| LP: leukoplakia | ||
| NEOLP: Non-erosive oral lichen planus | ||
| OSCC: Oral squamous cell carcinoma | ||
| Thyroid | 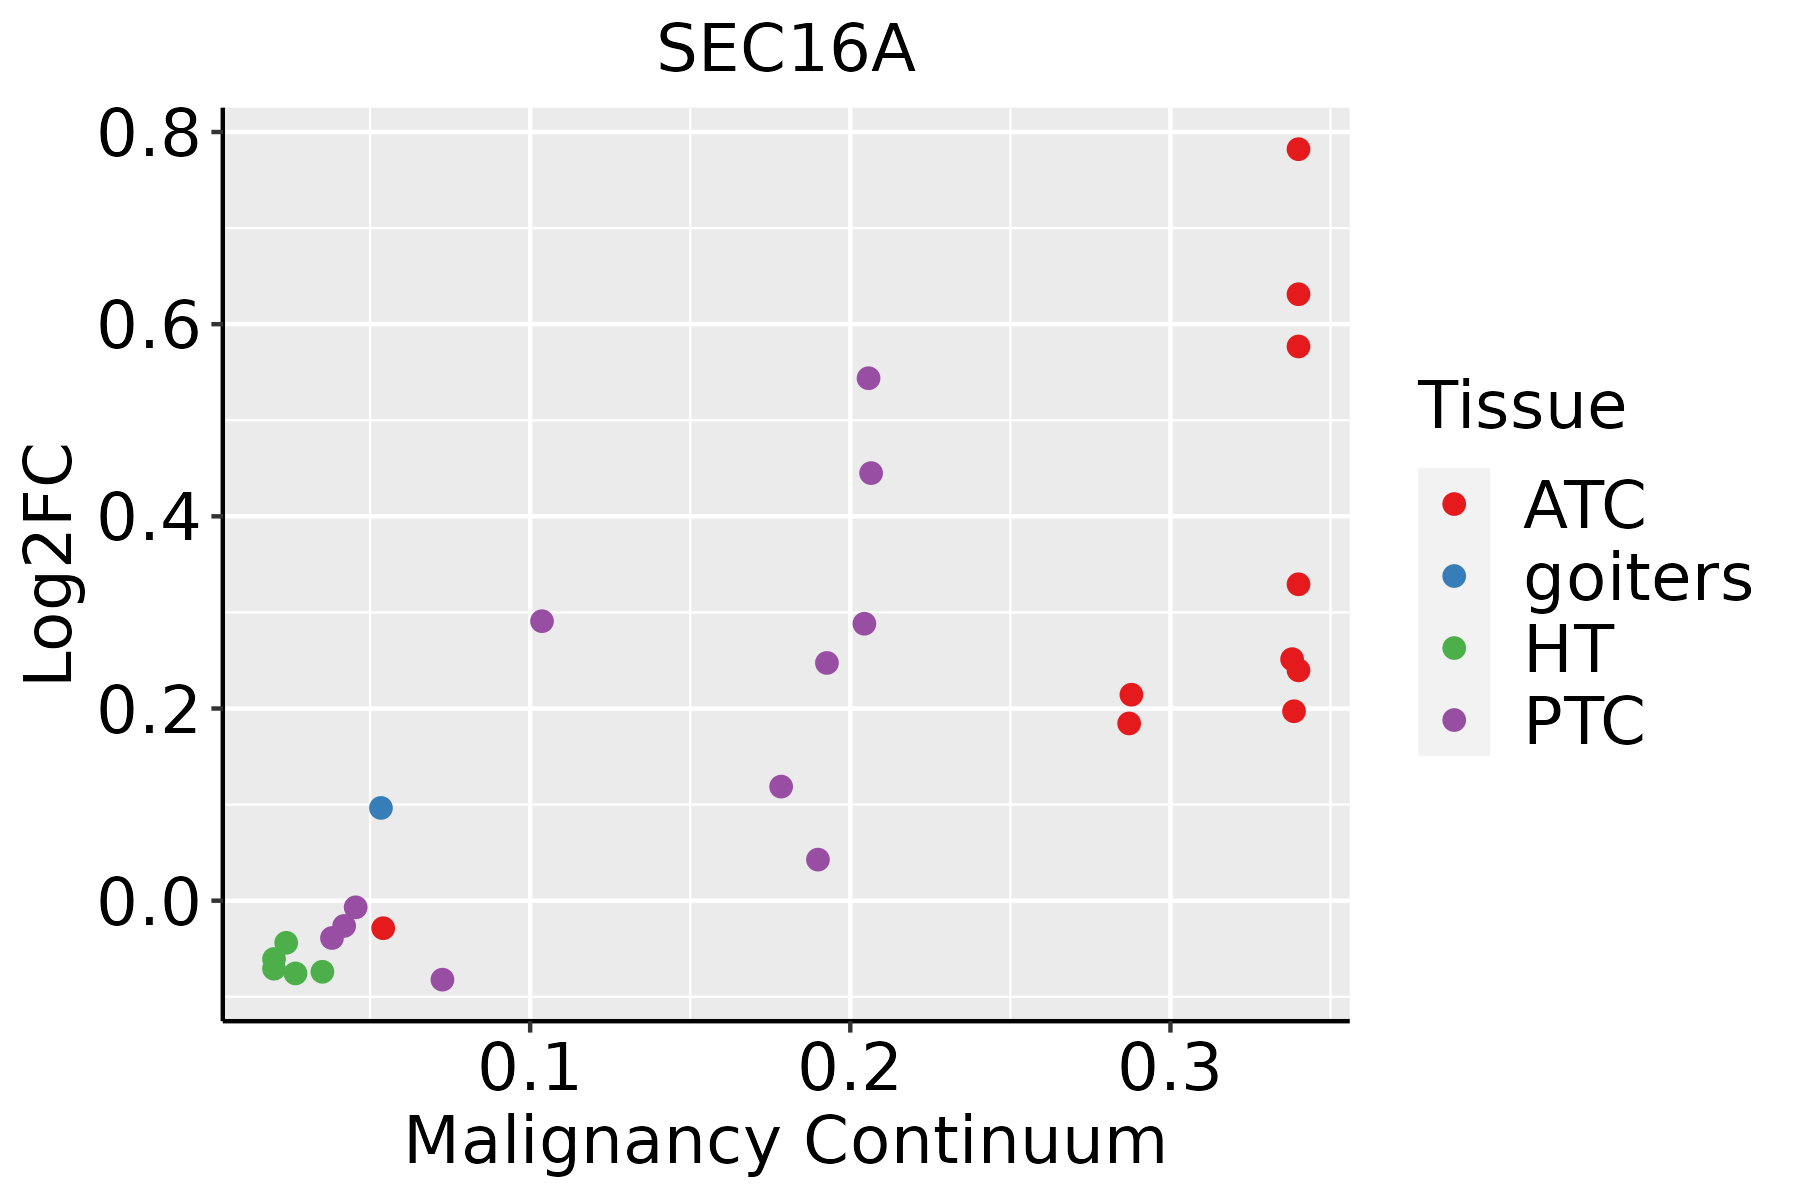 | ATC: Anaplastic thyroid cancer |
| HT: Hashimoto's thyroiditis | ||
| PTC: Papillary thyroid cancer |
| ∗log2FC in expression of this searched gene in stem-like cells from each diseased tissue sample relative to stem-like cells in normal samples in each tissue plotted against the malignancy continuum. Samples are colored based on if they are from different disease stage. |
Top |
Malignant transformation related pathway analysis |
| Find out the enriched GO biological processes and KEGG pathways involved in transition from healthy to precancer to cancer |
| Tissue | Disease Stage | Enriched GO biological Processes |
| Colorectum | AD |  |
| Colorectum | SER |  |
| Colorectum | MSS |  |
| Colorectum | MSI-H |  |
| Colorectum | FAP |  |
| ∗Top 15 enriched GO BP terms are showed in the bar plot of each disease state in each tissue. Each row represents a significant GO biological process which is colored according to the -log10(p.adjust). |
| Page: 1 2 3 4 5 6 7 8 9 |
| GO ID | Tissue | Disease Stage | Description | Gene Ratio | Bg Ratio | pvalue | p.adjust | Count |
| GO:004819318 | Esophagus | ESCC | Golgi vesicle transport | 231/8552 | 296/18723 | 1.82e-30 | 9.63e-28 | 231 |
| GO:0031647111 | Esophagus | ESCC | regulation of protein stability | 223/8552 | 298/18723 | 5.76e-25 | 1.52e-22 | 223 |
| GO:0034976111 | Esophagus | ESCC | response to endoplasmic reticulum stress | 192/8552 | 256/18723 | 7.15e-22 | 1.30e-19 | 192 |
| GO:0090150110 | Esophagus | ESCC | establishment of protein localization to membrane | 182/8552 | 260/18723 | 1.27e-15 | 8.19e-14 | 182 |
| GO:0050821111 | Esophagus | ESCC | protein stabilization | 140/8552 | 191/18723 | 6.50e-15 | 3.61e-13 | 140 |
| GO:000688815 | Esophagus | ESCC | endoplasmic reticulum to Golgi vesicle-mediated transport | 102/8552 | 130/18723 | 1.73e-14 | 9.22e-13 | 102 |
| GO:0072659110 | Esophagus | ESCC | protein localization to plasma membrane | 193/8552 | 284/18723 | 1.95e-14 | 1.03e-12 | 193 |
| GO:199077819 | Esophagus | ESCC | protein localization to cell periphery | 217/8552 | 333/18723 | 4.08e-13 | 1.88e-11 | 217 |
| GO:000689215 | Esophagus | ESCC | post-Golgi vesicle-mediated transport | 82/8552 | 104/18723 | 4.00e-12 | 1.55e-10 | 82 |
| GO:009887615 | Esophagus | ESCC | vesicle-mediated transport to the plasma membrane | 99/8552 | 136/18723 | 1.13e-10 | 3.39e-09 | 99 |
| GO:000702914 | Esophagus | ESCC | endoplasmic reticulum organization | 65/8552 | 87/18723 | 3.28e-08 | 6.08e-07 | 65 |
| GO:000689315 | Esophagus | ESCC | Golgi to plasma membrane transport | 48/8552 | 60/18723 | 5.11e-08 | 9.16e-07 | 48 |
| GO:004300114 | Esophagus | ESCC | Golgi to plasma membrane protein transport | 34/8552 | 40/18723 | 3.00e-07 | 4.27e-06 | 34 |
| GO:00070308 | Esophagus | ESCC | Golgi organization | 101/8552 | 157/18723 | 1.78e-06 | 2.10e-05 | 101 |
| GO:0021762111 | Esophagus | ESCC | substantia nigra development | 35/8552 | 44/18723 | 4.40e-06 | 4.69e-05 | 35 |
| GO:003252714 | Esophagus | ESCC | protein exit from endoplasmic reticulum | 37/8552 | 48/18723 | 8.99e-06 | 8.65e-05 | 37 |
| GO:006195114 | Esophagus | ESCC | establishment of protein localization to plasma membrane | 44/8552 | 60/18723 | 1.25e-05 | 1.15e-04 | 44 |
| GO:007097218 | Esophagus | ESCC | protein localization to endoplasmic reticulum | 52/8552 | 74/18723 | 1.58e-05 | 1.42e-04 | 52 |
| GO:004885718 | Esophagus | ESCC | neural nucleus development | 44/8552 | 64/18723 | 1.59e-04 | 1.05e-03 | 44 |
| GO:003090118 | Esophagus | ESCC | midbrain development | 58/8552 | 90/18723 | 2.52e-04 | 1.55e-03 | 58 |
| Page: 1 2 3 4 5 6 7 |
| Pathway ID | Tissue | Disease Stage | Description | Gene Ratio | Bg Ratio | pvalue | p.adjust | qvalue | Count |
| Page: 1 |
Top |
Cell-cell communication analysis |
| Identification of potential cell-cell interactions between two cell types and their ligand-receptor pairs for different disease states |
| Ligand | Receptor | LRpair | Pathway | Tissue | Disease Stage |
| Page: 1 |
Top |
Single-cell gene regulatory network inference analysis |
| Find out the significant the regulons (TFs) and the target genes of each regulon across cell types for different disease states |
| TF | Cell Type | Tissue | Disease Stage | Target Gene | RSS | Regulon Activity |
| ∗The dot plots of a searched regulon are shown for all cell subpopulations in each disease state of each tissue based on the regulon specific score inferred using pySCENIC and by calculating the average expression. |
| Page: 1 |
Top |
Somatic mutation of malignant transformation related genes |
| Annotation of somatic variants for genes involved in malignant transformation |
| Hugo Symbol | Variant Class | Variant Classification | dbSNP RS | HGVSc | HGVSp | HGVSp Short | SWISSPROT | BIOTYPE | SIFT | PolyPhen | Tumor Sample Barcode | Tissue | Histology | Sex | Age | Stage | Therapy Types | Drugs | Outcome |
| SEC16A | SNV | Missense_Mutation | c.2834G>A | p.Arg945His | p.R945H | protein_coding | tolerated(0.16) | benign(0) | TCGA-B6-A1KC-01 | Breast | breast invasive carcinoma | Female | >=65 | I/II | Unknown | Unknown | SD | ||
| SEC16A | SNV | Missense_Mutation | novel | c.4678N>A | p.Leu1560Met | p.L1560M | protein_coding | deleterious(0) | probably_damaging(1) | TCGA-BH-A0DK-01 | Breast | breast invasive carcinoma | Female | <65 | I/II | Hormone Therapy | tamoxiphen | SD | |
| SEC16A | SNV | Missense_Mutation | c.5596N>T | p.Pro1866Ser | p.P1866S | protein_coding | deleterious(0.05) | probably_damaging(1) | TCGA-BH-A0HF-01 | Breast | breast invasive carcinoma | Female | >=65 | I/II | Hormone Therapy | arimidex | SD | ||
| SEC16A | SNV | Missense_Mutation | c.4789G>A | p.Glu1597Lys | p.E1597K | protein_coding | deleterious(0.03) | probably_damaging(0.999) | TCGA-BH-A1F8-01 | Breast | breast invasive carcinoma | Female | >=65 | III/IV | Unknown | Unknown | PD | ||
| SEC16A | SNV | Missense_Mutation | c.3112N>C | p.Asp1038His | p.D1038H | protein_coding | deleterious(0.02) | probably_damaging(0.94) | TCGA-BH-A1FM-01 | Breast | breast invasive carcinoma | Female | <65 | III/IV | Unknown | Unknown | SD | ||
| SEC16A | SNV | Missense_Mutation | c.2803N>C | p.Glu935Gln | p.E935Q | protein_coding | tolerated(0.58) | benign(0.003) | TCGA-BH-A1FM-01 | Breast | breast invasive carcinoma | Female | <65 | III/IV | Unknown | Unknown | SD | ||
| SEC16A | SNV | Missense_Mutation | c.2632N>A | p.Asp878Asn | p.D878N | protein_coding | tolerated(0.22) | probably_damaging(0.999) | TCGA-BH-A1FM-01 | Breast | breast invasive carcinoma | Female | <65 | III/IV | Unknown | Unknown | SD | ||
| SEC16A | SNV | Missense_Mutation | rs772867748 | c.5510N>T | p.Pro1837Leu | p.P1837L | protein_coding | deleterious(0) | probably_damaging(1) | TCGA-D8-A1X6-01 | Breast | breast invasive carcinoma | Female | >=65 | III/IV | Hormone Therapy | tamoxiphen | SD | |
| SEC16A | SNV | Missense_Mutation | c.6619C>T | p.Pro2207Ser | p.P2207S | protein_coding | tolerated(0.14) | possibly_damaging(0.767) | TCGA-EW-A1P4-01 | Breast | breast invasive carcinoma | Female | <65 | I/II | Chemotherapy | docetaxel | SD | ||
| SEC16A | SNV | Missense_Mutation | novel | c.5108N>A | p.Pro1703Gln | p.P1703Q | protein_coding | deleterious(0) | probably_damaging(1) | TCGA-LL-A73Y-01 | Breast | breast invasive carcinoma | Female | >=65 | I/II | Chemotherapy | taxotere | SD |
| Page: 1 2 3 4 5 6 7 8 9 10 11 12 13 14 15 16 17 18 19 20 |
Top |
Related drugs of malignant transformation related genes |
| Identification of chemicals and drugs interact with genes involved in malignant transfromation |
| (DGIdb 4.0) |
| Entrez ID | Symbol | Category | Interaction Types | Drug Claim Name | Drug Name | PMIDs |
| Page: 1 |

Copyright 2023-Present -The University of Texas Health Science Center at Houston |