
|
|||||
|
 | |
| |
| |
| |
| |
| |
|
Gene: SEC14L2 |
Gene summary for SEC14L2 |
| Gene information | Species | Human | Gene symbol | SEC14L2 | Gene ID | 23541 |
| Gene name | SEC14 like lipid binding 2 | |
| Gene Alias | C22orf6 | |
| Cytomap | 22q12.2 | |
| Gene Type | protein-coding | GO ID | GO:0006066 | UniProtAcc | O76054 |
Top |
Malignant transformation analysis |
| Identification of the aberrant gene expression in precancerous and cancerous lesions by comparing the gene expression of stem-like cells in diseased tissues with normal stem cells |
| Entrez ID | Symbol | Replicates | Species | Organ | Tissue | Adj P-value | Log2FC | Malignancy |
| 23541 | SEC14L2 | GSM4909282 | Human | Breast | IDC | 1.40e-03 | -1.03e-01 | -0.0288 |
| 23541 | SEC14L2 | GSM4909290 | Human | Breast | IDC | 2.64e-02 | -1.25e-01 | 0.2096 |
| 23541 | SEC14L2 | GSM4909293 | Human | Breast | IDC | 1.34e-02 | 1.32e-01 | 0.1581 |
| 23541 | SEC14L2 | GSM4909294 | Human | Breast | IDC | 2.56e-03 | -1.01e-01 | 0.2022 |
| 23541 | SEC14L2 | GSM4909306 | Human | Breast | IDC | 5.14e-03 | 2.84e-01 | 0.1564 |
| 23541 | SEC14L2 | GSM4909311 | Human | Breast | IDC | 6.80e-03 | -7.20e-02 | 0.1534 |
| 23541 | SEC14L2 | GSM4909315 | Human | Breast | IDC | 1.97e-02 | -1.18e-01 | 0.21 |
| 23541 | SEC14L2 | GSM4909319 | Human | Breast | IDC | 1.53e-07 | -3.68e-02 | 0.1563 |
| 23541 | SEC14L2 | GSM4909321 | Human | Breast | IDC | 5.08e-03 | -1.17e-01 | 0.1559 |
| 23541 | SEC14L2 | M5 | Human | Breast | IDC | 1.91e-03 | 5.60e-01 | 0.1598 |
| 23541 | SEC14L2 | DCIS2 | Human | Breast | DCIS | 2.05e-21 | 8.62e-02 | 0.0085 |
| 23541 | SEC14L2 | LZE24T | Human | Esophagus | ESCC | 2.23e-02 | 5.71e-02 | 0.0596 |
| 23541 | SEC14L2 | P2T-E | Human | Esophagus | ESCC | 5.82e-04 | 8.87e-02 | 0.1177 |
| 23541 | SEC14L2 | P5T-E | Human | Esophagus | ESCC | 3.02e-05 | 1.09e-01 | 0.1327 |
| 23541 | SEC14L2 | P10T-E | Human | Esophagus | ESCC | 1.94e-03 | 2.26e-02 | 0.116 |
| 23541 | SEC14L2 | P11T-E | Human | Esophagus | ESCC | 7.19e-04 | 2.24e-01 | 0.1426 |
| 23541 | SEC14L2 | P12T-E | Human | Esophagus | ESCC | 5.86e-10 | 1.22e-01 | 0.1122 |
| 23541 | SEC14L2 | P15T-E | Human | Esophagus | ESCC | 1.06e-05 | 1.36e-01 | 0.1149 |
| 23541 | SEC14L2 | P16T-E | Human | Esophagus | ESCC | 7.24e-09 | 8.05e-02 | 0.1153 |
| 23541 | SEC14L2 | P17T-E | Human | Esophagus | ESCC | 7.93e-06 | 3.31e-01 | 0.1278 |
| Page: 1 2 3 4 |
| Tissue | Expression Dynamics | Abbreviation |
| Breast |  | IDC: Invasive ductal carcinoma |
| DCIS: Ductal carcinoma in situ | ||
| Precancer(BRCA1-mut): Precancerous lesion from BRCA1 mutation carriers | ||
| Esophagus | 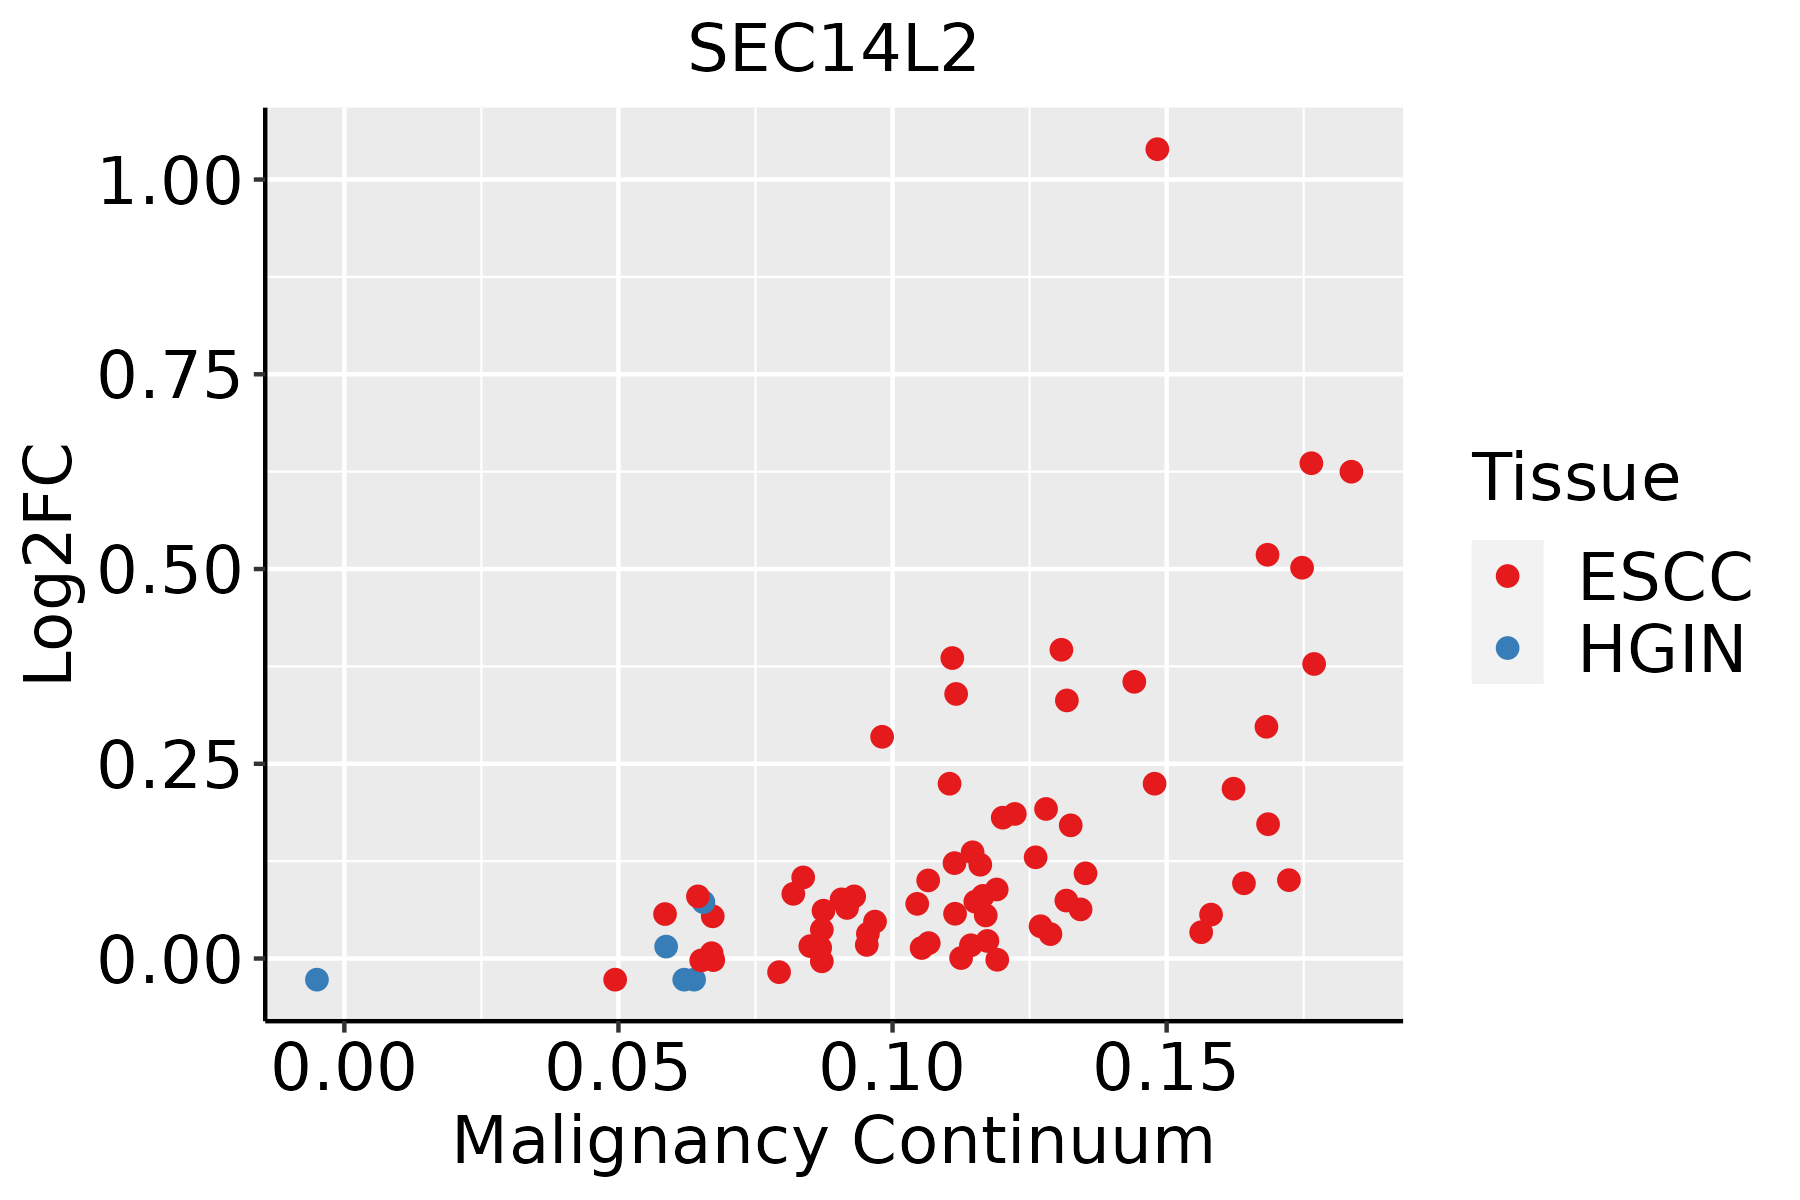 | ESCC: Esophageal squamous cell carcinoma |
| HGIN: High-grade intraepithelial neoplasias | ||
| LGIN: Low-grade intraepithelial neoplasias | ||
| Liver |  | HCC: Hepatocellular carcinoma |
| NAFLD: Non-alcoholic fatty liver disease | ||
| Oral Cavity | 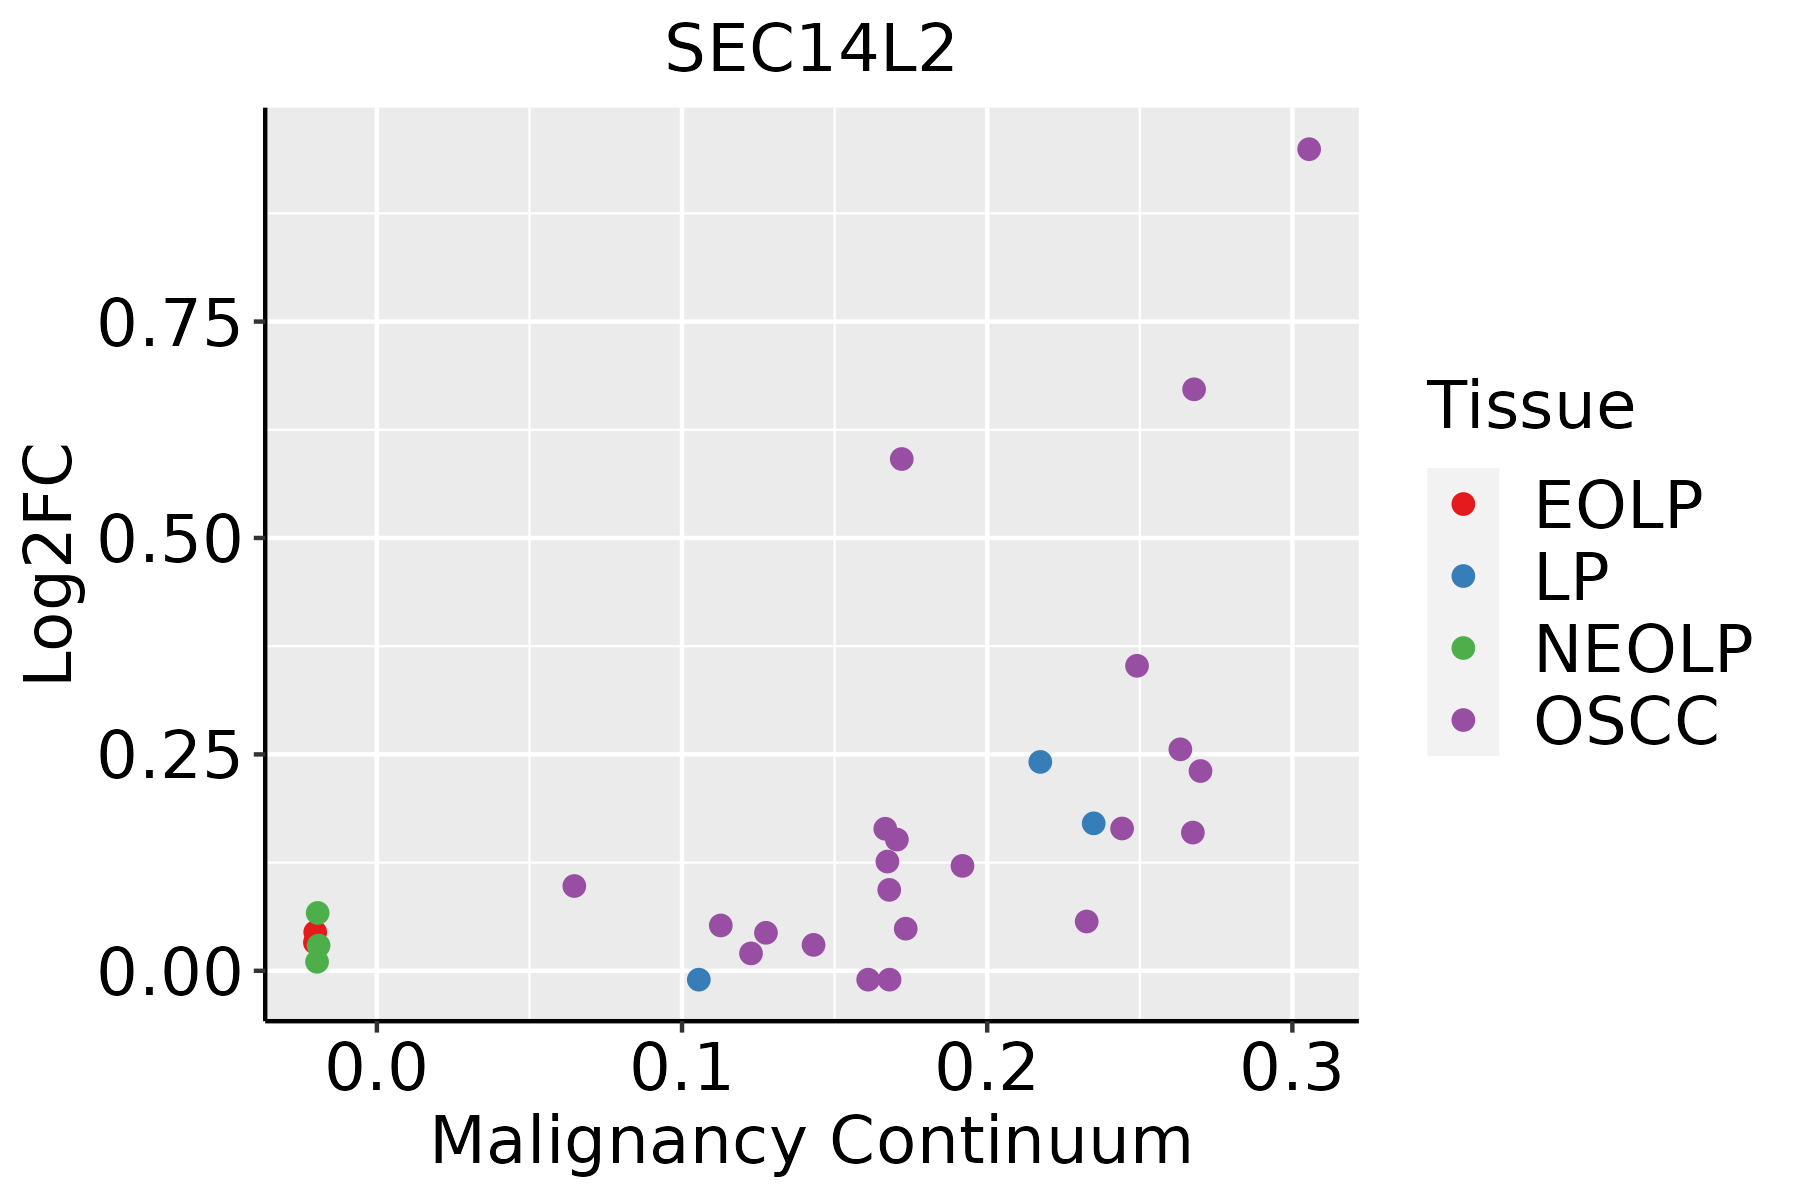 | EOLP: Erosive Oral lichen planus |
| LP: leukoplakia | ||
| NEOLP: Non-erosive oral lichen planus | ||
| OSCC: Oral squamous cell carcinoma |
| ∗log2FC in expression of this searched gene in stem-like cells from each diseased tissue sample relative to stem-like cells in normal samples in each tissue plotted against the malignancy continuum. Samples are colored based on if they are from different disease stage. |
Top |
Malignant transformation related pathway analysis |
| Find out the enriched GO biological processes and KEGG pathways involved in transition from healthy to precancer to cancer |
| Tissue | Disease Stage | Enriched GO biological Processes |
| Colorectum | AD |  |
| Colorectum | SER |  |
| Colorectum | MSS |  |
| Colorectum | MSI-H |  |
| Colorectum | FAP |  |
| ∗Top 15 enriched GO BP terms are showed in the bar plot of each disease state in each tissue. Each row represents a significant GO biological process which is colored according to the -log10(p.adjust). |
| Page: 1 2 3 4 5 6 7 8 9 |
| GO ID | Tissue | Disease Stage | Description | Gene Ratio | Bg Ratio | pvalue | p.adjust | Count |
| GO:001921612 | Breast | IDC | regulation of lipid metabolic process | 45/1434 | 331/18723 | 1.21e-04 | 2.24e-03 | 45 |
| GO:00192184 | Breast | IDC | regulation of steroid metabolic process | 18/1434 | 100/18723 | 5.40e-04 | 6.96e-03 | 18 |
| GO:00468904 | Breast | IDC | regulation of lipid biosynthetic process | 26/1434 | 171/18723 | 5.92e-04 | 7.50e-03 | 26 |
| GO:00508102 | Breast | IDC | regulation of steroid biosynthetic process | 14/1434 | 69/18723 | 6.37e-04 | 7.94e-03 | 14 |
| GO:00066944 | Breast | IDC | steroid biosynthetic process | 25/1434 | 173/18723 | 1.56e-03 | 1.56e-02 | 25 |
| GO:001921621 | Breast | DCIS | regulation of lipid metabolic process | 43/1390 | 331/18723 | 2.37e-04 | 3.71e-03 | 43 |
| GO:004689012 | Breast | DCIS | regulation of lipid biosynthetic process | 24/1390 | 171/18723 | 1.89e-03 | 1.81e-02 | 24 |
| GO:001921811 | Breast | DCIS | regulation of steroid metabolic process | 16/1390 | 100/18723 | 2.77e-03 | 2.42e-02 | 16 |
| GO:00508101 | Breast | DCIS | regulation of steroid biosynthetic process | 12/1390 | 69/18723 | 4.52e-03 | 3.47e-02 | 12 |
| GO:000669411 | Breast | DCIS | steroid biosynthetic process | 23/1390 | 173/18723 | 4.63e-03 | 3.52e-02 | 23 |
| GO:006201213 | Breast | DCIS | regulation of small molecule metabolic process | 38/1390 | 334/18723 | 5.69e-03 | 4.10e-02 | 38 |
| GO:00060668 | Esophagus | ESCC | alcohol metabolic process | 202/8552 | 353/18723 | 7.32e-06 | 7.26e-05 | 202 |
| GO:00161263 | Esophagus | ESCC | sterol biosynthetic process | 46/8552 | 64/18723 | 1.91e-05 | 1.67e-04 | 46 |
| GO:00066953 | Esophagus | ESCC | cholesterol biosynthetic process | 41/8552 | 57/18723 | 5.25e-05 | 4.06e-04 | 41 |
| GO:19026533 | Esophagus | ESCC | secondary alcohol biosynthetic process | 41/8552 | 57/18723 | 5.25e-05 | 4.06e-04 | 41 |
| GO:00620129 | Esophagus | ESCC | regulation of small molecule metabolic process | 184/8552 | 334/18723 | 3.11e-04 | 1.85e-03 | 184 |
| GO:19026524 | Esophagus | ESCC | secondary alcohol metabolic process | 87/8552 | 147/18723 | 6.58e-04 | 3.50e-03 | 87 |
| GO:00461653 | Esophagus | ESCC | alcohol biosynthetic process | 83/8552 | 140/18723 | 8.04e-04 | 4.16e-03 | 83 |
| GO:00066946 | Esophagus | ESCC | steroid biosynthetic process | 98/8552 | 173/18723 | 2.34e-03 | 1.03e-02 | 98 |
| GO:00082034 | Esophagus | ESCC | cholesterol metabolic process | 79/8552 | 137/18723 | 3.11e-03 | 1.29e-02 | 79 |
| Page: 1 2 3 |
| Pathway ID | Tissue | Disease Stage | Description | Gene Ratio | Bg Ratio | pvalue | p.adjust | qvalue | Count |
| Page: 1 |
Top |
Cell-cell communication analysis |
| Identification of potential cell-cell interactions between two cell types and their ligand-receptor pairs for different disease states |
| Ligand | Receptor | LRpair | Pathway | Tissue | Disease Stage |
| Page: 1 |
Top |
Single-cell gene regulatory network inference analysis |
| Find out the significant the regulons (TFs) and the target genes of each regulon across cell types for different disease states |
| TF | Cell Type | Tissue | Disease Stage | Target Gene | RSS | Regulon Activity |
| ∗The dot plots of a searched regulon are shown for all cell subpopulations in each disease state of each tissue based on the regulon specific score inferred using pySCENIC and by calculating the average expression. |
| Page: 1 |
Top |
Somatic mutation of malignant transformation related genes |
| Annotation of somatic variants for genes involved in malignant transformation |
| Hugo Symbol | Variant Class | Variant Classification | dbSNP RS | HGVSc | HGVSp | HGVSp Short | SWISSPROT | BIOTYPE | SIFT | PolyPhen | Tumor Sample Barcode | Tissue | Histology | Sex | Age | Stage | Therapy Types | Drugs | Outcome |
| SEC14L2 | SNV | Missense_Mutation | novel | c.745N>C | p.Asp249His | p.D249H | O76054 | protein_coding | deleterious(0) | possibly_damaging(0.471) | TCGA-D8-A27G-01 | Breast | breast invasive carcinoma | Female | >=65 | I/II | Unknown | Unknown | SD |
| SEC14L2 | SNV | Missense_Mutation | c.523N>T | p.Leu175Phe | p.L175F | O76054 | protein_coding | tolerated(0.57) | benign(0.047) | TCGA-C5-A7CO-01 | Cervix | cervical & endocervical cancer | Female | >=65 | I/II | Chemotherapy | cisplatin | SD | |
| SEC14L2 | SNV | Missense_Mutation | rs182488695 | c.857N>A | p.Arg286His | p.R286H | O76054 | protein_coding | deleterious(0.02) | benign(0.052) | TCGA-EA-A3HU-01 | Cervix | cervical & endocervical cancer | Female | <65 | I/II | Unknown | Unknown | SD |
| SEC14L2 | SNV | Missense_Mutation | c.910A>T | p.Arg304Trp | p.R304W | O76054 | protein_coding | deleterious(0) | probably_damaging(0.997) | TCGA-DM-A1D6-01 | Colorectum | colon adenocarcinoma | Male | >=65 | I/II | Unknown | Unknown | SD | |
| SEC14L2 | SNV | Missense_Mutation | novel | c.878A>G | p.Glu293Gly | p.E293G | O76054 | protein_coding | deleterious(0.01) | benign(0.388) | TCGA-DM-A28H-01 | Colorectum | colon adenocarcinoma | Male | <65 | III/IV | Unknown | Unknown | PD |
| SEC14L2 | deletion | Frame_Shift_Del | c.724delN | p.Gly243AlafsTer3 | p.G243Afs*3 | O76054 | protein_coding | TCGA-A6-3809-01 | Colorectum | colon adenocarcinoma | Female | >=65 | I/II | Unknown | Unknown | SD | |||
| SEC14L2 | SNV | Missense_Mutation | novel | c.381G>T | p.Glu127Asp | p.E127D | O76054 | protein_coding | tolerated(1) | benign(0) | TCGA-A5-A0G2-01 | Endometrium | uterine corpus endometrioid carcinoma | Female | <65 | III/IV | Unknown | Unknown | SD |
| SEC14L2 | SNV | Missense_Mutation | rs780928268 | c.1084G>A | p.Val362Ile | p.V362I | O76054 | protein_coding | deleterious(0.04) | benign(0.045) | TCGA-A5-A0G2-01 | Endometrium | uterine corpus endometrioid carcinoma | Female | <65 | III/IV | Unknown | Unknown | SD |
| SEC14L2 | SNV | Missense_Mutation | novel | c.602N>T | p.Ala201Val | p.A201V | O76054 | protein_coding | deleterious(0.03) | benign(0.157) | TCGA-A5-A1OF-01 | Endometrium | uterine corpus endometrioid carcinoma | Female | <65 | I/II | Unknown | Unknown | SD |
| SEC14L2 | SNV | Missense_Mutation | novel | c.364A>G | p.Arg122Gly | p.R122G | O76054 | protein_coding | tolerated(0.06) | benign(0.412) | TCGA-AP-A05O-01 | Endometrium | uterine corpus endometrioid carcinoma | Female | >=65 | I/II | Chemotherapy | carboplatin | PD |
| Page: 1 2 3 |
Top |
Related drugs of malignant transformation related genes |
| Identification of chemicals and drugs interact with genes involved in malignant transfromation |
| (DGIdb 4.0) |
| Entrez ID | Symbol | Category | Interaction Types | Drug Claim Name | Drug Name | PMIDs |
| Page: 1 |

Copyright 2023-Present -The University of Texas Health Science Center at Houston |