
|
|||||
|
 | |
| |
| |
| |
| |
| |
|
Gene: SEC13 |
Gene summary for SEC13 |
| Gene information | Species | Human | Gene symbol | SEC13 | Gene ID | 6396 |
| Gene name | SEC13 homolog, nuclear pore and COPII coat complex component | |
| Gene Alias | D3S1231E | |
| Cytomap | 3p25.3 | |
| Gene Type | protein-coding | GO ID | GO:0006403 | UniProtAcc | P55735 |
Top |
Malignant transformation analysis |
| Identification of the aberrant gene expression in precancerous and cancerous lesions by comparing the gene expression of stem-like cells in diseased tissues with normal stem cells |
| Entrez ID | Symbol | Replicates | Species | Organ | Tissue | Adj P-value | Log2FC | Malignancy |
| 6396 | SEC13 | HTA11_3410_2000001011 | Human | Colorectum | AD | 8.87e-03 | 3.31e-02 | 0.0155 |
| 6396 | SEC13 | HTA11_2487_2000001011 | Human | Colorectum | SER | 3.09e-12 | 6.69e-01 | -0.1808 |
| 6396 | SEC13 | HTA11_1938_2000001011 | Human | Colorectum | AD | 9.28e-04 | 4.09e-01 | -0.0811 |
| 6396 | SEC13 | HTA11_78_2000001011 | Human | Colorectum | AD | 1.67e-09 | 4.98e-01 | -0.1088 |
| 6396 | SEC13 | HTA11_347_2000001011 | Human | Colorectum | AD | 5.36e-21 | 6.45e-01 | -0.1954 |
| 6396 | SEC13 | HTA11_411_2000001011 | Human | Colorectum | SER | 3.62e-06 | 1.10e+00 | -0.2602 |
| 6396 | SEC13 | HTA11_2112_2000001011 | Human | Colorectum | SER | 7.63e-07 | 8.42e-01 | -0.2196 |
| 6396 | SEC13 | HTA11_3361_2000001011 | Human | Colorectum | AD | 5.90e-08 | 5.48e-01 | -0.1207 |
| 6396 | SEC13 | HTA11_696_2000001011 | Human | Colorectum | AD | 1.47e-22 | 7.19e-01 | -0.1464 |
| 6396 | SEC13 | HTA11_866_2000001011 | Human | Colorectum | AD | 1.02e-03 | 3.27e-01 | -0.1001 |
| 6396 | SEC13 | HTA11_1391_2000001011 | Human | Colorectum | AD | 7.74e-13 | 6.72e-01 | -0.059 |
| 6396 | SEC13 | HTA11_2992_2000001011 | Human | Colorectum | SER | 3.68e-02 | 5.67e-01 | -0.1706 |
| 6396 | SEC13 | HTA11_866_3004761011 | Human | Colorectum | AD | 3.05e-04 | 3.40e-01 | 0.096 |
| 6396 | SEC13 | HTA11_6801_2000001011 | Human | Colorectum | SER | 7.16e-03 | 6.12e-01 | 0.0171 |
| 6396 | SEC13 | HTA11_7696_3000711011 | Human | Colorectum | AD | 1.41e-02 | 3.00e-01 | 0.0674 |
| 6396 | SEC13 | HTA11_6818_2000001021 | Human | Colorectum | AD | 4.72e-05 | 3.25e-01 | 0.0588 |
| 6396 | SEC13 | HTA11_99999970781_79442 | Human | Colorectum | MSS | 4.80e-16 | 5.54e-01 | 0.294 |
| 6396 | SEC13 | HTA11_99999965104_69814 | Human | Colorectum | MSS | 5.83e-06 | 4.72e-01 | 0.281 |
| 6396 | SEC13 | HTA11_99999971662_82457 | Human | Colorectum | MSS | 1.06e-18 | 7.70e-01 | 0.3859 |
| 6396 | SEC13 | HTA11_99999974143_84620 | Human | Colorectum | MSS | 1.30e-03 | 3.56e-01 | 0.3005 |
| Page: 1 2 3 4 5 6 7 8 |
| Tissue | Expression Dynamics | Abbreviation |
| Colorectum (GSE201348) |  | FAP: Familial adenomatous polyposis |
| CRC: Colorectal cancer | ||
| Colorectum (HTA11) | 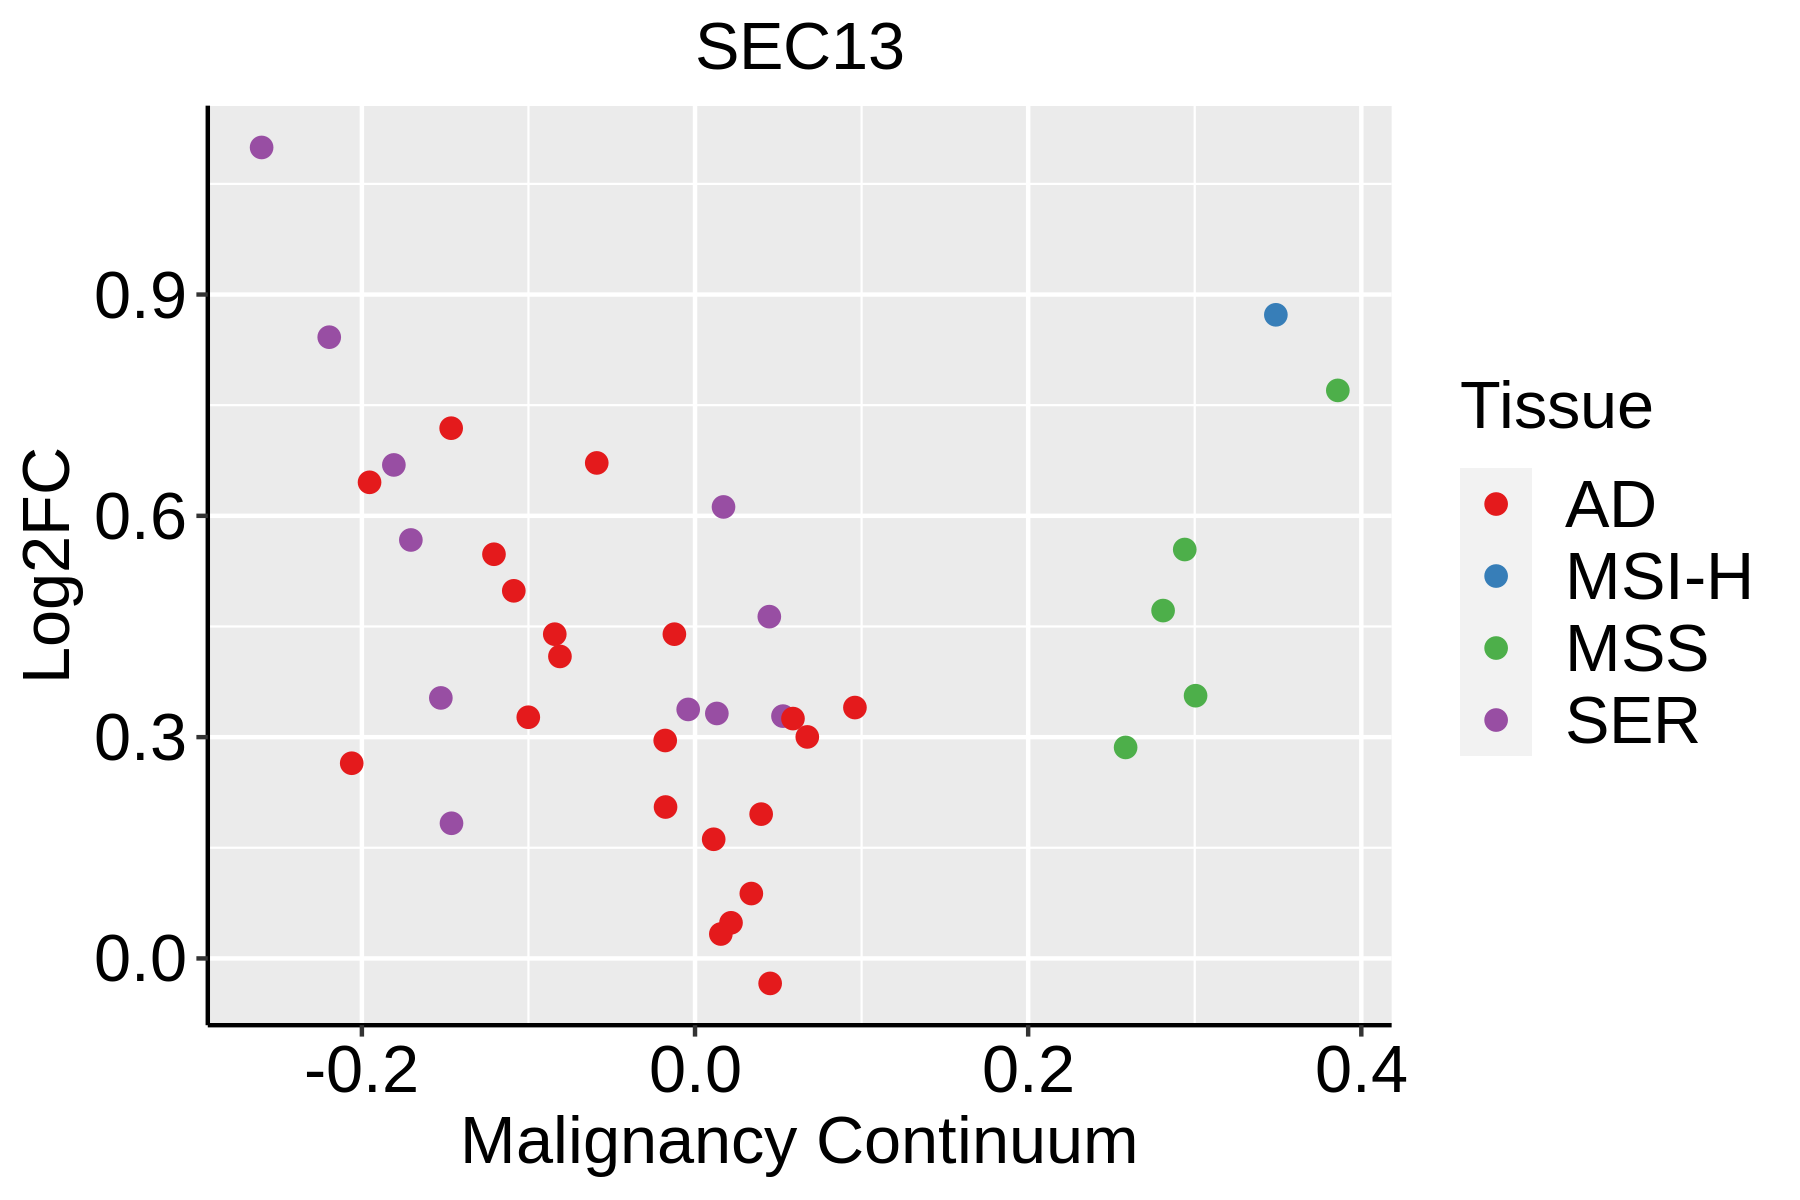 | AD: Adenomas |
| SER: Sessile serrated lesions | ||
| MSI-H: Microsatellite-high colorectal cancer | ||
| MSS: Microsatellite stable colorectal cancer | ||
| Esophagus |  | ESCC: Esophageal squamous cell carcinoma |
| HGIN: High-grade intraepithelial neoplasias | ||
| LGIN: Low-grade intraepithelial neoplasias | ||
| Liver |  | HCC: Hepatocellular carcinoma |
| NAFLD: Non-alcoholic fatty liver disease | ||
| Oral Cavity |  | EOLP: Erosive Oral lichen planus |
| LP: leukoplakia | ||
| NEOLP: Non-erosive oral lichen planus | ||
| OSCC: Oral squamous cell carcinoma | ||
| Skin | 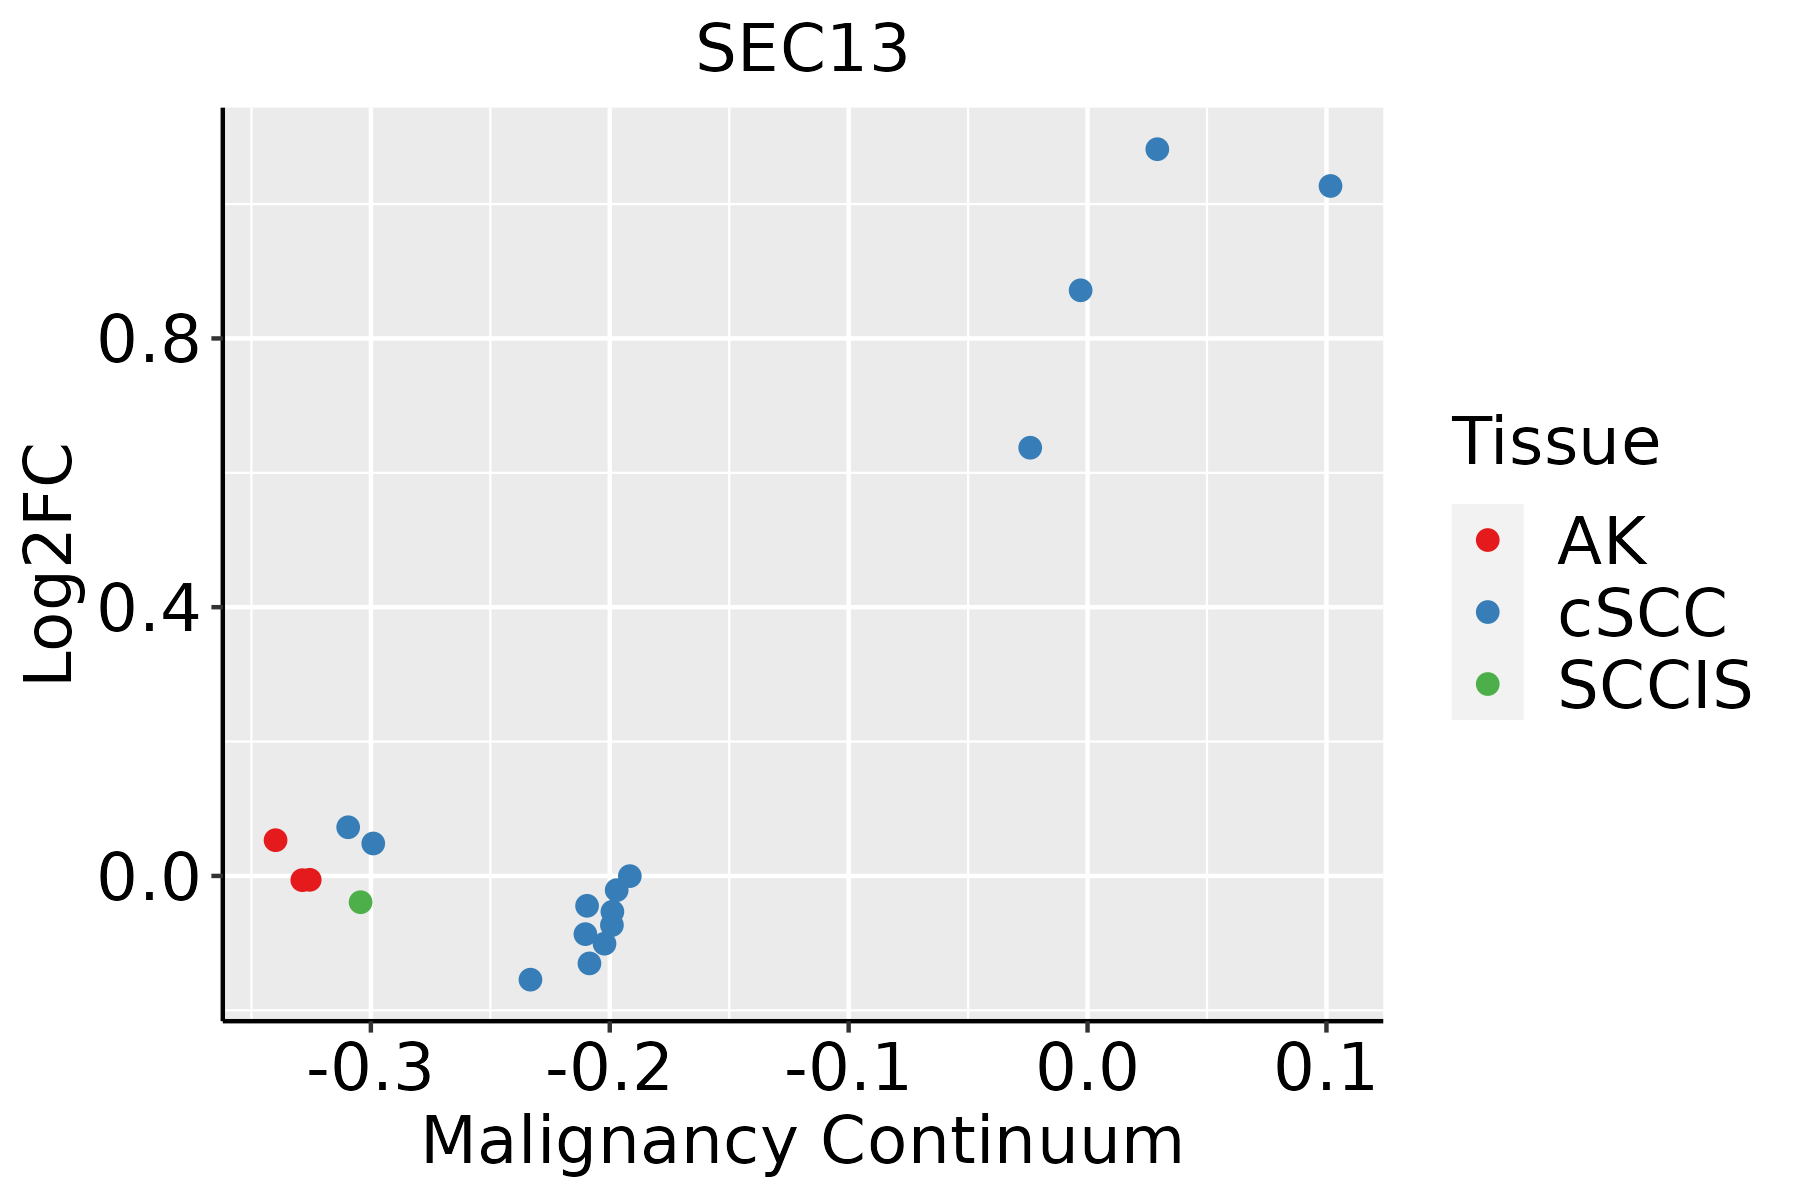 | AK: Actinic keratosis |
| cSCC: Cutaneous squamous cell carcinoma | ||
| SCCIS:squamous cell carcinoma in situ | ||
| Thyroid | 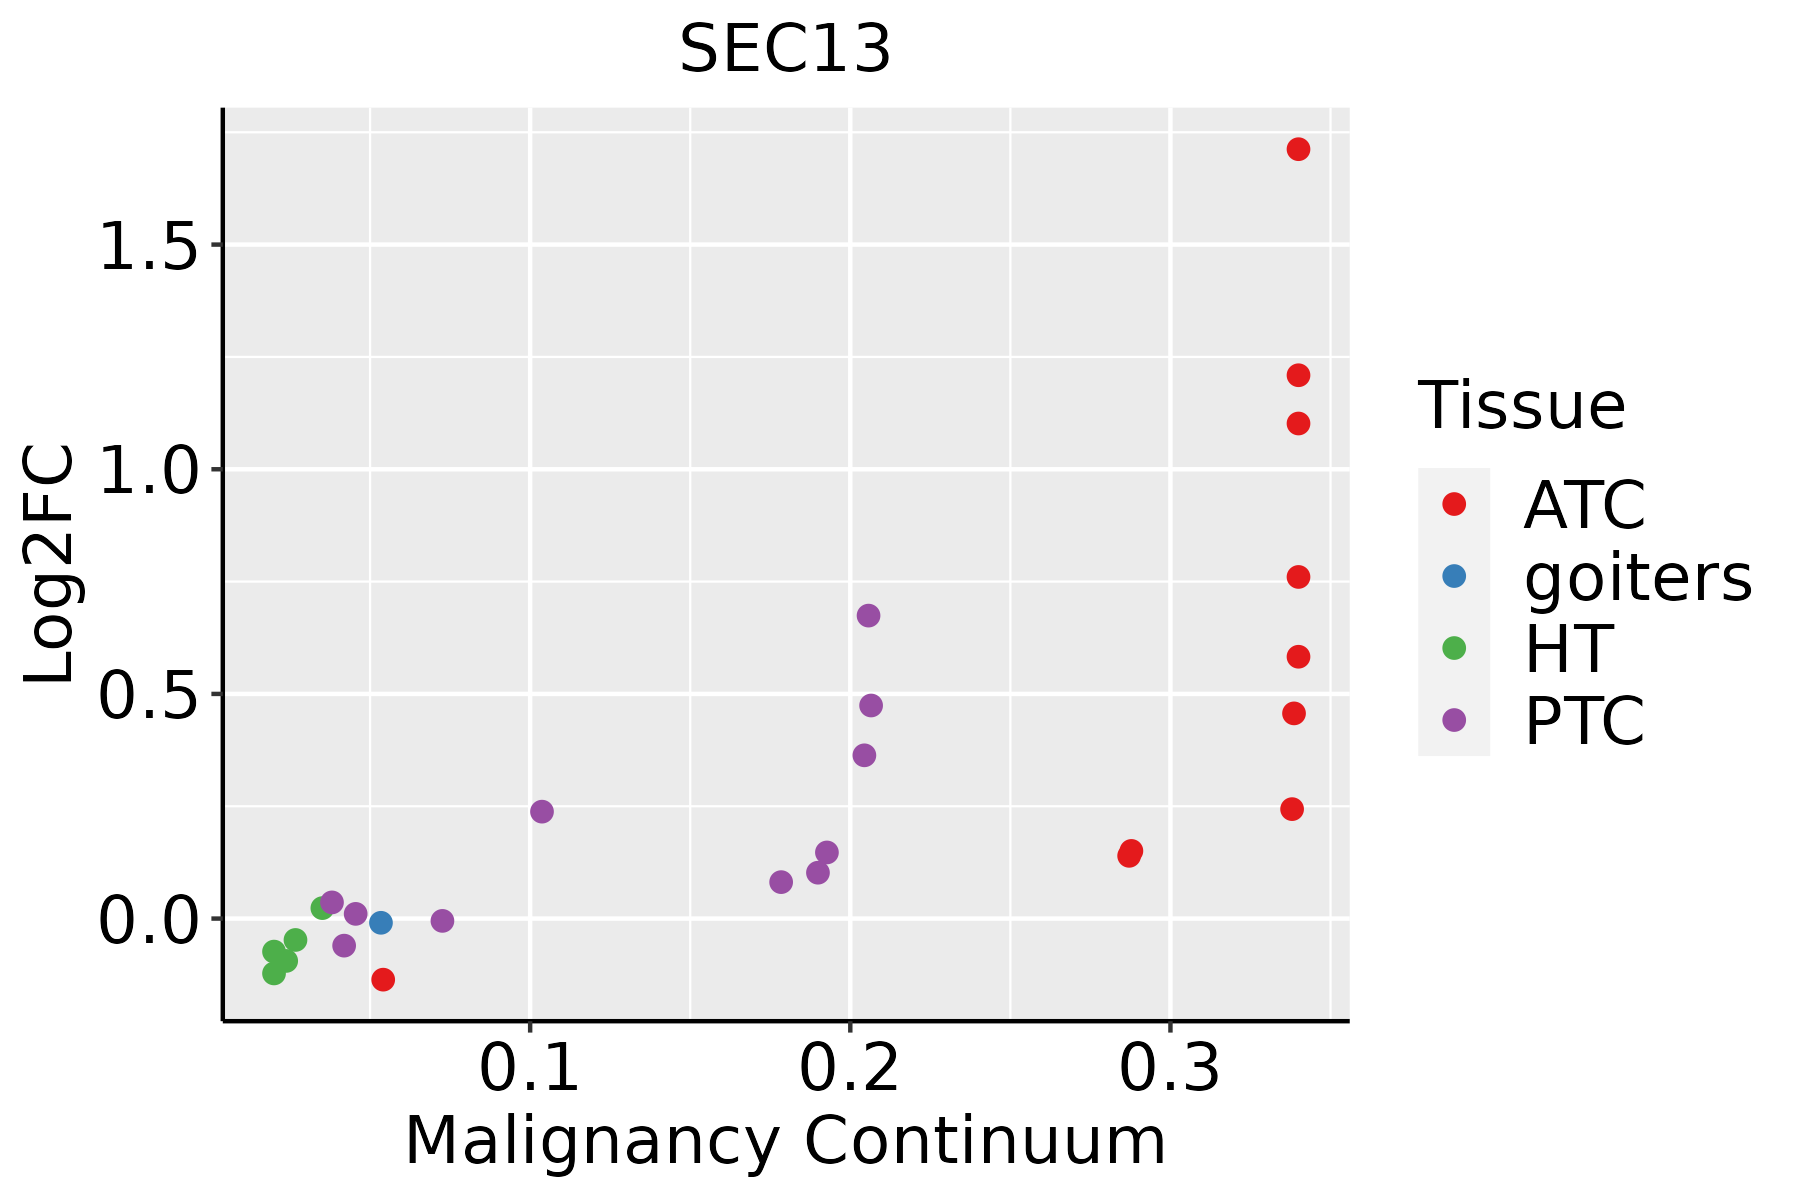 | ATC: Anaplastic thyroid cancer |
| HT: Hashimoto's thyroiditis | ||
| PTC: Papillary thyroid cancer |
| ∗log2FC in expression of this searched gene in stem-like cells from each diseased tissue sample relative to stem-like cells in normal samples in each tissue plotted against the malignancy continuum. Samples are colored based on if they are from different disease stage. |
Top |
Malignant transformation related pathway analysis |
| Find out the enriched GO biological processes and KEGG pathways involved in transition from healthy to precancer to cancer |
| Tissue | Disease Stage | Enriched GO biological Processes |
| Colorectum | AD |  |
| Colorectum | SER |  |
| Colorectum | MSS |  |
| Colorectum | MSI-H |  |
| Colorectum | FAP |  |
| ∗Top 15 enriched GO BP terms are showed in the bar plot of each disease state in each tissue. Each row represents a significant GO biological process which is colored according to the -log10(p.adjust). |
| Page: 1 2 3 4 5 6 7 8 9 |
| GO ID | Tissue | Disease Stage | Description | Gene Ratio | Bg Ratio | pvalue | p.adjust | Count |
| GO:0072594 | Colorectum | AD | establishment of protein localization to organelle | 148/3918 | 422/18723 | 7.95e-12 | 1.04e-09 | 148 |
| GO:0048193 | Colorectum | AD | Golgi vesicle transport | 109/3918 | 296/18723 | 1.80e-10 | 1.68e-08 | 109 |
| GO:0006900 | Colorectum | AD | vesicle budding from membrane | 32/3918 | 61/18723 | 5.38e-08 | 2.81e-06 | 32 |
| GO:0006913 | Colorectum | AD | nucleocytoplasmic transport | 102/3918 | 301/18723 | 1.00e-07 | 4.85e-06 | 102 |
| GO:0051169 | Colorectum | AD | nuclear transport | 102/3918 | 301/18723 | 1.00e-07 | 4.85e-06 | 102 |
| GO:0016050 | Colorectum | AD | vesicle organization | 101/3918 | 300/18723 | 1.65e-07 | 7.17e-06 | 101 |
| GO:0006403 | Colorectum | AD | RNA localization | 71/3918 | 201/18723 | 1.54e-06 | 4.76e-05 | 71 |
| GO:0034504 | Colorectum | AD | protein localization to nucleus | 94/3918 | 290/18723 | 2.83e-06 | 8.09e-05 | 94 |
| GO:0051236 | Colorectum | AD | establishment of RNA localization | 58/3918 | 166/18723 | 1.95e-05 | 4.01e-04 | 58 |
| GO:0015931 | Colorectum | AD | nucleobase-containing compound transport | 73/3918 | 222/18723 | 2.02e-05 | 4.10e-04 | 73 |
| GO:0050657 | Colorectum | AD | nucleic acid transport | 57/3918 | 163/18723 | 2.22e-05 | 4.39e-04 | 57 |
| GO:0050658 | Colorectum | AD | RNA transport | 57/3918 | 163/18723 | 2.22e-05 | 4.39e-04 | 57 |
| GO:0017038 | Colorectum | AD | protein import | 67/3918 | 206/18723 | 6.34e-05 | 1.05e-03 | 67 |
| GO:0051170 | Colorectum | AD | import into nucleus | 53/3918 | 159/18723 | 1.76e-04 | 2.38e-03 | 53 |
| GO:0006606 | Colorectum | AD | protein import into nucleus | 51/3918 | 155/18723 | 3.29e-04 | 3.86e-03 | 51 |
| GO:0006888 | Colorectum | AD | endoplasmic reticulum to Golgi vesicle-mediated transport | 44/3918 | 130/18723 | 4.13e-04 | 4.68e-03 | 44 |
| GO:0051028 | Colorectum | AD | mRNA transport | 42/3918 | 130/18723 | 1.57e-03 | 1.32e-02 | 42 |
| GO:00725941 | Colorectum | SER | establishment of protein localization to organelle | 111/2897 | 422/18723 | 4.98e-09 | 4.49e-07 | 111 |
| GO:00481931 | Colorectum | SER | Golgi vesicle transport | 79/2897 | 296/18723 | 4.20e-07 | 2.15e-05 | 79 |
| GO:00069131 | Colorectum | SER | nucleocytoplasmic transport | 77/2897 | 301/18723 | 3.39e-06 | 1.32e-04 | 77 |
| Page: 1 2 3 4 5 6 7 8 9 10 11 12 13 14 15 |
| Pathway ID | Tissue | Disease Stage | Description | Gene Ratio | Bg Ratio | pvalue | p.adjust | qvalue | Count |
| hsa05014 | Colorectum | AD | Amyotrophic lateral sclerosis | 164/2092 | 364/8465 | 4.28e-18 | 1.27e-16 | 8.09e-17 | 164 |
| hsa04141 | Colorectum | AD | Protein processing in endoplasmic reticulum | 80/2092 | 174/8465 | 5.96e-10 | 1.25e-08 | 7.96e-09 | 80 |
| hsa050141 | Colorectum | AD | Amyotrophic lateral sclerosis | 164/2092 | 364/8465 | 4.28e-18 | 1.27e-16 | 8.09e-17 | 164 |
| hsa041411 | Colorectum | AD | Protein processing in endoplasmic reticulum | 80/2092 | 174/8465 | 5.96e-10 | 1.25e-08 | 7.96e-09 | 80 |
| hsa050142 | Colorectum | SER | Amyotrophic lateral sclerosis | 138/1580 | 364/8465 | 9.89e-19 | 2.99e-17 | 2.17e-17 | 138 |
| hsa041412 | Colorectum | SER | Protein processing in endoplasmic reticulum | 60/1580 | 174/8465 | 4.20e-07 | 7.33e-06 | 5.32e-06 | 60 |
| hsa050143 | Colorectum | SER | Amyotrophic lateral sclerosis | 138/1580 | 364/8465 | 9.89e-19 | 2.99e-17 | 2.17e-17 | 138 |
| hsa041413 | Colorectum | SER | Protein processing in endoplasmic reticulum | 60/1580 | 174/8465 | 4.20e-07 | 7.33e-06 | 5.32e-06 | 60 |
| hsa050144 | Colorectum | MSS | Amyotrophic lateral sclerosis | 156/1875 | 364/8465 | 1.43e-19 | 4.62e-18 | 2.83e-18 | 156 |
| hsa041414 | Colorectum | MSS | Protein processing in endoplasmic reticulum | 75/1875 | 174/8465 | 3.78e-10 | 8.44e-09 | 5.17e-09 | 75 |
| hsa04150 | Colorectum | MSS | mTOR signaling pathway | 47/1875 | 156/8465 | 1.19e-02 | 3.99e-02 | 2.44e-02 | 47 |
| hsa050145 | Colorectum | MSS | Amyotrophic lateral sclerosis | 156/1875 | 364/8465 | 1.43e-19 | 4.62e-18 | 2.83e-18 | 156 |
| hsa041415 | Colorectum | MSS | Protein processing in endoplasmic reticulum | 75/1875 | 174/8465 | 3.78e-10 | 8.44e-09 | 5.17e-09 | 75 |
| hsa041501 | Colorectum | MSS | mTOR signaling pathway | 47/1875 | 156/8465 | 1.19e-02 | 3.99e-02 | 2.44e-02 | 47 |
| hsa050148 | Colorectum | FAP | Amyotrophic lateral sclerosis | 91/1404 | 364/8465 | 1.84e-05 | 2.36e-04 | 1.44e-04 | 91 |
| hsa041418 | Colorectum | FAP | Protein processing in endoplasmic reticulum | 50/1404 | 174/8465 | 3.64e-05 | 3.68e-04 | 2.24e-04 | 50 |
| hsa050149 | Colorectum | FAP | Amyotrophic lateral sclerosis | 91/1404 | 364/8465 | 1.84e-05 | 2.36e-04 | 1.44e-04 | 91 |
| hsa041419 | Colorectum | FAP | Protein processing in endoplasmic reticulum | 50/1404 | 174/8465 | 3.64e-05 | 3.68e-04 | 2.24e-04 | 50 |
| hsa0501430 | Esophagus | HGIN | Amyotrophic lateral sclerosis | 140/1383 | 364/8465 | 2.13e-25 | 1.16e-23 | 9.19e-24 | 140 |
| hsa0414139 | Esophagus | HGIN | Protein processing in endoplasmic reticulum | 67/1383 | 174/8465 | 1.06e-12 | 2.16e-11 | 1.72e-11 | 67 |
| Page: 1 2 3 4 |
Top |
Cell-cell communication analysis |
| Identification of potential cell-cell interactions between two cell types and their ligand-receptor pairs for different disease states |
| Ligand | Receptor | LRpair | Pathway | Tissue | Disease Stage |
| Page: 1 |
Top |
Single-cell gene regulatory network inference analysis |
| Find out the significant the regulons (TFs) and the target genes of each regulon across cell types for different disease states |
| TF | Cell Type | Tissue | Disease Stage | Target Gene | RSS | Regulon Activity |
| ∗The dot plots of a searched regulon are shown for all cell subpopulations in each disease state of each tissue based on the regulon specific score inferred using pySCENIC and by calculating the average expression. |
| Page: 1 |
Top |
Somatic mutation of malignant transformation related genes |
| Annotation of somatic variants for genes involved in malignant transformation |
| Hugo Symbol | Variant Class | Variant Classification | dbSNP RS | HGVSc | HGVSp | HGVSp Short | SWISSPROT | BIOTYPE | SIFT | PolyPhen | Tumor Sample Barcode | Tissue | Histology | Sex | Age | Stage | Therapy Types | Drugs | Outcome |
| SEC13 | SNV | Missense_Mutation | c.1018N>A | p.Asp340Asn | p.D340N | P55735 | protein_coding | tolerated(0.18) | benign(0.301) | TCGA-AC-A23H-01 | Breast | breast invasive carcinoma | Female | >=65 | I/II | Unknown | Unknown | PD | |
| SEC13 | SNV | Missense_Mutation | rs149879822 | c.430N>A | p.Glu144Lys | p.E144K | P55735 | protein_coding | tolerated(0.11) | benign(0.027) | TCGA-BH-A0BV-01 | Breast | breast invasive carcinoma | Female | >=65 | I/II | Chemotherapy | doxorubicin | SD |
| SEC13 | insertion | Nonsense_Mutation | novel | c.489_490insTCCTACTTACTATAATG | p.Leu164SerfsTer5 | p.L164Sfs*5 | P55735 | protein_coding | TCGA-BH-A0BM-01 | Breast | breast invasive carcinoma | Female | <65 | I/II | Chemotherapy | adriamycin | SD | ||
| SEC13 | deletion | Frame_Shift_Del | c.563_567delNNNNN | p.Val188GlufsTer45 | p.V188Efs*45 | P55735 | protein_coding | TCGA-BH-A18G-01 | Breast | breast invasive carcinoma | Female | >=65 | I/II | Unknown | Unknown | SD | |||
| SEC13 | deletion | Frame_Shift_Del | novel | c.1099delN | p.Glu367SerfsTer50 | p.E367Sfs*50 | P55735 | protein_coding | TCGA-EW-A2FV-01 | Breast | breast invasive carcinoma | Female | <65 | III/IV | Chemotherapy | docetaxel | SD | ||
| SEC13 | SNV | Missense_Mutation | rs754797935 | c.938A>G | p.His313Arg | p.H313R | P55735 | protein_coding | tolerated(1) | probably_damaging(0.996) | TCGA-AA-3815-01 | Colorectum | colon adenocarcinoma | Female | >=65 | I/II | Unknown | Unknown | SD |
| SEC13 | SNV | Missense_Mutation | c.908N>G | p.Leu303Trp | p.L303W | P55735 | protein_coding | deleterious(0.03) | probably_damaging(0.958) | TCGA-AA-3977-01 | Colorectum | colon adenocarcinoma | Male | >=65 | I/II | Unknown | Unknown | SD | |
| SEC13 | deletion | Frame_Shift_Del | c.478delN | p.His160MetfsTer5 | p.H160Mfs*5 | P55735 | protein_coding | TCGA-NH-A5IV-01 | Colorectum | colon adenocarcinoma | Female | >=65 | I/II | Unknown | Unknown | SD | |||
| SEC13 | SNV | Missense_Mutation | novel | c.921N>A | p.Phe307Leu | p.F307L | P55735 | protein_coding | deleterious(0.04) | probably_damaging(0.992) | TCGA-A5-A2K5-01 | Endometrium | uterine corpus endometrioid carcinoma | Female | >=65 | I/II | Unknown | Unknown | SD |
| SEC13 | SNV | Missense_Mutation | rs764858977 | c.973G>A | p.Val325Ile | p.V325I | P55735 | protein_coding | deleterious(0.04) | probably_damaging(0.972) | TCGA-AP-A05O-01 | Endometrium | uterine corpus endometrioid carcinoma | Female | >=65 | I/II | Chemotherapy | carboplatin | PD |
| Page: 1 2 3 |
Top |
Related drugs of malignant transformation related genes |
| Identification of chemicals and drugs interact with genes involved in malignant transfromation |
| (DGIdb 4.0) |
| Entrez ID | Symbol | Category | Interaction Types | Drug Claim Name | Drug Name | PMIDs |
| Page: 1 |

Copyright 2023-Present -The University of Texas Health Science Center at Houston |