
|
|||||
|
 | |
| |
| |
| |
| |
| |
|
Gene: SEC11C |
Gene summary for SEC11C |
| Gene information | Species | Human | Gene symbol | SEC11C | Gene ID | 90701 |
| Gene name | SEC11 homolog C, signal peptidase complex subunit | |
| Gene Alias | SEC11L3 | |
| Cytomap | 18q21.32 | |
| Gene Type | protein-coding | GO ID | GO:0006465 | UniProtAcc | K7EJQ7 |
Top |
Malignant transformation analysis |
| Identification of the aberrant gene expression in precancerous and cancerous lesions by comparing the gene expression of stem-like cells in diseased tissues with normal stem cells |
| Entrez ID | Symbol | Replicates | Species | Organ | Tissue | Adj P-value | Log2FC | Malignancy |
| 90701 | SEC11C | CA_HPV_1 | Human | Cervix | CC | 7.73e-07 | -2.46e-01 | 0.0264 |
| 90701 | SEC11C | CA_HPV_3 | Human | Cervix | CC | 1.58e-02 | -2.13e-01 | 0.0414 |
| 90701 | SEC11C | N_HPV_1 | Human | Cervix | N_HPV | 1.30e-05 | -2.31e-01 | 0.0079 |
| 90701 | SEC11C | CCI_1 | Human | Cervix | CC | 2.82e-08 | -5.75e-01 | 0.528 |
| 90701 | SEC11C | CCI_2 | Human | Cervix | CC | 4.26e-04 | -5.31e-01 | 0.5249 |
| 90701 | SEC11C | CCI_3 | Human | Cervix | CC | 1.04e-08 | -5.59e-01 | 0.516 |
| 90701 | SEC11C | CCII_1 | Human | Cervix | CC | 3.98e-13 | -5.63e-01 | 0.3249 |
| 90701 | SEC11C | sample3 | Human | Cervix | CC | 2.40e-06 | -2.13e-01 | 0.1387 |
| 90701 | SEC11C | T3 | Human | Cervix | CC | 9.65e-05 | -2.61e-01 | 0.1389 |
| 90701 | SEC11C | HTA11_3410_2000001011 | Human | Colorectum | AD | 2.31e-05 | 1.23e-01 | 0.0155 |
| 90701 | SEC11C | HTA11_1938_2000001011 | Human | Colorectum | AD | 2.30e-08 | 3.85e-01 | -0.0811 |
| 90701 | SEC11C | HTA11_347_2000001011 | Human | Colorectum | AD | 2.32e-08 | 3.03e-01 | -0.1954 |
| 90701 | SEC11C | HTA11_696_2000001011 | Human | Colorectum | AD | 6.95e-07 | 2.93e-01 | -0.1464 |
| 90701 | SEC11C | HTA11_1391_2000001011 | Human | Colorectum | AD | 1.62e-13 | 5.35e-01 | -0.059 |
| 90701 | SEC11C | HTA11_546_2000001011 | Human | Colorectum | AD | 2.27e-03 | 3.17e-01 | -0.0842 |
| 90701 | SEC11C | HTA11_866_3004761011 | Human | Colorectum | AD | 4.15e-05 | 2.08e-01 | 0.096 |
| 90701 | SEC11C | HTA11_6801_2000001011 | Human | Colorectum | SER | 7.49e-04 | 3.58e-01 | 0.0171 |
| 90701 | SEC11C | HTA11_7696_3000711011 | Human | Colorectum | AD | 7.06e-03 | 1.17e-01 | 0.0674 |
| 90701 | SEC11C | HTA11_7469_2000001011 | Human | Colorectum | AD | 1.86e-02 | 4.46e-01 | -0.0124 |
| 90701 | SEC11C | HTA11_99999970781_79442 | Human | Colorectum | MSS | 2.83e-09 | 4.14e-01 | 0.294 |
| Page: 1 2 3 4 5 6 7 8 9 |
| Tissue | Expression Dynamics | Abbreviation |
| Cervix | 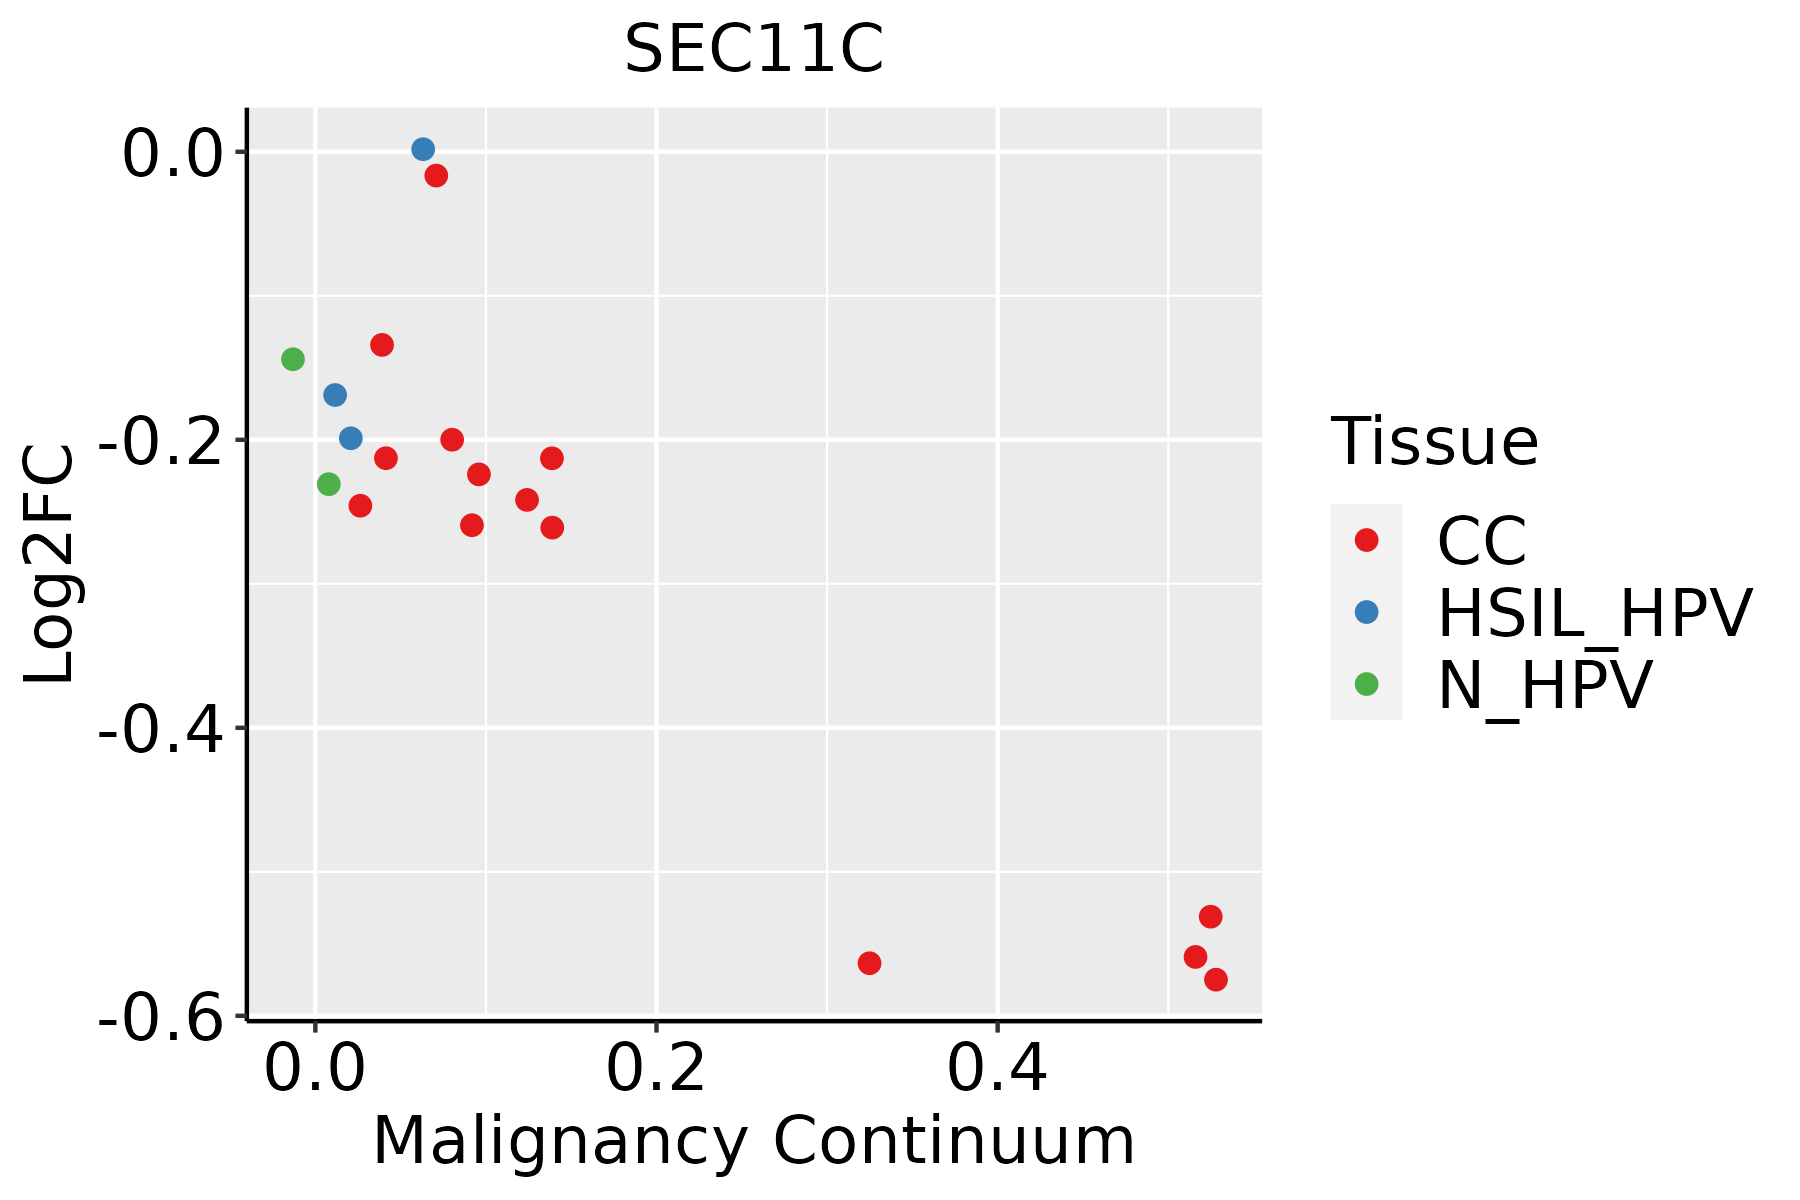 | CC: Cervix cancer |
| HSIL_HPV: HPV-infected high-grade squamous intraepithelial lesions | ||
| N_HPV: HPV-infected normal cervix | ||
| Colorectum (GSE201348) |  | FAP: Familial adenomatous polyposis |
| CRC: Colorectal cancer | ||
| Colorectum (HTA11) |  | AD: Adenomas |
| SER: Sessile serrated lesions | ||
| MSI-H: Microsatellite-high colorectal cancer | ||
| MSS: Microsatellite stable colorectal cancer | ||
| Esophagus | 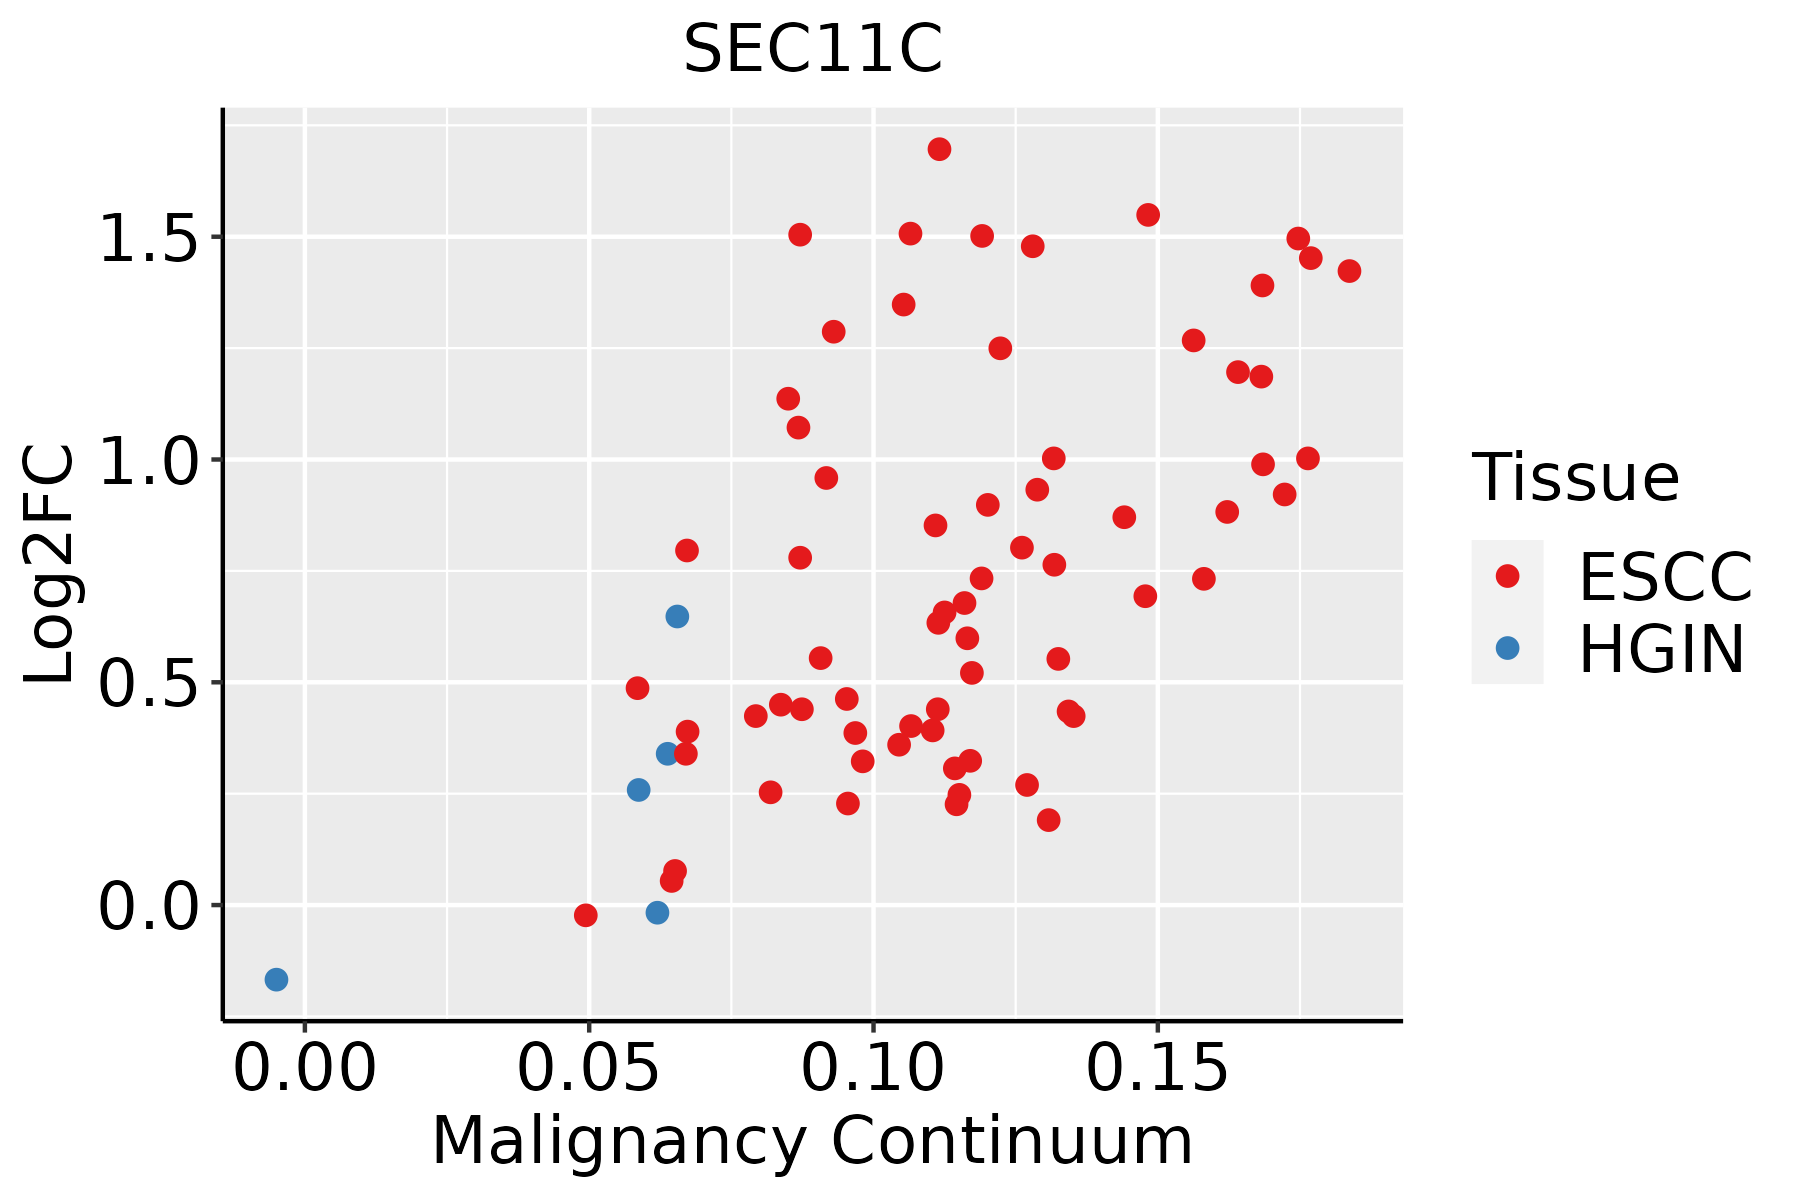 | ESCC: Esophageal squamous cell carcinoma |
| HGIN: High-grade intraepithelial neoplasias | ||
| LGIN: Low-grade intraepithelial neoplasias | ||
| Liver | 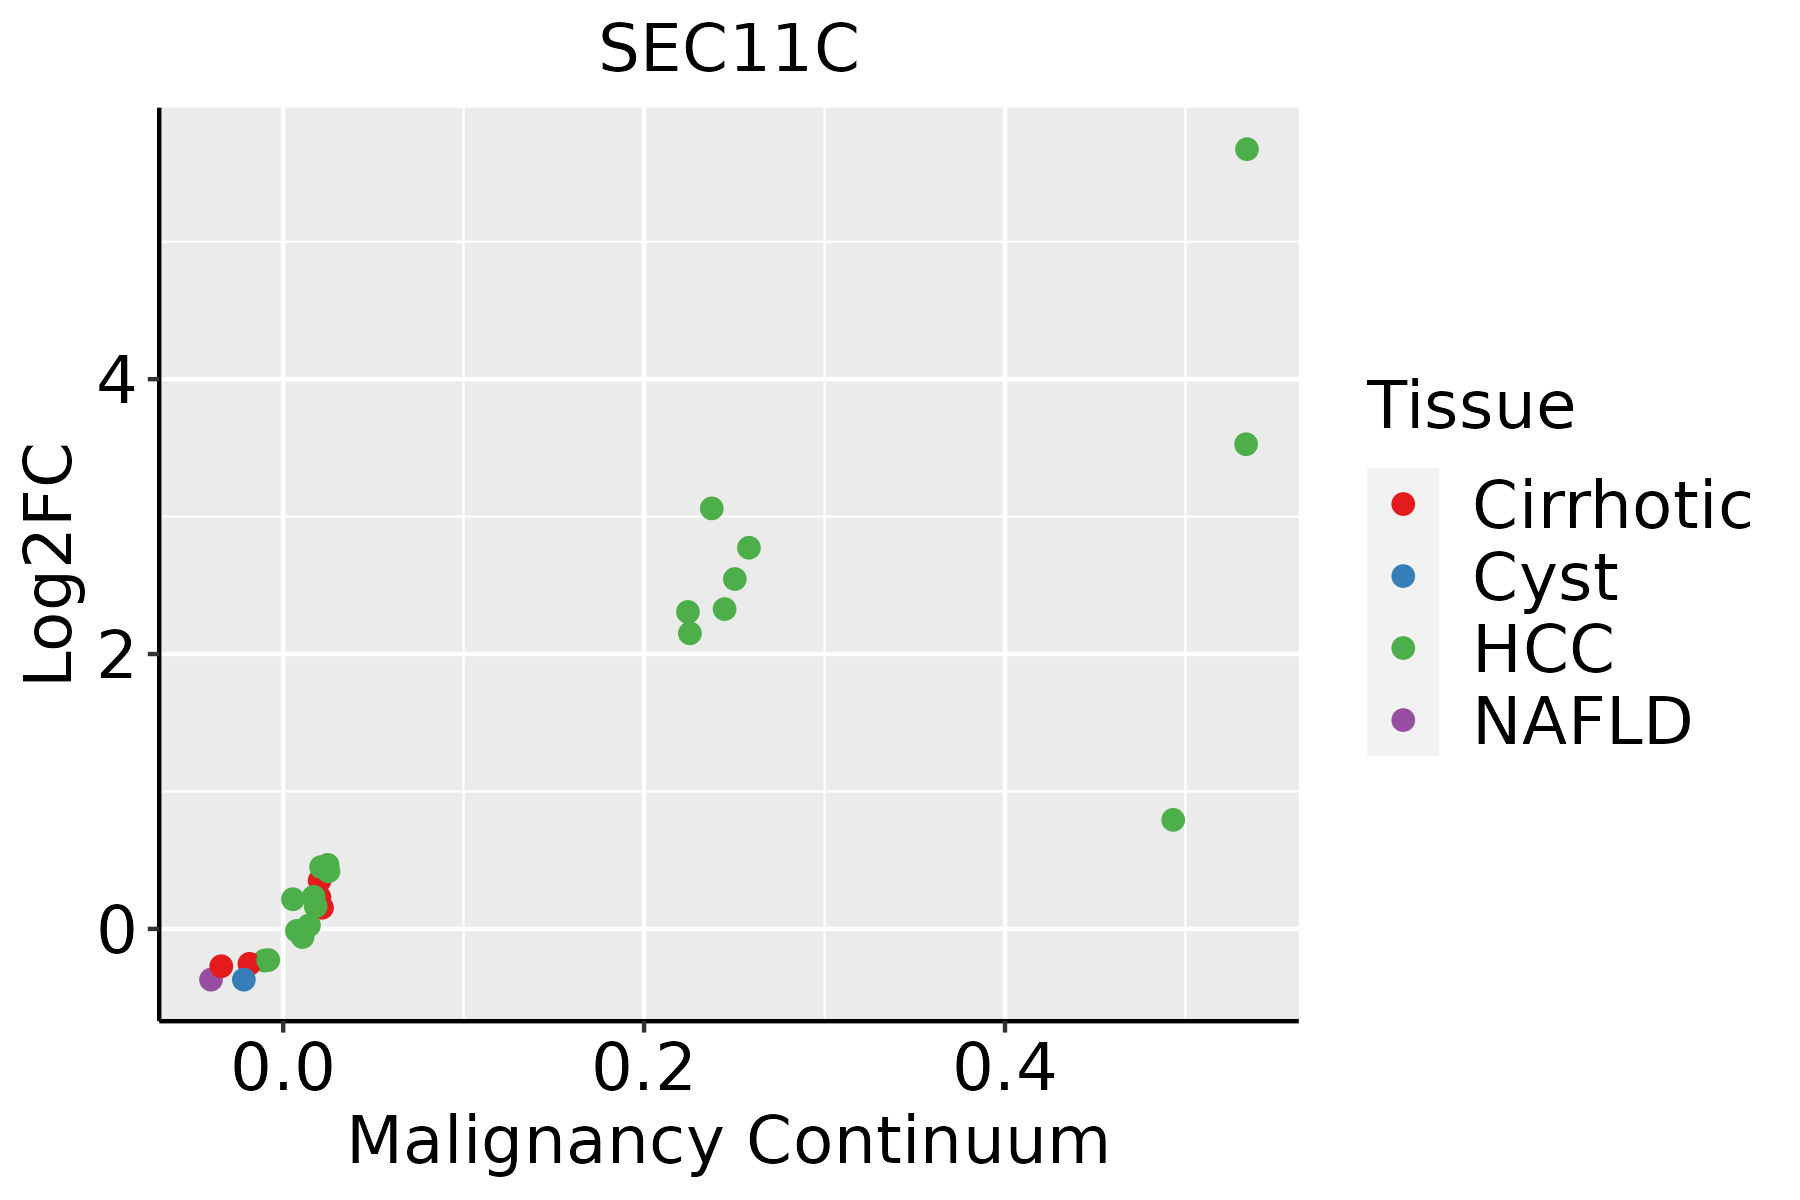 | HCC: Hepatocellular carcinoma |
| NAFLD: Non-alcoholic fatty liver disease | ||
| Oral Cavity | 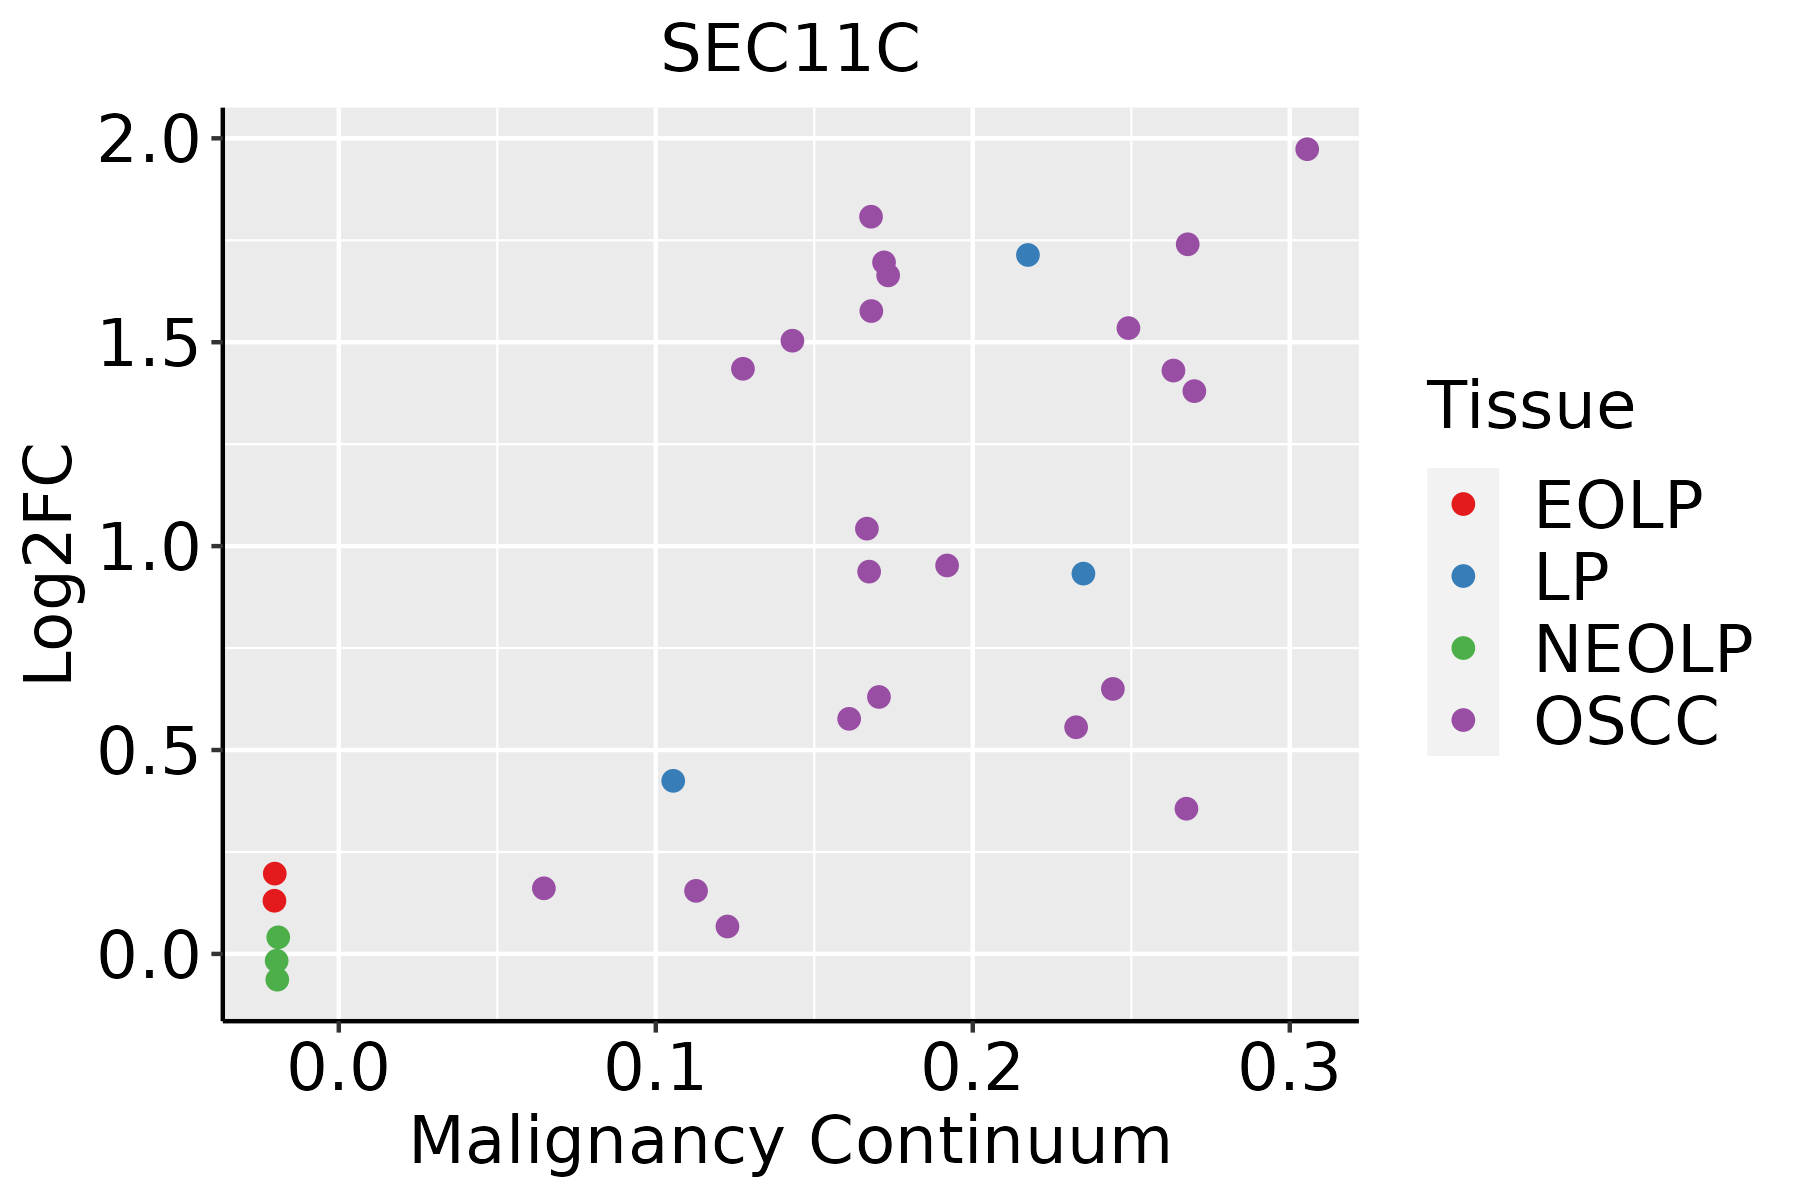 | EOLP: Erosive Oral lichen planus |
| LP: leukoplakia | ||
| NEOLP: Non-erosive oral lichen planus | ||
| OSCC: Oral squamous cell carcinoma | ||
| Prostate | 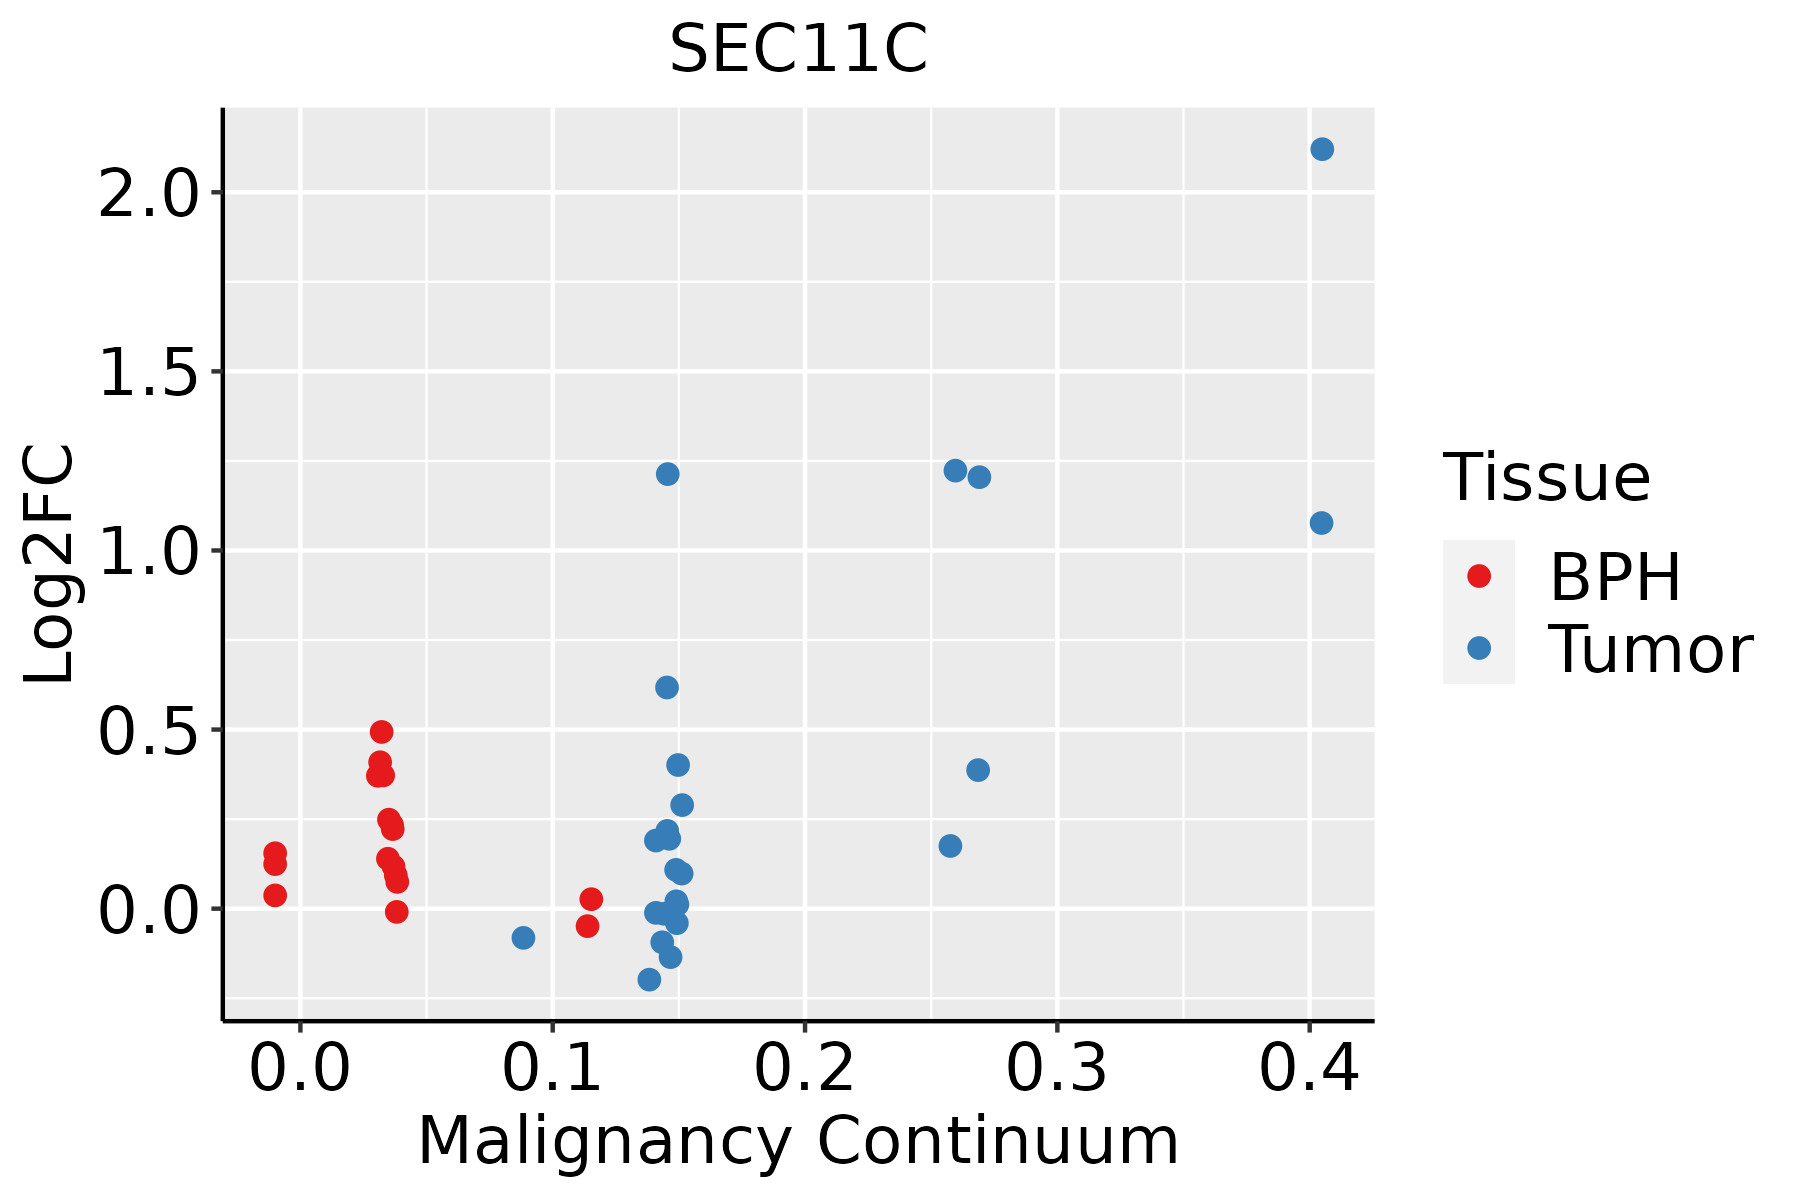 | BPH: Benign Prostatic Hyperplasia |
| Skin | 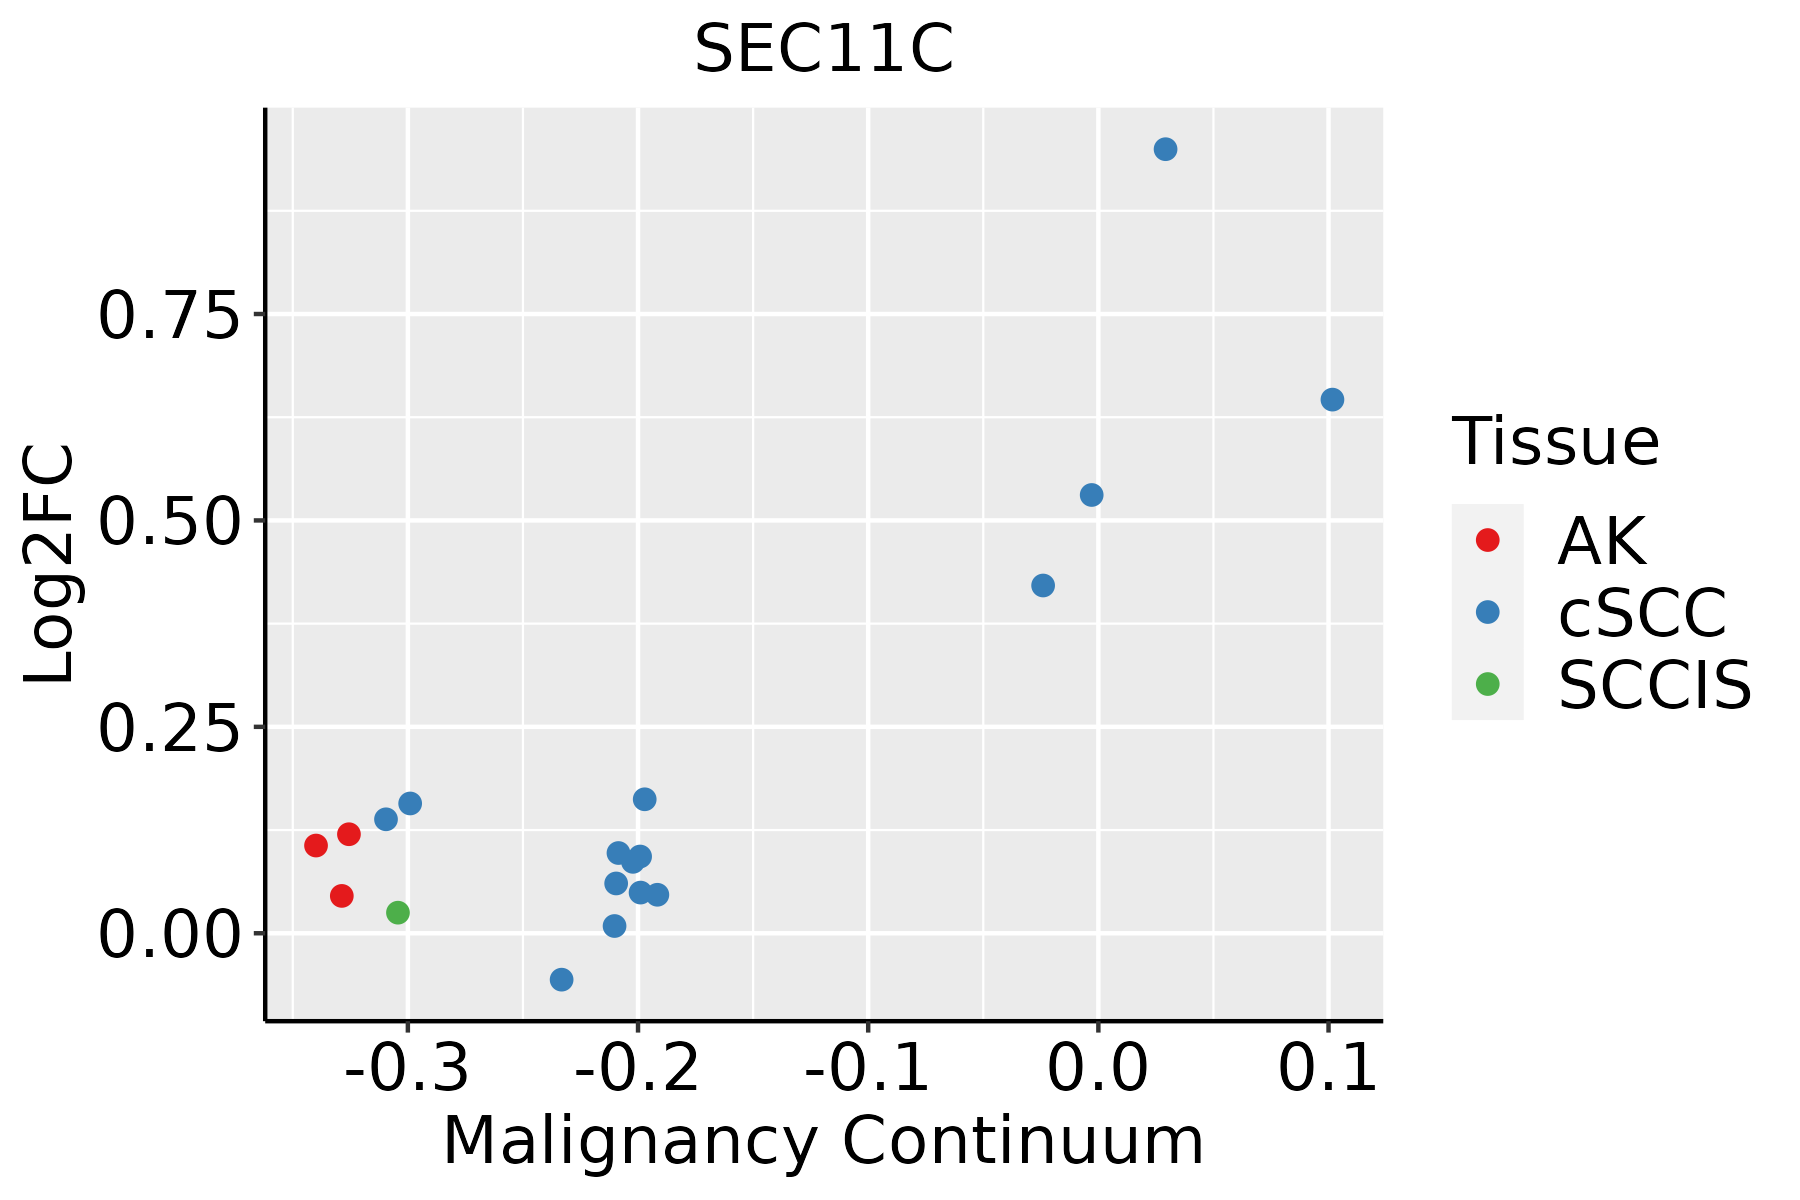 | AK: Actinic keratosis |
| cSCC: Cutaneous squamous cell carcinoma | ||
| SCCIS:squamous cell carcinoma in situ | ||
| Thyroid | 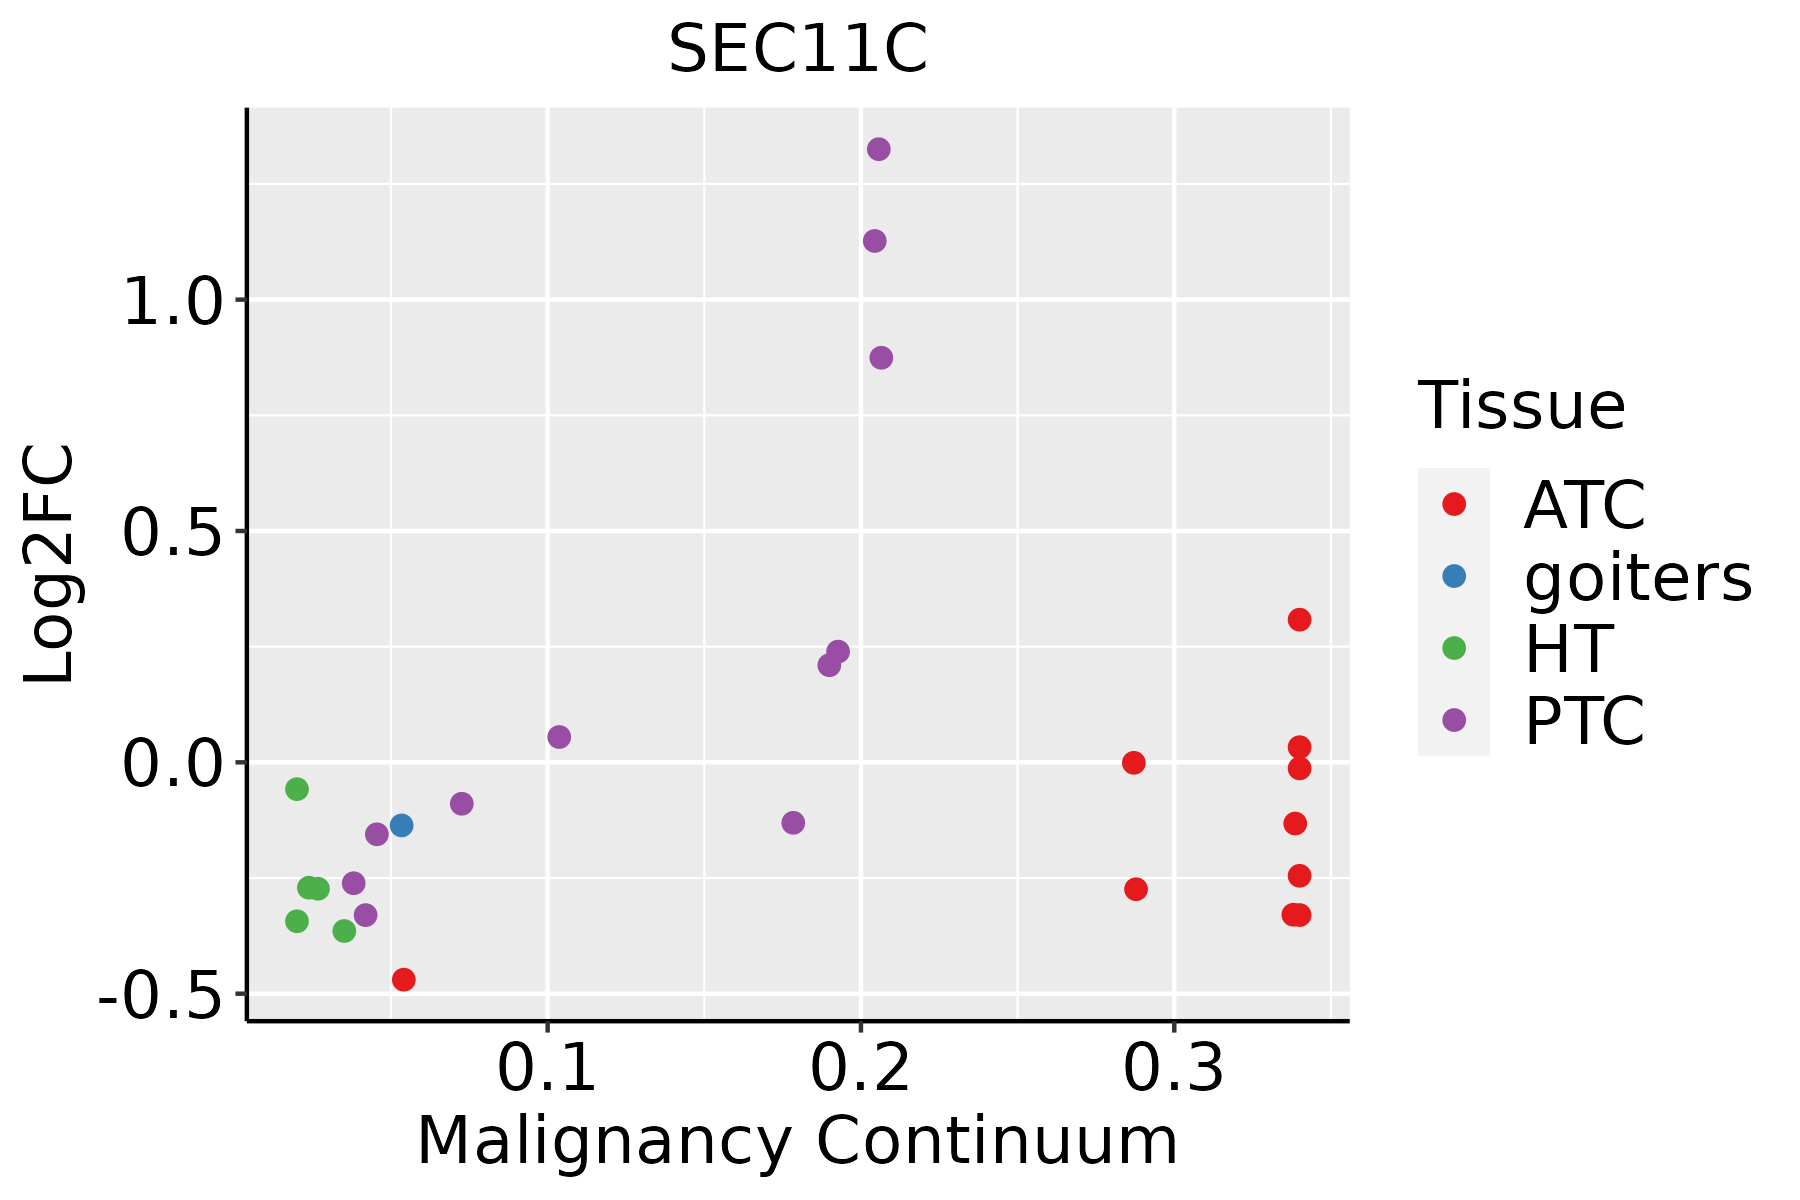 | ATC: Anaplastic thyroid cancer |
| HT: Hashimoto's thyroiditis | ||
| PTC: Papillary thyroid cancer |
| ∗log2FC in expression of this searched gene in stem-like cells from each diseased tissue sample relative to stem-like cells in normal samples in each tissue plotted against the malignancy continuum. Samples are colored based on if they are from different disease stage. |
Top |
Malignant transformation related pathway analysis |
| Find out the enriched GO biological processes and KEGG pathways involved in transition from healthy to precancer to cancer |
| Tissue | Disease Stage | Enriched GO biological Processes |
| Colorectum | AD |  |
| Colorectum | SER |  |
| Colorectum | MSS |  |
| Colorectum | MSI-H |  |
| Colorectum | FAP |  |
| ∗Top 15 enriched GO BP terms are showed in the bar plot of each disease state in each tissue. Each row represents a significant GO biological process which is colored according to the -log10(p.adjust). |
| Page: 1 2 3 4 5 6 7 8 9 |
| GO ID | Tissue | Disease Stage | Description | Gene Ratio | Bg Ratio | pvalue | p.adjust | Count |
| GO:00064657 | Cervix | CC | signal peptide processing | 8/2311 | 14/18723 | 8.01e-05 | 1.09e-03 | 8 |
| GO:00516048 | Cervix | CC | protein maturation | 56/2311 | 294/18723 | 5.90e-04 | 5.59e-03 | 56 |
| GO:005160414 | Cervix | N_HPV | protein maturation | 20/534 | 294/18723 | 3.17e-04 | 4.75e-03 | 20 |
| GO:00164854 | Cervix | N_HPV | protein processing | 15/534 | 225/18723 | 2.09e-03 | 2.00e-02 | 15 |
| GO:000646511 | Cervix | N_HPV | signal peptide processing | 3/534 | 14/18723 | 6.64e-03 | 4.45e-02 | 3 |
| GO:0006465 | Colorectum | AD | signal peptide processing | 10/3918 | 14/18723 | 6.90e-05 | 1.11e-03 | 10 |
| GO:0051604 | Colorectum | AD | protein maturation | 85/3918 | 294/18723 | 6.73e-04 | 6.91e-03 | 85 |
| GO:0016485 | Colorectum | AD | protein processing | 63/3918 | 225/18723 | 6.77e-03 | 4.19e-02 | 63 |
| GO:00516041 | Colorectum | SER | protein maturation | 73/2897 | 294/18723 | 1.82e-05 | 5.38e-04 | 73 |
| GO:00164851 | Colorectum | SER | protein processing | 55/2897 | 225/18723 | 2.84e-04 | 4.67e-03 | 55 |
| GO:00064651 | Colorectum | SER | signal peptide processing | 7/2897 | 14/18723 | 2.64e-03 | 2.41e-02 | 7 |
| GO:00064652 | Colorectum | MSS | signal peptide processing | 11/3467 | 14/18723 | 1.81e-06 | 5.70e-05 | 11 |
| GO:00516042 | Colorectum | MSS | protein maturation | 75/3467 | 294/18723 | 1.70e-03 | 1.53e-02 | 75 |
| GO:00164852 | Colorectum | MSS | protein processing | 57/3467 | 225/18723 | 6.60e-03 | 4.38e-02 | 57 |
| GO:00064653 | Colorectum | MSI-H | signal peptide processing | 7/1319 | 14/18723 | 1.87e-05 | 7.82e-04 | 7 |
| GO:00516043 | Colorectum | MSI-H | protein maturation | 34/1319 | 294/18723 | 3.02e-03 | 3.80e-02 | 34 |
| GO:005160417 | Esophagus | HGIN | protein maturation | 68/2587 | 294/18723 | 9.77e-06 | 2.86e-04 | 68 |
| GO:000646515 | Esophagus | HGIN | signal peptide processing | 8/2587 | 14/18723 | 1.81e-04 | 3.45e-03 | 8 |
| GO:00164857 | Esophagus | HGIN | protein processing | 49/2587 | 225/18723 | 7.04e-04 | 9.52e-03 | 49 |
| GO:005160418 | Esophagus | ESCC | protein maturation | 189/8552 | 294/18723 | 7.64e-11 | 2.39e-09 | 189 |
| Page: 1 2 3 |
| Pathway ID | Tissue | Disease Stage | Description | Gene Ratio | Bg Ratio | pvalue | p.adjust | qvalue | Count |
| hsa0306010 | Cervix | CC | Protein export | 10/1267 | 23/8465 | 9.64e-04 | 4.22e-03 | 2.49e-03 | 10 |
| hsa0306013 | Cervix | CC | Protein export | 10/1267 | 23/8465 | 9.64e-04 | 4.22e-03 | 2.49e-03 | 10 |
| hsa03060 | Colorectum | AD | Protein export | 14/2092 | 23/8465 | 2.43e-04 | 1.90e-03 | 1.21e-03 | 14 |
| hsa030601 | Colorectum | AD | Protein export | 14/2092 | 23/8465 | 2.43e-04 | 1.90e-03 | 1.21e-03 | 14 |
| hsa030602 | Colorectum | MSS | Protein export | 15/1875 | 23/8465 | 1.13e-05 | 1.26e-04 | 7.71e-05 | 15 |
| hsa030603 | Colorectum | MSS | Protein export | 15/1875 | 23/8465 | 1.13e-05 | 1.26e-04 | 7.71e-05 | 15 |
| hsa030604 | Colorectum | MSI-H | Protein export | 11/797 | 23/8465 | 2.26e-06 | 3.65e-05 | 3.06e-05 | 11 |
| hsa030605 | Colorectum | MSI-H | Protein export | 11/797 | 23/8465 | 2.26e-06 | 3.65e-05 | 3.06e-05 | 11 |
| hsa0306020 | Esophagus | HGIN | Protein export | 13/1383 | 23/8465 | 1.27e-05 | 1.80e-04 | 1.43e-04 | 13 |
| hsa03060110 | Esophagus | HGIN | Protein export | 13/1383 | 23/8465 | 1.27e-05 | 1.80e-04 | 1.43e-04 | 13 |
| hsa0306026 | Esophagus | ESCC | Protein export | 22/4205 | 23/8465 | 2.43e-06 | 1.43e-05 | 7.32e-06 | 22 |
| hsa0306036 | Esophagus | ESCC | Protein export | 22/4205 | 23/8465 | 2.43e-06 | 1.43e-05 | 7.32e-06 | 22 |
| hsa030608 | Liver | Cirrhotic | Protein export | 20/2530 | 23/8465 | 2.00e-08 | 3.51e-07 | 2.17e-07 | 20 |
| hsa0306011 | Liver | Cirrhotic | Protein export | 20/2530 | 23/8465 | 2.00e-08 | 3.51e-07 | 2.17e-07 | 20 |
| hsa0306021 | Liver | HCC | Protein export | 21/4020 | 23/8465 | 1.20e-05 | 8.53e-05 | 4.74e-05 | 21 |
| hsa0306031 | Liver | HCC | Protein export | 21/4020 | 23/8465 | 1.20e-05 | 8.53e-05 | 4.74e-05 | 21 |
| hsa0306018 | Oral cavity | OSCC | Protein export | 21/3704 | 23/8465 | 2.42e-06 | 1.27e-05 | 6.45e-06 | 21 |
| hsa0306019 | Oral cavity | OSCC | Protein export | 21/3704 | 23/8465 | 2.42e-06 | 1.27e-05 | 6.45e-06 | 21 |
| hsa0306025 | Oral cavity | LP | Protein export | 21/2418 | 23/8465 | 4.72e-10 | 8.28e-09 | 5.34e-09 | 21 |
| hsa0306035 | Oral cavity | LP | Protein export | 21/2418 | 23/8465 | 4.72e-10 | 8.28e-09 | 5.34e-09 | 21 |
| Page: 1 2 |
Top |
Cell-cell communication analysis |
| Identification of potential cell-cell interactions between two cell types and their ligand-receptor pairs for different disease states |
| Ligand | Receptor | LRpair | Pathway | Tissue | Disease Stage |
| Page: 1 |
Top |
Single-cell gene regulatory network inference analysis |
| Find out the significant the regulons (TFs) and the target genes of each regulon across cell types for different disease states |
| TF | Cell Type | Tissue | Disease Stage | Target Gene | RSS | Regulon Activity |
| ∗The dot plots of a searched regulon are shown for all cell subpopulations in each disease state of each tissue based on the regulon specific score inferred using pySCENIC and by calculating the average expression. |
| Page: 1 |
Top |
Somatic mutation of malignant transformation related genes |
| Annotation of somatic variants for genes involved in malignant transformation |
| Hugo Symbol | Variant Class | Variant Classification | dbSNP RS | HGVSc | HGVSp | HGVSp Short | SWISSPROT | BIOTYPE | SIFT | PolyPhen | Tumor Sample Barcode | Tissue | Histology | Sex | Age | Stage | Therapy Types | Drugs | Outcome |
| SEC11C | SNV | Missense_Mutation | c.575N>T | p.Ser192Phe | p.S192F | Q9BY50 | protein_coding | deleterious(0) | benign(0.198) | TCGA-C5-A8XJ-01 | Cervix | cervical & endocervical cancer | Female | >=65 | I/II | Chemotherapy | cisplatin | SD | |
| SEC11C | SNV | Missense_Mutation | c.326N>C | p.Arg109Thr | p.R109T | Q9BY50 | protein_coding | deleterious(0) | probably_damaging(0.99) | TCGA-AA-3856-01 | Colorectum | colon adenocarcinoma | Male | <65 | I/II | Unknown | Unknown | SD | |
| SEC11C | SNV | Missense_Mutation | novel | c.496A>G | p.Ile166Val | p.I166V | Q9BY50 | protein_coding | deleterious(0) | possibly_damaging(0.885) | TCGA-AA-3972-01 | Colorectum | colon adenocarcinoma | Male | >=65 | III/IV | Chemotherapy | capecitabine | PD |
| SEC11C | SNV | Missense_Mutation | c.167N>A | p.Gly56Asp | p.G56D | Q9BY50 | protein_coding | tolerated(0.21) | benign(0.078) | TCGA-CK-6746-01 | Colorectum | colon adenocarcinoma | Female | >=65 | I/II | Unknown | Unknown | SD | |
| SEC11C | SNV | Missense_Mutation | novel | c.181A>G | p.Ile61Val | p.I61V | Q9BY50 | protein_coding | tolerated(0.44) | benign(0.023) | TCGA-A5-A0G2-01 | Endometrium | uterine corpus endometrioid carcinoma | Female | <65 | III/IV | Unknown | Unknown | SD |
| SEC11C | SNV | Missense_Mutation | rs766715596 | c.253N>T | p.Arg85Trp | p.R85W | Q9BY50 | protein_coding | deleterious(0.01) | possibly_damaging(0.697) | TCGA-A5-A0VP-01 | Endometrium | uterine corpus endometrioid carcinoma | Female | >=65 | I/II | Unknown | Unknown | SD |
| SEC11C | SNV | Missense_Mutation | novel | c.569N>A | p.Arg190His | p.R190H | Q9BY50 | protein_coding | deleterious(0.03) | benign(0.081) | TCGA-AX-A1CE-01 | Endometrium | uterine corpus endometrioid carcinoma | Female | <65 | I/II | Unspecific | Paclitaxel | SD |
| SEC11C | SNV | Missense_Mutation | novel | c.182T>C | p.Ile61Thr | p.I61T | Q9BY50 | protein_coding | deleterious(0) | possibly_damaging(0.703) | TCGA-DI-A1BU-01 | Endometrium | uterine corpus endometrioid carcinoma | Female | <65 | I/II | Chemotherapy | paclitaxel | SD |
| SEC11C | SNV | Missense_Mutation | novel | c.572N>G | p.Glu191Gly | p.E191G | Q9BY50 | protein_coding | deleterious(0) | possibly_damaging(0.87) | TCGA-EO-A22X-01 | Endometrium | uterine corpus endometrioid carcinoma | Female | <65 | III/IV | Unspecific | Carboplatin | Complete Response |
| SEC11C | SNV | Missense_Mutation | novel | c.569N>A | p.Arg190His | p.R190H | Q9BY50 | protein_coding | deleterious(0.03) | benign(0.081) | TCGA-EY-A1H0-01 | Endometrium | uterine corpus endometrioid carcinoma | Female | <65 | III/IV | Chemotherapy | taxol | SD |
| Page: 1 2 |
Top |
Related drugs of malignant transformation related genes |
| Identification of chemicals and drugs interact with genes involved in malignant transfromation |
| (DGIdb 4.0) |
| Entrez ID | Symbol | Category | Interaction Types | Drug Claim Name | Drug Name | PMIDs |
| Page: 1 |

Copyright 2023-Present -The University of Texas Health Science Center at Houston |