
|
|||||
|
 | |
| |
| |
| |
| |
| |
|
Gene: SEC11A |
Gene summary for SEC11A |
| Gene information | Species | Human | Gene symbol | SEC11A | Gene ID | 23478 |
| Gene name | SEC11 homolog A, signal peptidase complex subunit | |
| Gene Alias | 1810012E07Rik | |
| Cytomap | 15q25.2-q25.3 | |
| Gene Type | protein-coding | GO ID | GO:0006465 | UniProtAcc | P67812 |
Top |
Malignant transformation analysis |
| Identification of the aberrant gene expression in precancerous and cancerous lesions by comparing the gene expression of stem-like cells in diseased tissues with normal stem cells |
| Entrez ID | Symbol | Replicates | Species | Organ | Tissue | Adj P-value | Log2FC | Malignancy |
| 23478 | SEC11A | CA_HPV_1 | Human | Cervix | CC | 1.12e-04 | -2.67e-01 | 0.0264 |
| 23478 | SEC11A | CA_HPV_3 | Human | Cervix | CC | 7.24e-07 | -6.50e-02 | 0.0414 |
| 23478 | SEC11A | N_HPV_2 | Human | Cervix | N_HPV | 1.06e-02 | 1.11e-02 | -0.0131 |
| 23478 | SEC11A | CCI_3 | Human | Cervix | CC | 1.34e-02 | -5.22e-01 | 0.516 |
| 23478 | SEC11A | CCII_1 | Human | Cervix | CC | 4.08e-17 | -7.82e-01 | 0.3249 |
| 23478 | SEC11A | sample3 | Human | Cervix | CC | 3.36e-07 | 3.30e-03 | 0.1387 |
| 23478 | SEC11A | L1 | Human | Cervix | CC | 1.60e-05 | -4.49e-01 | 0.0802 |
| 23478 | SEC11A | T1 | Human | Cervix | CC | 1.29e-04 | -3.89e-01 | 0.0918 |
| 23478 | SEC11A | T3 | Human | Cervix | CC | 3.23e-06 | -6.99e-04 | 0.1389 |
| 23478 | SEC11A | HTA11_347_2000001011 | Human | Colorectum | AD | 2.01e-13 | 5.87e-01 | -0.1954 |
| 23478 | SEC11A | HTA11_99999970781_79442 | Human | Colorectum | MSS | 8.43e-13 | 6.14e-01 | 0.294 |
| 23478 | SEC11A | A001-C-207 | Human | Colorectum | FAP | 3.81e-02 | -2.39e-01 | 0.1278 |
| 23478 | SEC11A | A015-C-203 | Human | Colorectum | FAP | 1.63e-11 | -2.05e-01 | -0.1294 |
| 23478 | SEC11A | A015-C-204 | Human | Colorectum | FAP | 4.20e-03 | -2.50e-01 | -0.0228 |
| 23478 | SEC11A | A002-C-201 | Human | Colorectum | FAP | 5.80e-06 | -2.28e-01 | 0.0324 |
| 23478 | SEC11A | A002-C-203 | Human | Colorectum | FAP | 4.21e-03 | -1.90e-01 | 0.2786 |
| 23478 | SEC11A | A001-C-108 | Human | Colorectum | FAP | 6.58e-09 | -2.11e-01 | -0.0272 |
| 23478 | SEC11A | A002-C-205 | Human | Colorectum | FAP | 1.26e-07 | -1.55e-01 | -0.1236 |
| 23478 | SEC11A | A015-C-006 | Human | Colorectum | FAP | 1.58e-07 | -2.72e-01 | -0.0994 |
| 23478 | SEC11A | A015-C-106 | Human | Colorectum | FAP | 4.55e-05 | -1.69e-01 | -0.0511 |
| Page: 1 2 3 4 5 6 7 8 9 10 11 |
| Tissue | Expression Dynamics | Abbreviation |
| Cervix | 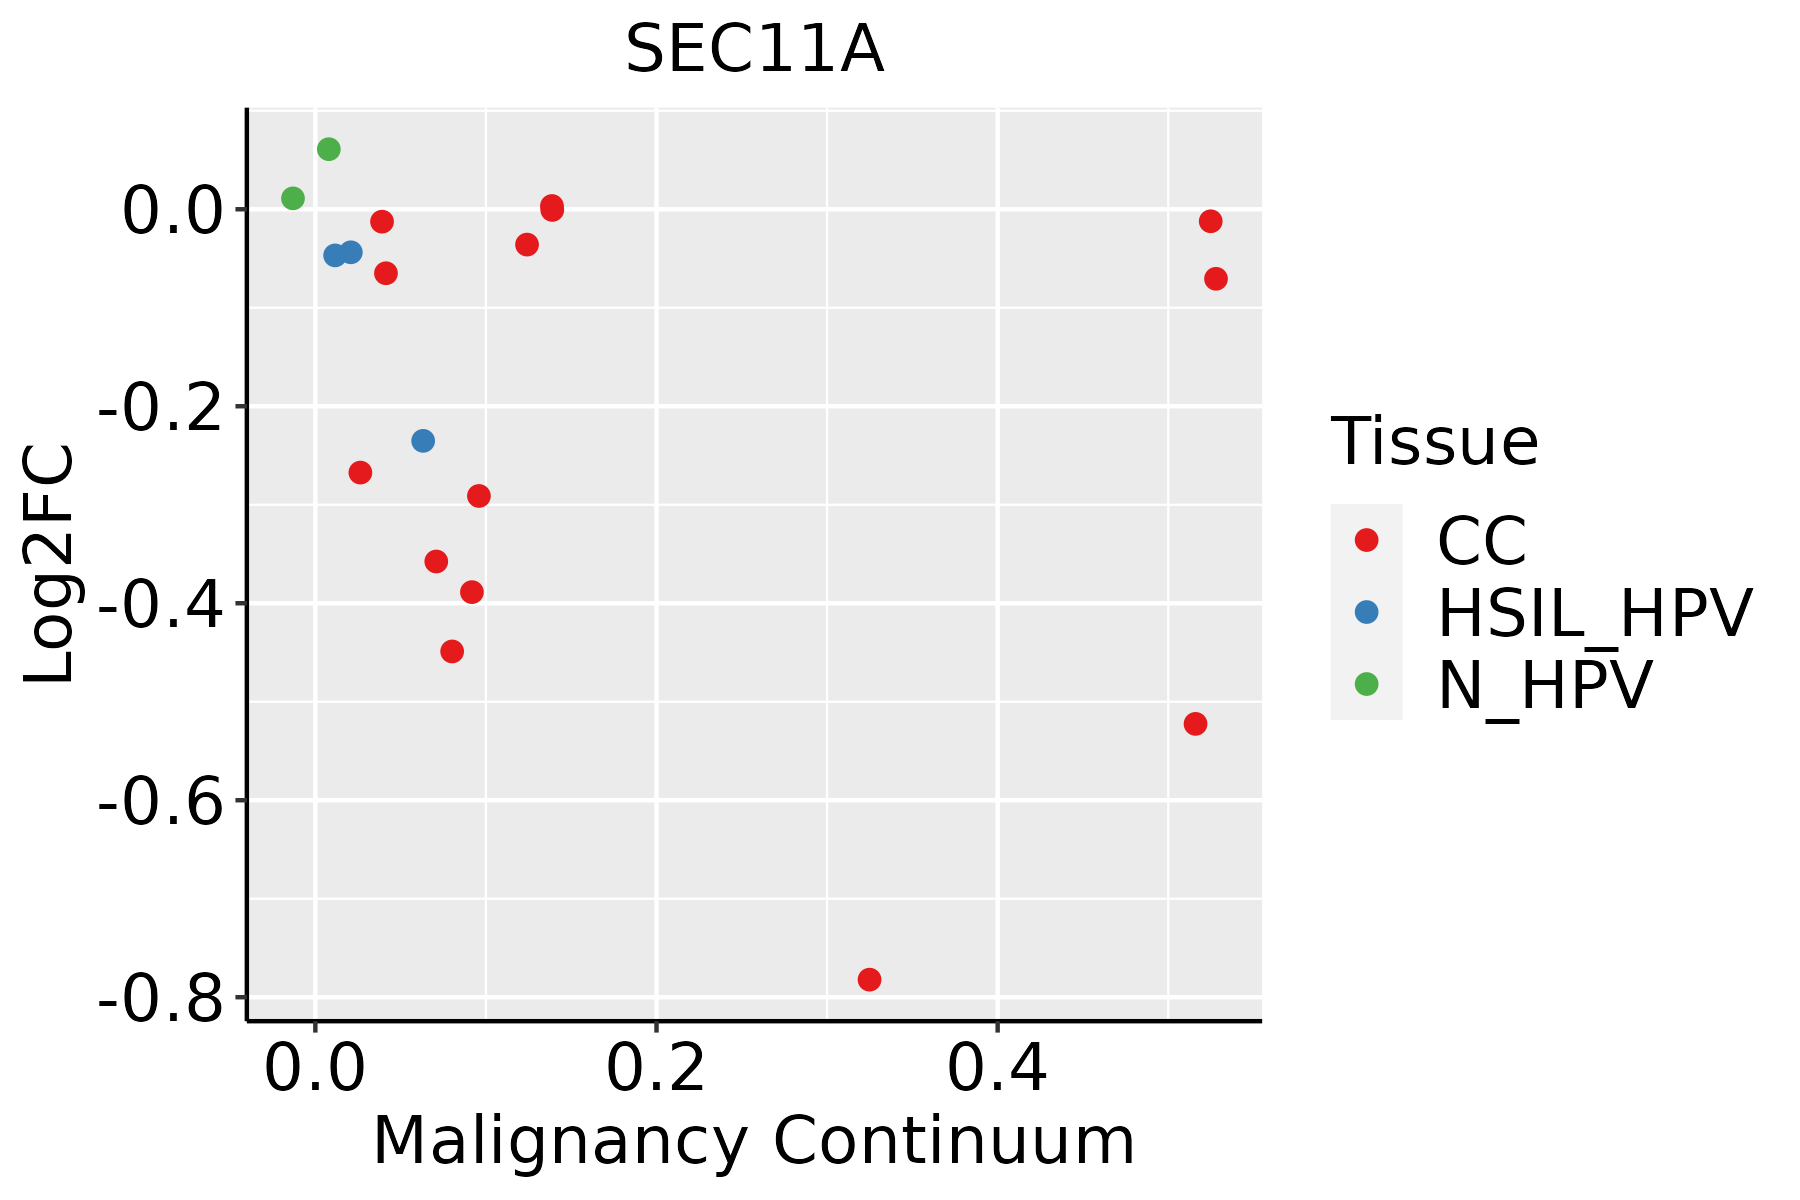 | CC: Cervix cancer |
| HSIL_HPV: HPV-infected high-grade squamous intraepithelial lesions | ||
| N_HPV: HPV-infected normal cervix | ||
| Colorectum (GSE201348) |  | FAP: Familial adenomatous polyposis |
| CRC: Colorectal cancer | ||
| Colorectum (HTA11) |  | AD: Adenomas |
| SER: Sessile serrated lesions | ||
| MSI-H: Microsatellite-high colorectal cancer | ||
| MSS: Microsatellite stable colorectal cancer | ||
| Endometrium |  | AEH: Atypical endometrial hyperplasia |
| EEC: Endometrioid Cancer | ||
| Esophagus | 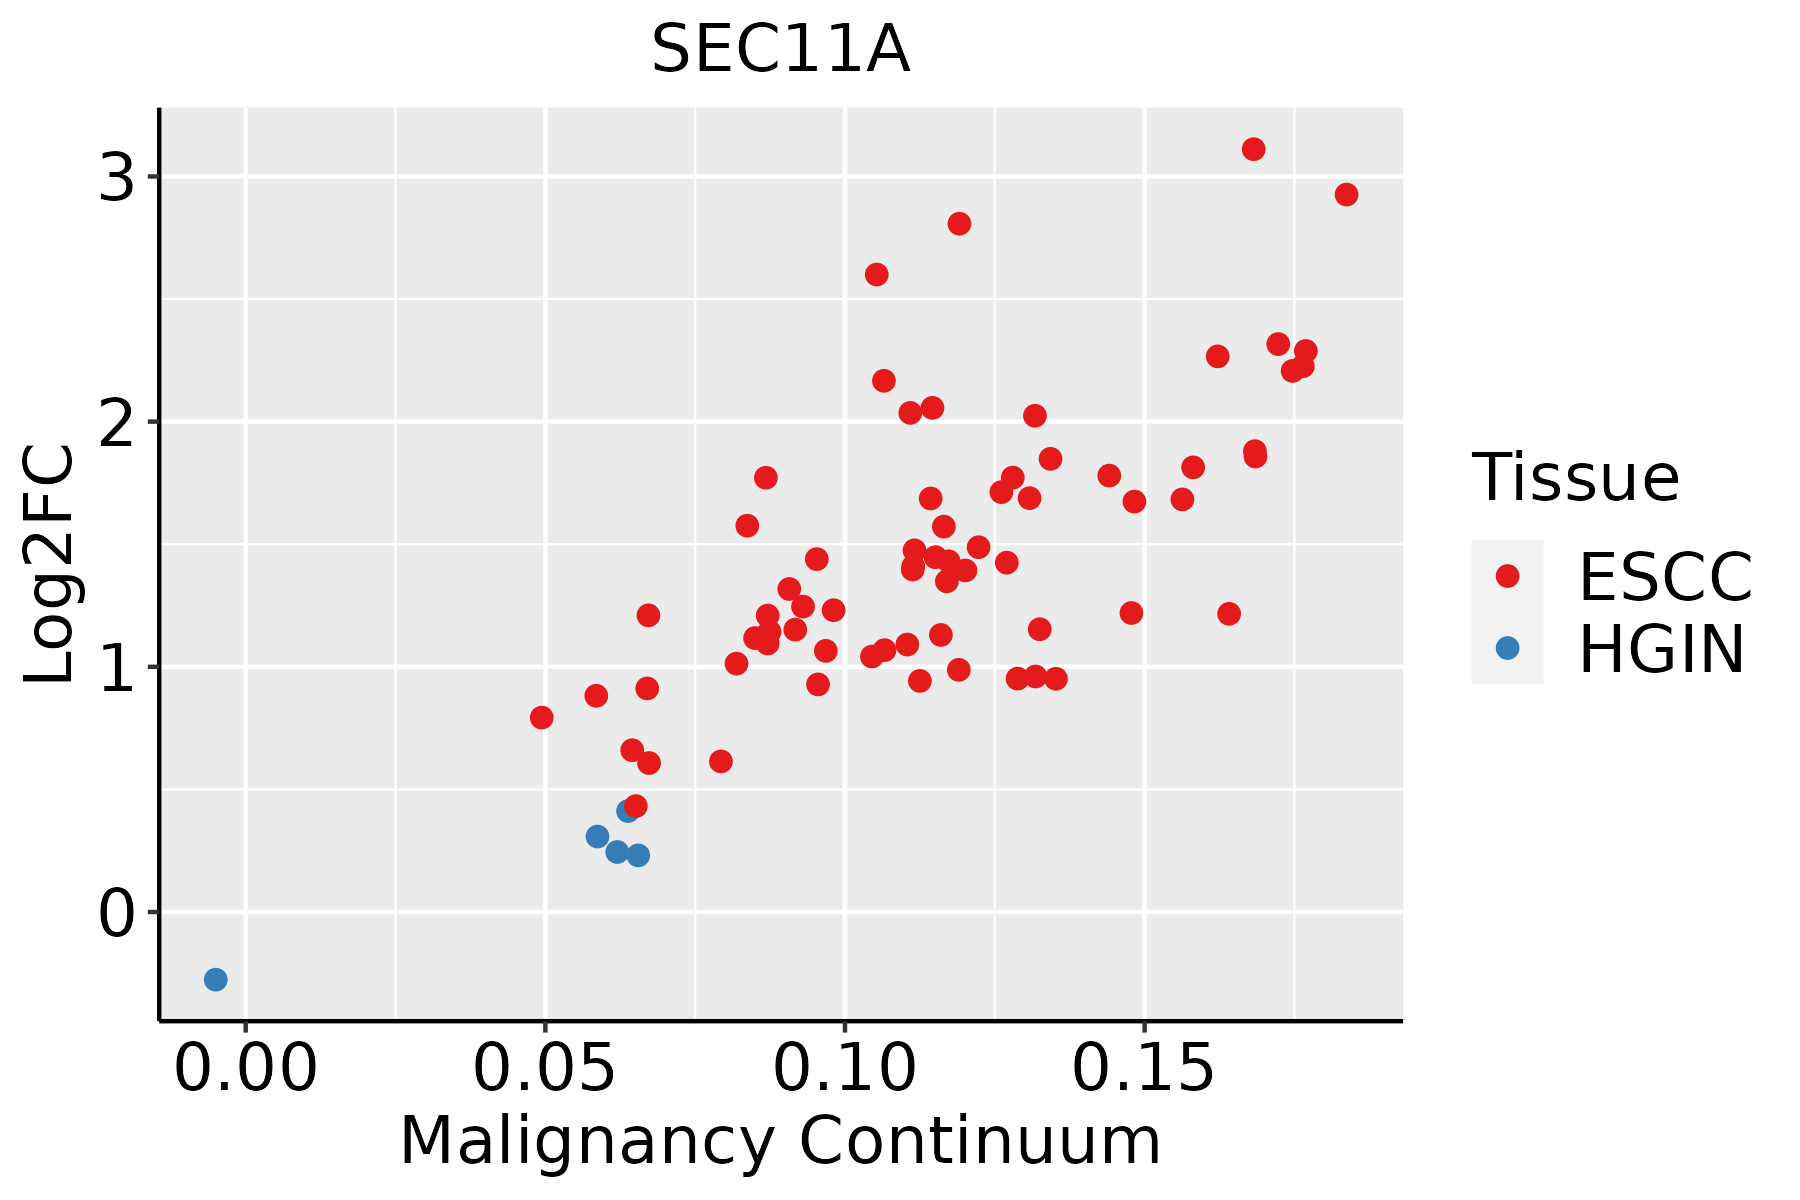 | ESCC: Esophageal squamous cell carcinoma |
| HGIN: High-grade intraepithelial neoplasias | ||
| LGIN: Low-grade intraepithelial neoplasias | ||
| Liver |  | HCC: Hepatocellular carcinoma |
| NAFLD: Non-alcoholic fatty liver disease | ||
| Oral Cavity | 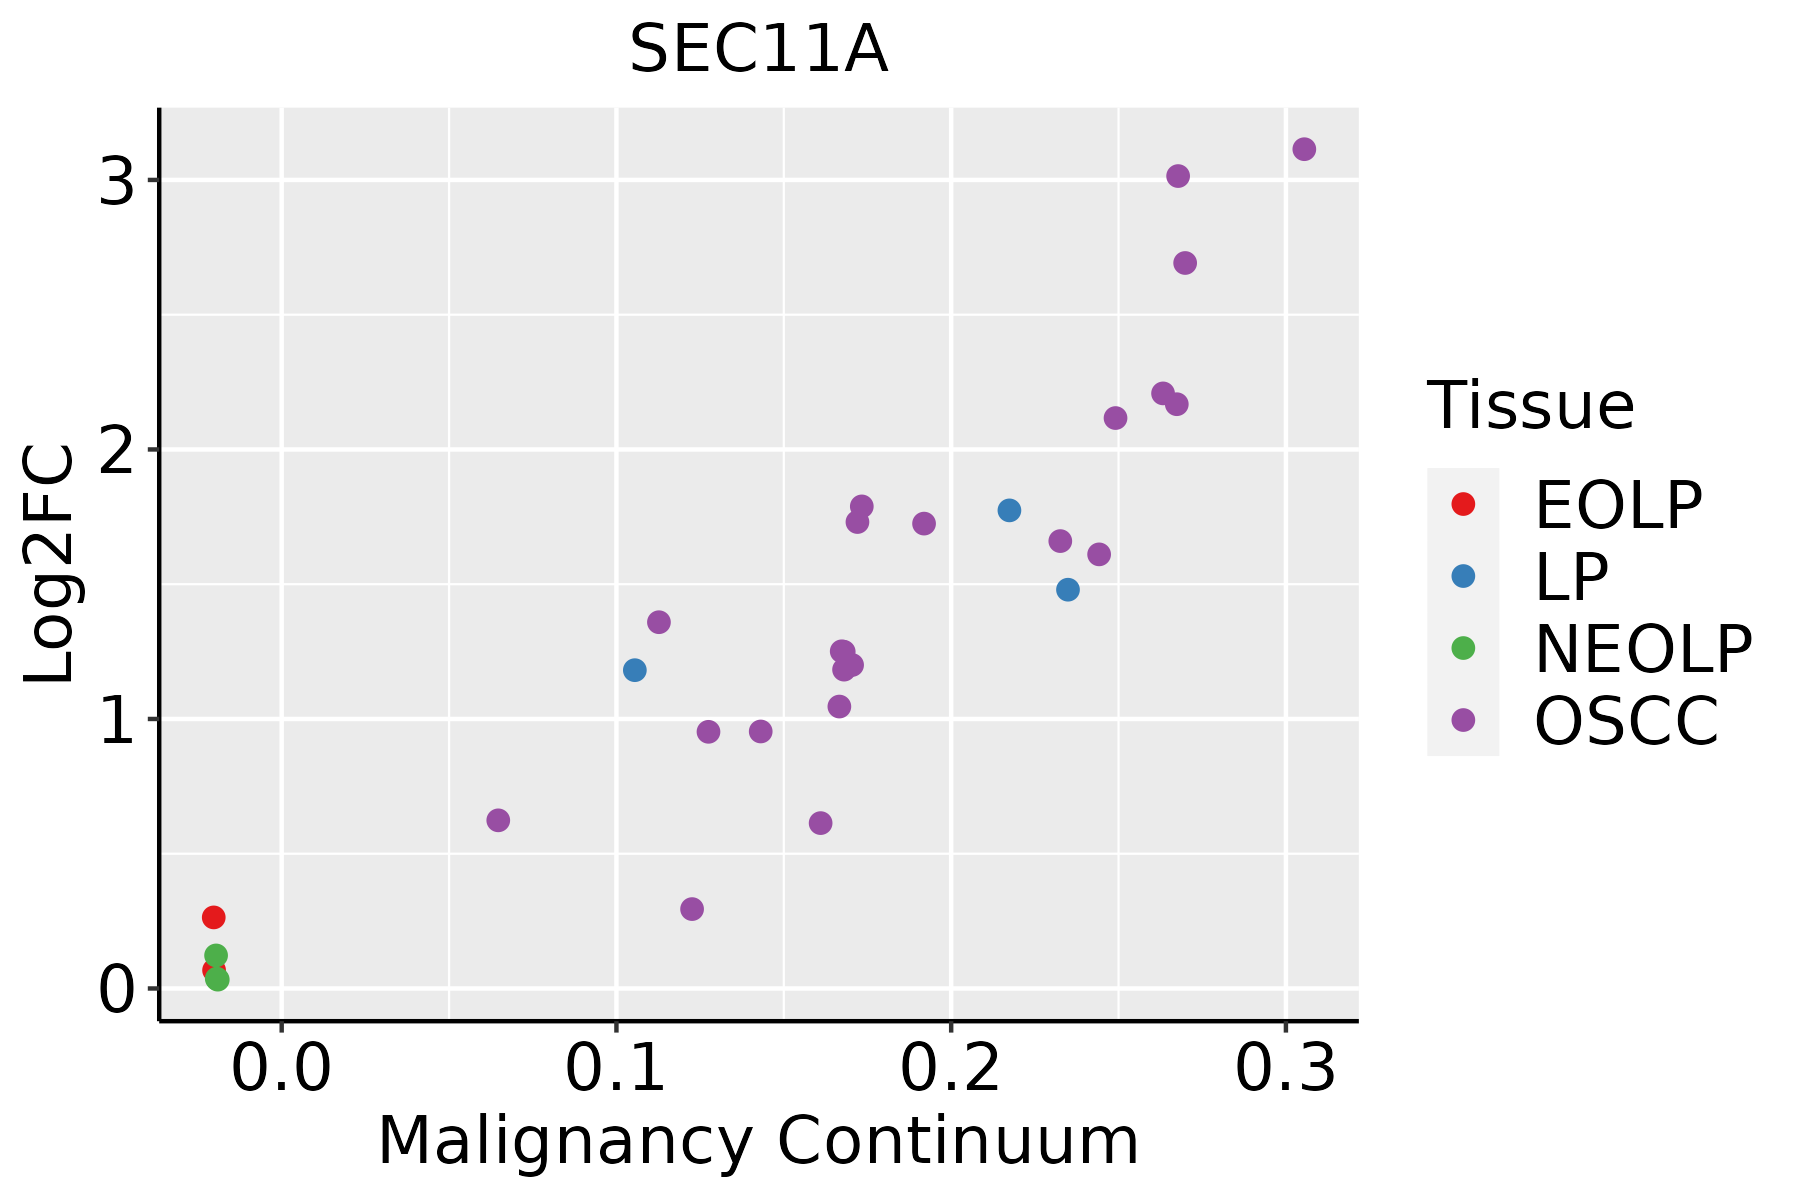 | EOLP: Erosive Oral lichen planus |
| LP: leukoplakia | ||
| NEOLP: Non-erosive oral lichen planus | ||
| OSCC: Oral squamous cell carcinoma | ||
| Prostate | 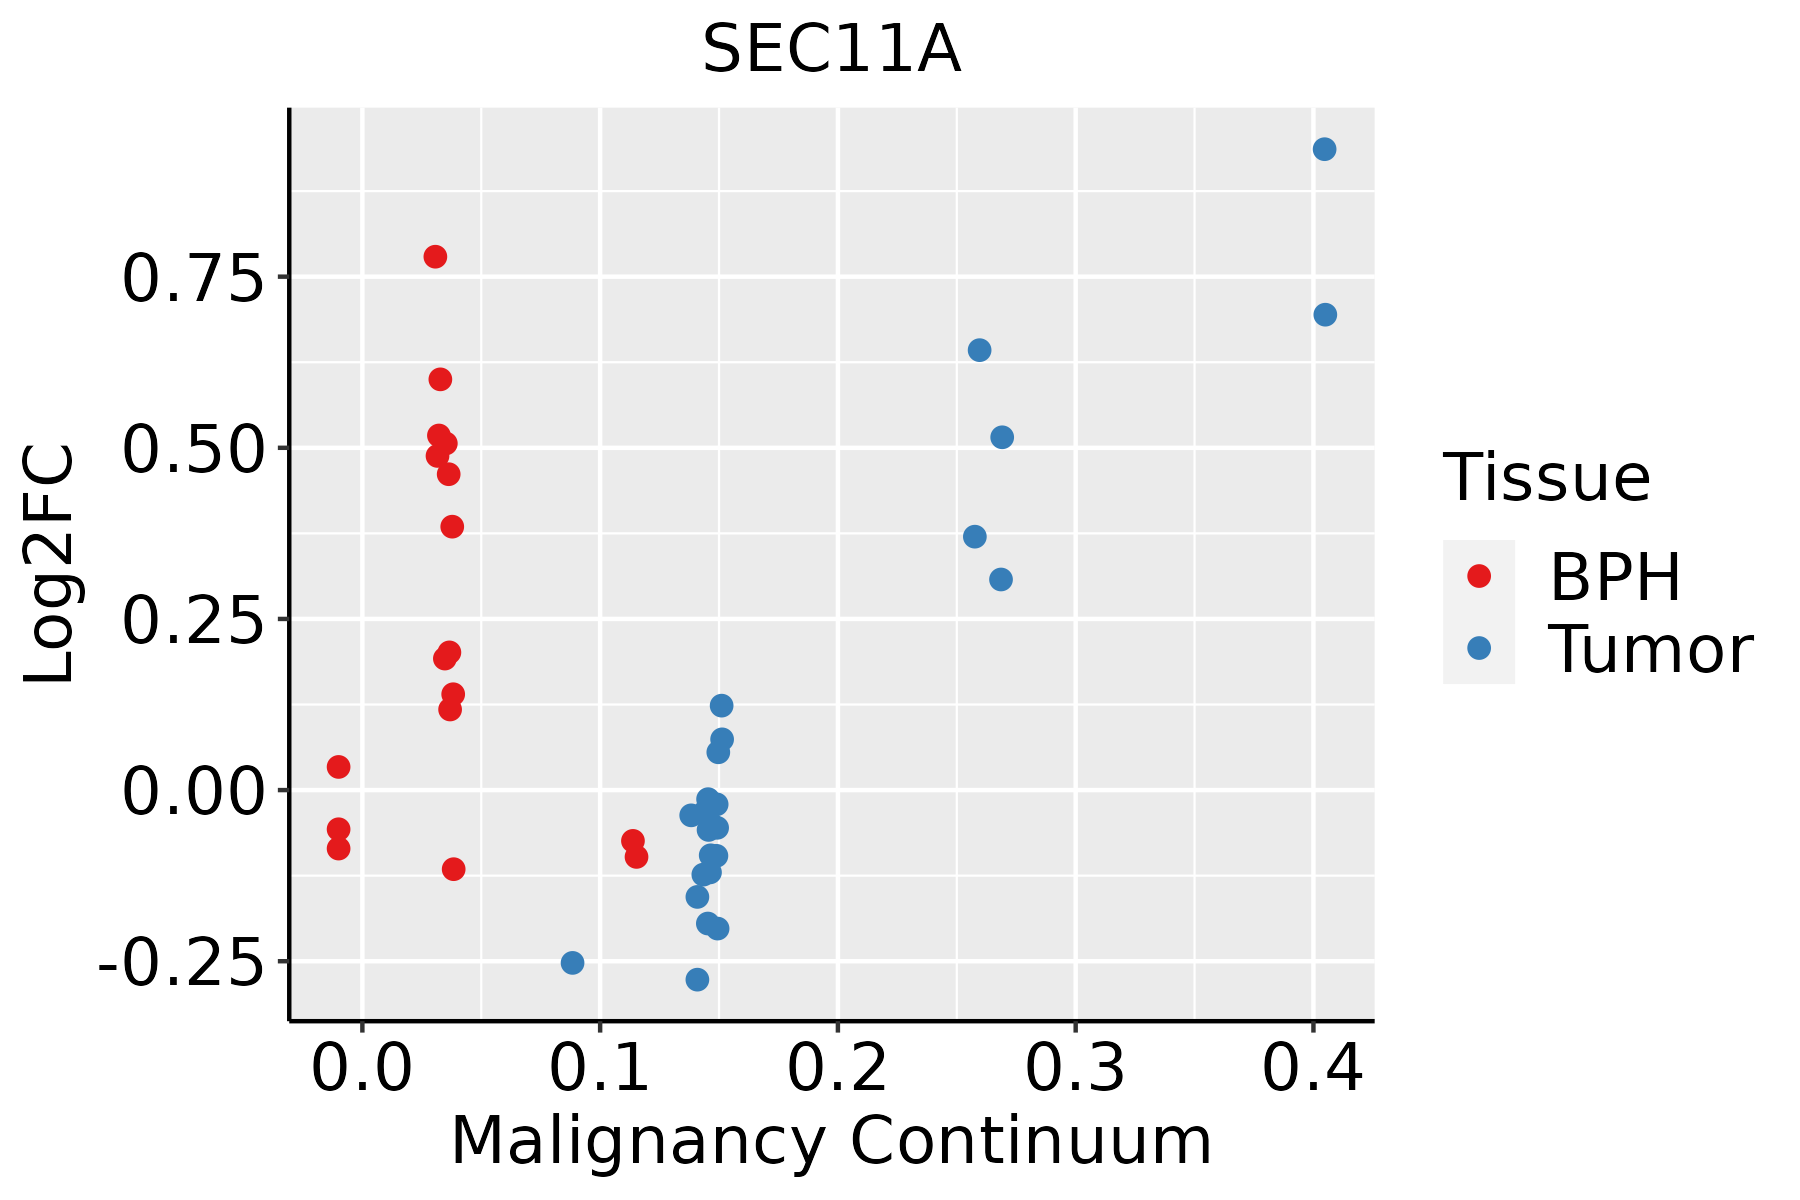 | BPH: Benign Prostatic Hyperplasia |
| Skin | 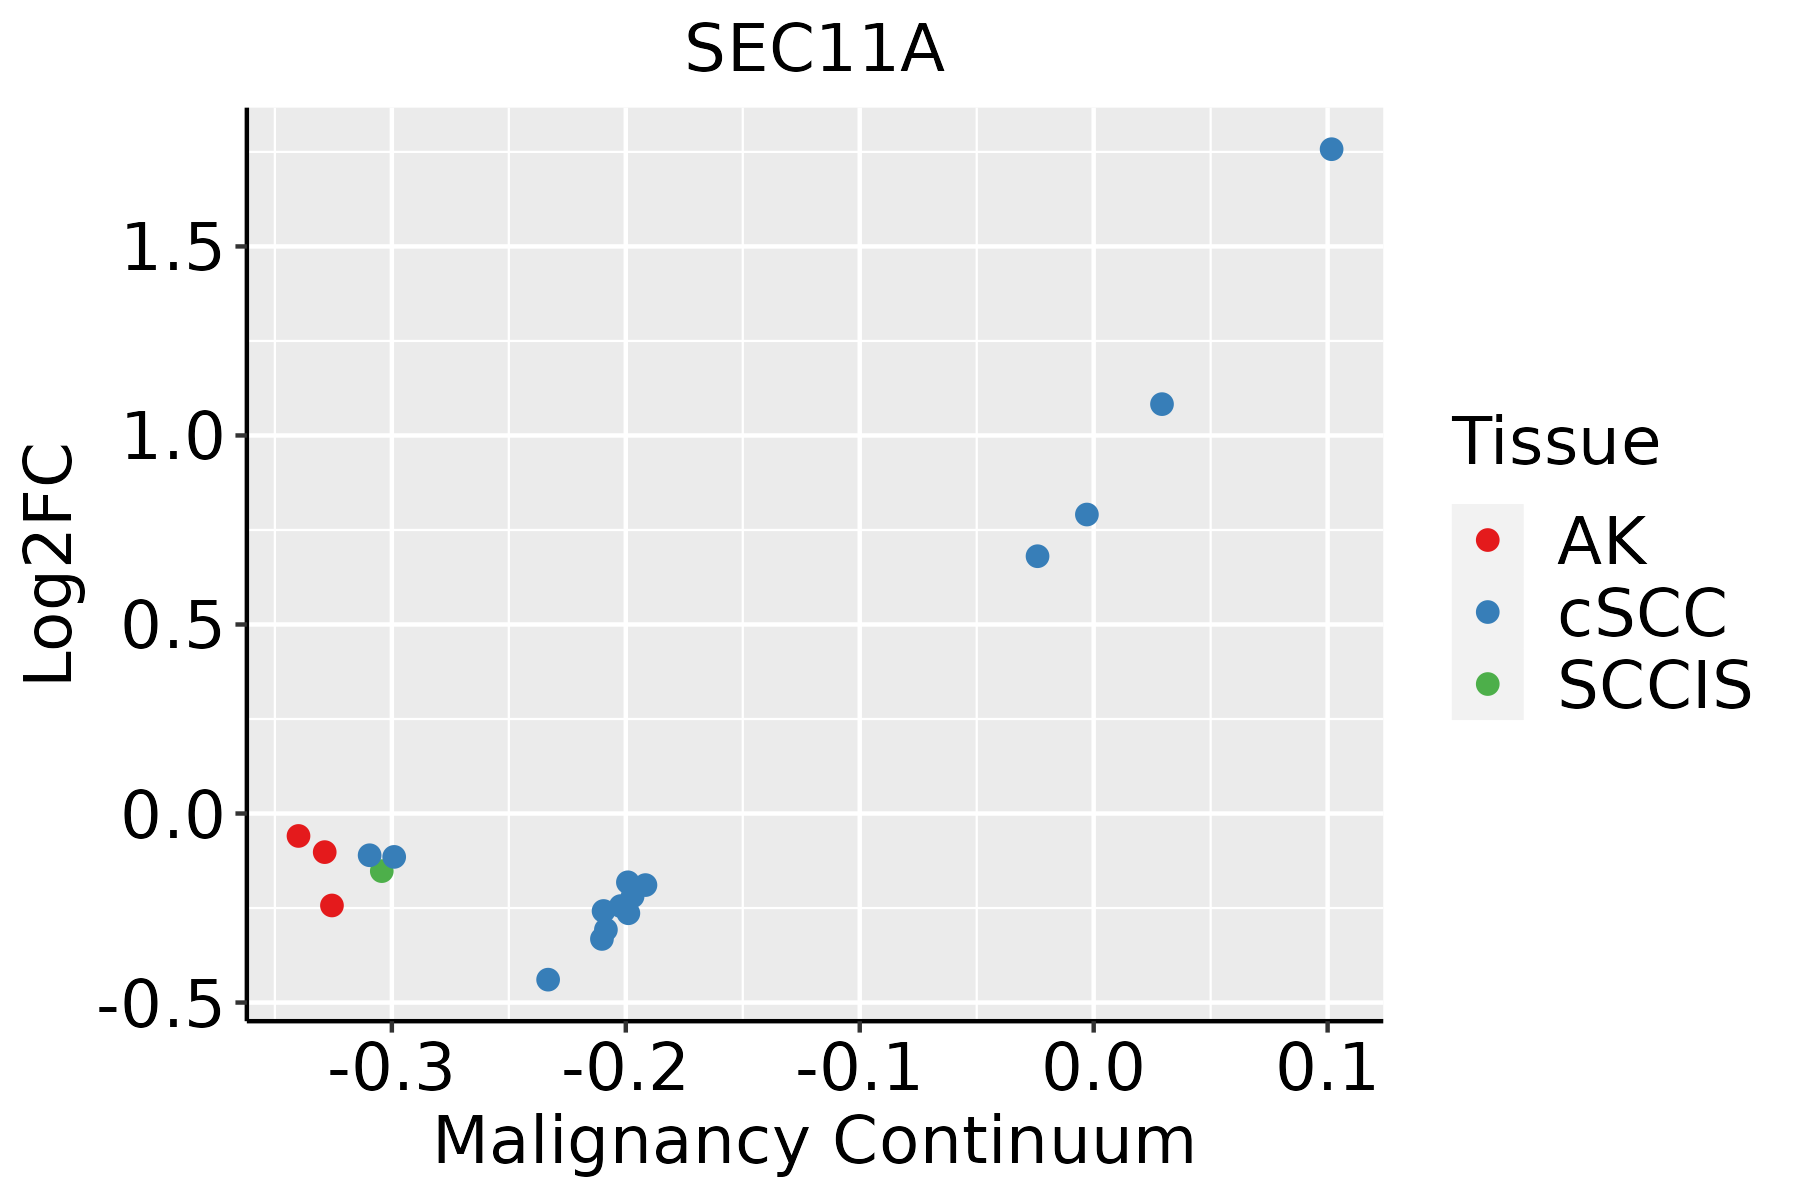 | AK: Actinic keratosis |
| cSCC: Cutaneous squamous cell carcinoma | ||
| SCCIS:squamous cell carcinoma in situ | ||
| Thyroid | 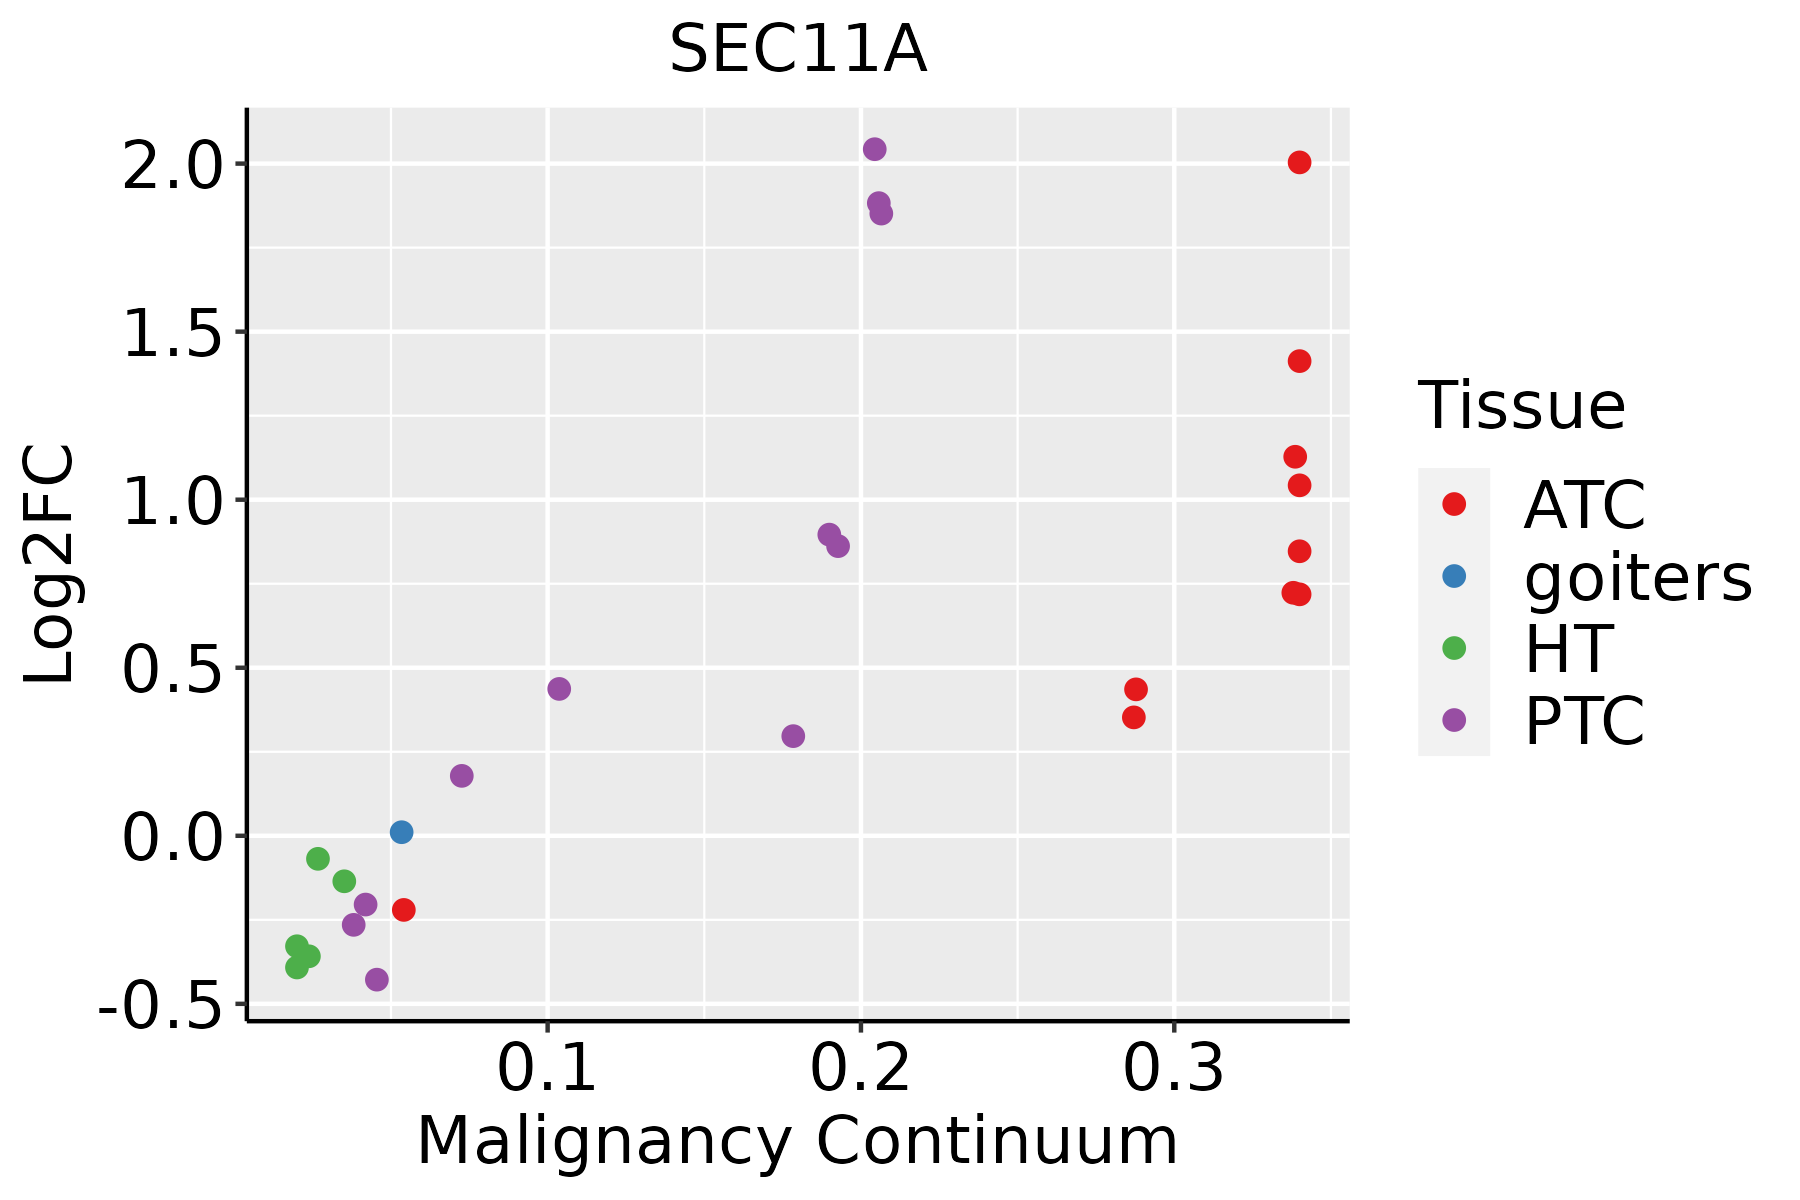 | ATC: Anaplastic thyroid cancer |
| HT: Hashimoto's thyroiditis | ||
| PTC: Papillary thyroid cancer |
| ∗log2FC in expression of this searched gene in stem-like cells from each diseased tissue sample relative to stem-like cells in normal samples in each tissue plotted against the malignancy continuum. Samples are colored based on if they are from different disease stage. |
Top |
Malignant transformation related pathway analysis |
| Find out the enriched GO biological processes and KEGG pathways involved in transition from healthy to precancer to cancer |
| Tissue | Disease Stage | Enriched GO biological Processes |
| Colorectum | AD |  |
| Colorectum | SER |  |
| Colorectum | MSS |  |
| Colorectum | MSI-H |  |
| Colorectum | FAP |  |
| ∗Top 15 enriched GO BP terms are showed in the bar plot of each disease state in each tissue. Each row represents a significant GO biological process which is colored according to the -log10(p.adjust). |
| Page: 1 2 3 4 5 6 7 8 9 |
| GO ID | Tissue | Disease Stage | Description | Gene Ratio | Bg Ratio | pvalue | p.adjust | Count |
| GO:00064657 | Cervix | CC | signal peptide processing | 8/2311 | 14/18723 | 8.01e-05 | 1.09e-03 | 8 |
| GO:00516048 | Cervix | CC | protein maturation | 56/2311 | 294/18723 | 5.90e-04 | 5.59e-03 | 56 |
| GO:005160414 | Cervix | N_HPV | protein maturation | 20/534 | 294/18723 | 3.17e-04 | 4.75e-03 | 20 |
| GO:00164854 | Cervix | N_HPV | protein processing | 15/534 | 225/18723 | 2.09e-03 | 2.00e-02 | 15 |
| GO:000646511 | Cervix | N_HPV | signal peptide processing | 3/534 | 14/18723 | 6.64e-03 | 4.45e-02 | 3 |
| GO:0006465 | Colorectum | AD | signal peptide processing | 10/3918 | 14/18723 | 6.90e-05 | 1.11e-03 | 10 |
| GO:0051604 | Colorectum | AD | protein maturation | 85/3918 | 294/18723 | 6.73e-04 | 6.91e-03 | 85 |
| GO:0016485 | Colorectum | AD | protein processing | 63/3918 | 225/18723 | 6.77e-03 | 4.19e-02 | 63 |
| GO:00064652 | Colorectum | MSS | signal peptide processing | 11/3467 | 14/18723 | 1.81e-06 | 5.70e-05 | 11 |
| GO:00516042 | Colorectum | MSS | protein maturation | 75/3467 | 294/18723 | 1.70e-03 | 1.53e-02 | 75 |
| GO:00164852 | Colorectum | MSS | protein processing | 57/3467 | 225/18723 | 6.60e-03 | 4.38e-02 | 57 |
| GO:00064654 | Colorectum | FAP | signal peptide processing | 6/2622 | 14/18723 | 8.21e-03 | 4.82e-02 | 6 |
| GO:00516044 | Colorectum | CRC | protein maturation | 47/2078 | 294/18723 | 6.52e-03 | 4.70e-02 | 47 |
| GO:00064658 | Endometrium | AEH | signal peptide processing | 6/2100 | 14/18723 | 2.67e-03 | 1.94e-02 | 6 |
| GO:000646512 | Endometrium | EEC | signal peptide processing | 6/2168 | 14/18723 | 3.15e-03 | 2.16e-02 | 6 |
| GO:005160417 | Esophagus | HGIN | protein maturation | 68/2587 | 294/18723 | 9.77e-06 | 2.86e-04 | 68 |
| GO:000646515 | Esophagus | HGIN | signal peptide processing | 8/2587 | 14/18723 | 1.81e-04 | 3.45e-03 | 8 |
| GO:00164857 | Esophagus | HGIN | protein processing | 49/2587 | 225/18723 | 7.04e-04 | 9.52e-03 | 49 |
| GO:005160418 | Esophagus | ESCC | protein maturation | 189/8552 | 294/18723 | 7.64e-11 | 2.39e-09 | 189 |
| GO:001648514 | Esophagus | ESCC | protein processing | 134/8552 | 225/18723 | 1.81e-05 | 1.60e-04 | 134 |
| Page: 1 2 3 |
| Pathway ID | Tissue | Disease Stage | Description | Gene Ratio | Bg Ratio | pvalue | p.adjust | qvalue | Count |
| hsa0306022 | Cervix | N_HPV | Protein export | 5/349 | 23/8465 | 2.11e-03 | 1.27e-02 | 9.96e-03 | 5 |
| hsa0306032 | Cervix | N_HPV | Protein export | 5/349 | 23/8465 | 2.11e-03 | 1.27e-02 | 9.96e-03 | 5 |
| hsa03060 | Colorectum | AD | Protein export | 14/2092 | 23/8465 | 2.43e-04 | 1.90e-03 | 1.21e-03 | 14 |
| hsa030601 | Colorectum | AD | Protein export | 14/2092 | 23/8465 | 2.43e-04 | 1.90e-03 | 1.21e-03 | 14 |
| hsa030602 | Colorectum | MSS | Protein export | 15/1875 | 23/8465 | 1.13e-05 | 1.26e-04 | 7.71e-05 | 15 |
| hsa030603 | Colorectum | MSS | Protein export | 15/1875 | 23/8465 | 1.13e-05 | 1.26e-04 | 7.71e-05 | 15 |
| hsa0306014 | Endometrium | AEH | Protein export | 11/1197 | 23/8465 | 1.14e-04 | 1.06e-03 | 7.73e-04 | 11 |
| hsa0306015 | Endometrium | AEH | Protein export | 11/1197 | 23/8465 | 1.14e-04 | 1.06e-03 | 7.73e-04 | 11 |
| hsa0306023 | Endometrium | EEC | Protein export | 11/1237 | 23/8465 | 1.54e-04 | 1.41e-03 | 1.05e-03 | 11 |
| hsa0306033 | Endometrium | EEC | Protein export | 11/1237 | 23/8465 | 1.54e-04 | 1.41e-03 | 1.05e-03 | 11 |
| hsa0306020 | Esophagus | HGIN | Protein export | 13/1383 | 23/8465 | 1.27e-05 | 1.80e-04 | 1.43e-04 | 13 |
| hsa03060110 | Esophagus | HGIN | Protein export | 13/1383 | 23/8465 | 1.27e-05 | 1.80e-04 | 1.43e-04 | 13 |
| hsa0306026 | Esophagus | ESCC | Protein export | 22/4205 | 23/8465 | 2.43e-06 | 1.43e-05 | 7.32e-06 | 22 |
| hsa0306036 | Esophagus | ESCC | Protein export | 22/4205 | 23/8465 | 2.43e-06 | 1.43e-05 | 7.32e-06 | 22 |
| hsa030608 | Liver | Cirrhotic | Protein export | 20/2530 | 23/8465 | 2.00e-08 | 3.51e-07 | 2.17e-07 | 20 |
| hsa0306011 | Liver | Cirrhotic | Protein export | 20/2530 | 23/8465 | 2.00e-08 | 3.51e-07 | 2.17e-07 | 20 |
| hsa0306021 | Liver | HCC | Protein export | 21/4020 | 23/8465 | 1.20e-05 | 8.53e-05 | 4.74e-05 | 21 |
| hsa0306031 | Liver | HCC | Protein export | 21/4020 | 23/8465 | 1.20e-05 | 8.53e-05 | 4.74e-05 | 21 |
| hsa0306018 | Oral cavity | OSCC | Protein export | 21/3704 | 23/8465 | 2.42e-06 | 1.27e-05 | 6.45e-06 | 21 |
| hsa0306019 | Oral cavity | OSCC | Protein export | 21/3704 | 23/8465 | 2.42e-06 | 1.27e-05 | 6.45e-06 | 21 |
| Page: 1 2 |
Top |
Cell-cell communication analysis |
| Identification of potential cell-cell interactions between two cell types and their ligand-receptor pairs for different disease states |
| Ligand | Receptor | LRpair | Pathway | Tissue | Disease Stage |
| Page: 1 |
Top |
Single-cell gene regulatory network inference analysis |
| Find out the significant the regulons (TFs) and the target genes of each regulon across cell types for different disease states |
| TF | Cell Type | Tissue | Disease Stage | Target Gene | RSS | Regulon Activity |
| ∗The dot plots of a searched regulon are shown for all cell subpopulations in each disease state of each tissue based on the regulon specific score inferred using pySCENIC and by calculating the average expression. |
| Page: 1 |
Top |
Somatic mutation of malignant transformation related genes |
| Annotation of somatic variants for genes involved in malignant transformation |
| Hugo Symbol | Variant Class | Variant Classification | dbSNP RS | HGVSc | HGVSp | HGVSp Short | SWISSPROT | BIOTYPE | SIFT | PolyPhen | Tumor Sample Barcode | Tissue | Histology | Sex | Age | Stage | Therapy Types | Drugs | Outcome |
| SEC11A | SNV | Missense_Mutation | novel | c.361G>C | p.Asp121His | p.D121H | P67812 | protein_coding | deleterious(0.04) | probably_damaging(0.92) | TCGA-HM-A4S6-01 | Cervix | cervical & endocervical cancer | Female | <65 | III/IV | Chemotherapy | cisplatin | CR |
| SEC11A | SNV | Missense_Mutation | novel | c.89N>T | p.Ser30Leu | p.S30L | P67812 | protein_coding | deleterious(0.04) | benign(0.221) | TCGA-VS-A9UJ-01 | Cervix | cervical & endocervical cancer | Female | <65 | I/II | Unknown | Unknown | PD |
| SEC11A | SNV | Missense_Mutation | novel | c.92N>T | p.Ser31Leu | p.S31L | P67812 | protein_coding | deleterious(0) | possibly_damaging(0.671) | TCGA-AJ-A3EL-01 | Endometrium | uterine corpus endometrioid carcinoma | Female | <65 | I/II | Unknown | Unknown | SD |
| SEC11A | SNV | Missense_Mutation | novel | c.223N>A | p.Asp75Asn | p.D75N | P67812 | protein_coding | tolerated(0.06) | benign(0.209) | TCGA-AX-A06F-01 | Endometrium | uterine corpus endometrioid carcinoma | Female | <65 | III/IV | Chemotherapy | carboplatin | SD |
| SEC11A | SNV | Missense_Mutation | novel | c.265N>A | p.Gly89Arg | p.G89R | P67812 | protein_coding | deleterious(0) | probably_damaging(0.972) | TCGA-AX-A2HD-01 | Endometrium | uterine corpus endometrioid carcinoma | Female | >=65 | III/IV | Unknown | Unknown | SD |
| SEC11A | SNV | Missense_Mutation | novel | c.152N>C | p.Val51Ala | p.V51A | P67812 | protein_coding | deleterious(0.01) | possibly_damaging(0.841) | TCGA-B5-A11E-01 | Endometrium | uterine corpus endometrioid carcinoma | Female | <65 | I/II | Unknown | Unknown | SD |
| SEC11A | SNV | Missense_Mutation | novel | c.199N>T | p.Leu67Phe | p.L67F | P67812 | protein_coding | deleterious(0) | probably_damaging(0.928) | TCGA-B5-A11N-01 | Endometrium | uterine corpus endometrioid carcinoma | Female | >=65 | I/II | Unknown | Unknown | SD |
| SEC11A | SNV | Missense_Mutation | novel | c.94N>A | p.Ala32Thr | p.A32T | P67812 | protein_coding | deleterious(0.03) | possibly_damaging(0.779) | TCGA-B5-A1MR-01 | Endometrium | uterine corpus endometrioid carcinoma | Female | >=65 | III/IV | Unknown | Unknown | SD |
| SEC11A | SNV | Missense_Mutation | novel | c.290N>T | p.Arg97Leu | p.R97L | P67812 | protein_coding | deleterious(0) | probably_damaging(0.997) | TCGA-BG-A0VW-01 | Endometrium | uterine corpus endometrioid carcinoma | Female | >=65 | I/II | Unknown | Unknown | SD |
| SEC11A | SNV | Missense_Mutation | novel | c.402N>T | p.Glu134Asp | p.E134D | P67812 | protein_coding | tolerated(0.2) | benign(0.029) | TCGA-EO-A3AV-01 | Endometrium | uterine corpus endometrioid carcinoma | Female | <65 | III/IV | Chemotherapy | carboplatin | CR |
| Page: 1 2 |
Top |
Related drugs of malignant transformation related genes |
| Identification of chemicals and drugs interact with genes involved in malignant transfromation |
| (DGIdb 4.0) |
| Entrez ID | Symbol | Category | Interaction Types | Drug Claim Name | Drug Name | PMIDs |
| Page: 1 |

Copyright 2023-Present -The University of Texas Health Science Center at Houston |