
|
|||||
|
 | |
| |
| |
| |
| |
| |
|
Gene: SDS |
Gene summary for SDS |
| Gene information | Species | Human | Gene symbol | SDS | Gene ID | 10993 |
| Gene name | serine dehydratase | |
| Gene Alias | SDH | |
| Cytomap | 12q24.13 | |
| Gene Type | protein-coding | GO ID | GO:0005975 | UniProtAcc | P20132 |
Top |
Malignant transformation analysis |
| Identification of the aberrant gene expression in precancerous and cancerous lesions by comparing the gene expression of stem-like cells in diseased tissues with normal stem cells |
| Entrez ID | Symbol | Replicates | Species | Organ | Tissue | Adj P-value | Log2FC | Malignancy |
| 10993 | SDS | NAFLD1 | Human | Liver | NAFLD | 1.62e-12 | 1.29e+00 | -0.04 |
| 10993 | SDS | S41 | Human | Liver | Cirrhotic | 6.65e-07 | 8.60e-01 | -0.0343 |
| 10993 | SDS | HCC1_Meng | Human | Liver | HCC | 4.17e-04 | -1.08e-01 | 0.0246 |
| 10993 | SDS | HCC2_Meng | Human | Liver | HCC | 2.19e-02 | -1.44e-01 | 0.0107 |
| 10993 | SDS | Pt13.a | Human | Liver | HCC | 4.30e-14 | 4.39e-01 | 0.021 |
| 10993 | SDS | Pt13.b | Human | Liver | HCC | 4.65e-17 | 3.62e-01 | 0.0251 |
| Page: 1 |
| Tissue | Expression Dynamics | Abbreviation |
| Liver | 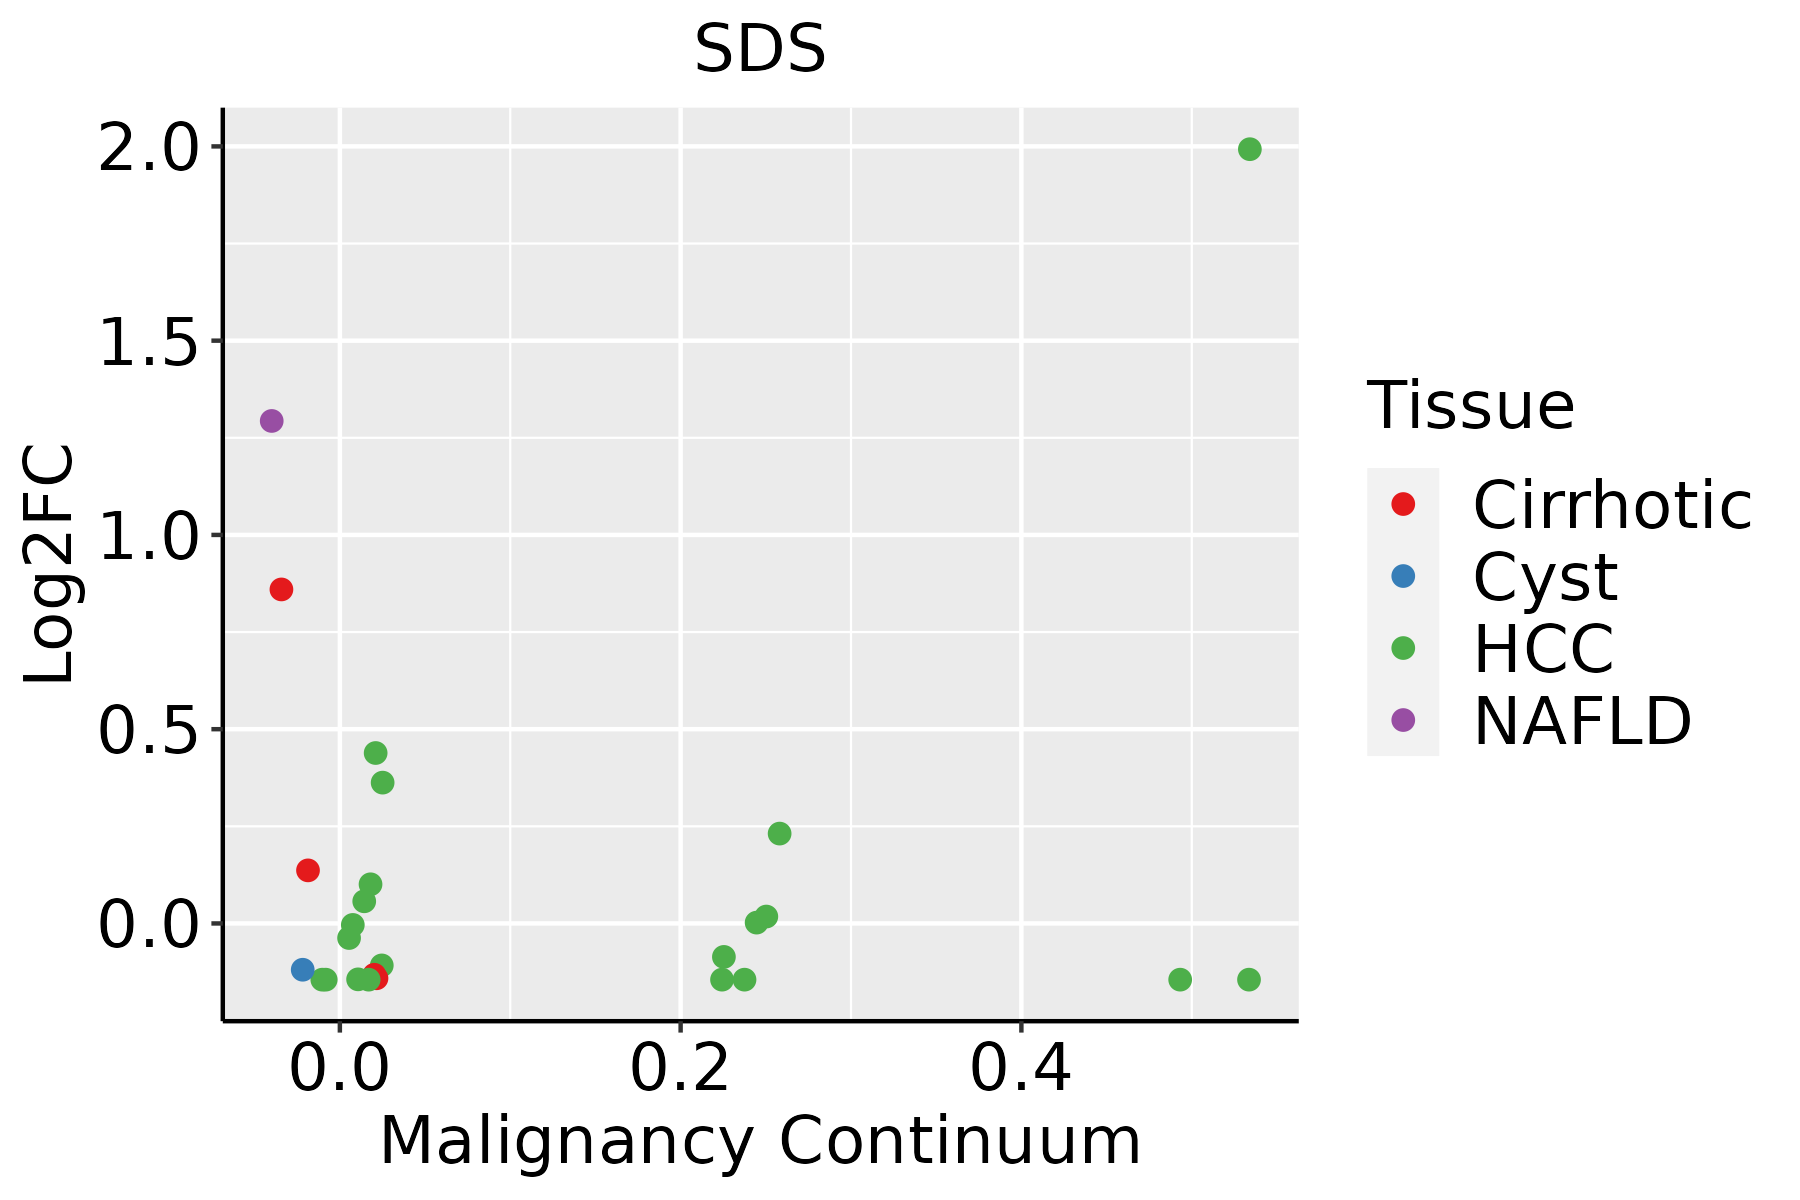 | HCC: Hepatocellular carcinoma |
| NAFLD: Non-alcoholic fatty liver disease |
| ∗log2FC in expression of this searched gene in stem-like cells from each diseased tissue sample relative to stem-like cells in normal samples in each tissue plotted against the malignancy continuum. Samples are colored based on if they are from different disease stage. |
Top |
Malignant transformation related pathway analysis |
| Find out the enriched GO biological processes and KEGG pathways involved in transition from healthy to precancer to cancer |
| Tissue | Disease Stage | Enriched GO biological Processes |
| Colorectum | AD |  |
| Colorectum | SER |  |
| Colorectum | MSS |  |
| Colorectum | MSI-H |  |
| Colorectum | FAP |  |
| ∗Top 15 enriched GO BP terms are showed in the bar plot of each disease state in each tissue. Each row represents a significant GO biological process which is colored according to the -log10(p.adjust). |
| Page: 1 2 3 4 5 6 7 8 9 |
| GO ID | Tissue | Disease Stage | Description | Gene Ratio | Bg Ratio | pvalue | p.adjust | Count |
| GO:00463953 | Liver | NAFLD | carboxylic acid catabolic process | 73/1882 | 236/18723 | 4.16e-19 | 1.22e-15 | 73 |
| GO:00160544 | Liver | NAFLD | organic acid catabolic process | 73/1882 | 240/18723 | 1.20e-18 | 2.34e-15 | 73 |
| GO:00442825 | Liver | NAFLD | small molecule catabolic process | 91/1882 | 376/18723 | 8.96e-16 | 1.31e-12 | 91 |
| GO:00160535 | Liver | NAFLD | organic acid biosynthetic process | 77/1882 | 316/18723 | 1.03e-13 | 6.69e-11 | 77 |
| GO:00463945 | Liver | NAFLD | carboxylic acid biosynthetic process | 75/1882 | 314/18723 | 6.37e-13 | 3.39e-10 | 75 |
| GO:0009063 | Liver | NAFLD | cellular amino acid catabolic process | 36/1882 | 110/18723 | 6.56e-11 | 1.99e-08 | 36 |
| GO:00065203 | Liver | NAFLD | cellular amino acid metabolic process | 63/1882 | 284/18723 | 1.14e-09 | 2.17e-07 | 63 |
| GO:00086523 | Liver | NAFLD | cellular amino acid biosynthetic process | 26/1882 | 76/18723 | 1.00e-08 | 1.33e-06 | 26 |
| GO:19016053 | Liver | NAFLD | alpha-amino acid metabolic process | 46/1882 | 195/18723 | 2.74e-08 | 2.86e-06 | 46 |
| GO:00059965 | Liver | NAFLD | monosaccharide metabolic process | 53/1882 | 257/18723 | 2.89e-07 | 1.92e-05 | 53 |
| GO:19016073 | Liver | NAFLD | alpha-amino acid biosynthetic process | 22/1882 | 68/18723 | 4.13e-07 | 2.62e-05 | 22 |
| GO:00723303 | Liver | NAFLD | monocarboxylic acid biosynthetic process | 46/1882 | 214/18723 | 5.06e-07 | 3.07e-05 | 46 |
| GO:00193185 | Liver | NAFLD | hexose metabolic process | 49/1882 | 237/18723 | 7.41e-07 | 4.12e-05 | 49 |
| GO:1901606 | Liver | NAFLD | alpha-amino acid catabolic process | 25/1882 | 87/18723 | 8.67e-07 | 4.60e-05 | 25 |
| GO:0016051 | Liver | NAFLD | carbohydrate biosynthetic process | 43/1882 | 202/18723 | 1.55e-06 | 6.96e-05 | 43 |
| GO:00060065 | Liver | NAFLD | glucose metabolic process | 42/1882 | 196/18723 | 1.70e-06 | 7.47e-05 | 42 |
| GO:00060907 | Liver | NAFLD | pyruvate metabolic process | 26/1882 | 106/18723 | 1.31e-05 | 3.93e-04 | 26 |
| GO:0046364 | Liver | NAFLD | monosaccharide biosynthetic process | 22/1882 | 82/18723 | 1.31e-05 | 3.93e-04 | 22 |
| GO:0019319 | Liver | NAFLD | hexose biosynthetic process | 21/1882 | 78/18723 | 1.93e-05 | 5.52e-04 | 21 |
| GO:0006094 | Liver | NAFLD | gluconeogenesis | 20/1882 | 75/18723 | 3.52e-05 | 8.95e-04 | 20 |
| Page: 1 2 3 4 |
| Pathway ID | Tissue | Disease Stage | Description | Gene Ratio | Bg Ratio | pvalue | p.adjust | qvalue | Count |
| hsa0120010 | Liver | NAFLD | Carbon metabolism | 26/1043 | 115/8465 | 1.39e-03 | 1.71e-02 | 1.38e-02 | 26 |
| hsa0120011 | Liver | NAFLD | Carbon metabolism | 26/1043 | 115/8465 | 1.39e-03 | 1.71e-02 | 1.38e-02 | 26 |
| hsa0120021 | Liver | Cirrhotic | Carbon metabolism | 64/2530 | 115/8465 | 6.37e-09 | 1.18e-07 | 7.26e-08 | 64 |
| hsa00270 | Liver | Cirrhotic | Cysteine and methionine metabolism | 27/2530 | 52/8465 | 6.98e-04 | 4.15e-03 | 2.56e-03 | 27 |
| hsa00260 | Liver | Cirrhotic | Glycine, serine and threonine metabolism | 22/2530 | 40/8465 | 7.85e-04 | 4.51e-03 | 2.78e-03 | 22 |
| hsa012304 | Liver | Cirrhotic | Biosynthesis of amino acids | 35/2530 | 75/8465 | 1.54e-03 | 7.83e-03 | 4.83e-03 | 35 |
| hsa0120031 | Liver | Cirrhotic | Carbon metabolism | 64/2530 | 115/8465 | 6.37e-09 | 1.18e-07 | 7.26e-08 | 64 |
| hsa002701 | Liver | Cirrhotic | Cysteine and methionine metabolism | 27/2530 | 52/8465 | 6.98e-04 | 4.15e-03 | 2.56e-03 | 27 |
| hsa002601 | Liver | Cirrhotic | Glycine, serine and threonine metabolism | 22/2530 | 40/8465 | 7.85e-04 | 4.51e-03 | 2.78e-03 | 22 |
| hsa0123011 | Liver | Cirrhotic | Biosynthesis of amino acids | 35/2530 | 75/8465 | 1.54e-03 | 7.83e-03 | 4.83e-03 | 35 |
| hsa0120041 | Liver | HCC | Carbon metabolism | 89/4020 | 115/8465 | 3.92e-11 | 6.56e-10 | 3.65e-10 | 89 |
| hsa0123021 | Liver | HCC | Biosynthesis of amino acids | 53/4020 | 75/8465 | 3.79e-05 | 2.11e-04 | 1.18e-04 | 53 |
| hsa002702 | Liver | HCC | Cysteine and methionine metabolism | 35/4020 | 52/8465 | 3.03e-03 | 9.94e-03 | 5.53e-03 | 35 |
| hsa002602 | Liver | HCC | Glycine, serine and threonine metabolism | 28/4020 | 40/8465 | 3.28e-03 | 1.07e-02 | 5.93e-03 | 28 |
| hsa0120051 | Liver | HCC | Carbon metabolism | 89/4020 | 115/8465 | 3.92e-11 | 6.56e-10 | 3.65e-10 | 89 |
| hsa0123031 | Liver | HCC | Biosynthesis of amino acids | 53/4020 | 75/8465 | 3.79e-05 | 2.11e-04 | 1.18e-04 | 53 |
| hsa002703 | Liver | HCC | Cysteine and methionine metabolism | 35/4020 | 52/8465 | 3.03e-03 | 9.94e-03 | 5.53e-03 | 35 |
| hsa002603 | Liver | HCC | Glycine, serine and threonine metabolism | 28/4020 | 40/8465 | 3.28e-03 | 1.07e-02 | 5.93e-03 | 28 |
| Page: 1 |
Top |
Cell-cell communication analysis |
| Identification of potential cell-cell interactions between two cell types and their ligand-receptor pairs for different disease states |
| Ligand | Receptor | LRpair | Pathway | Tissue | Disease Stage |
| Page: 1 |
Top |
Single-cell gene regulatory network inference analysis |
| Find out the significant the regulons (TFs) and the target genes of each regulon across cell types for different disease states |
| TF | Cell Type | Tissue | Disease Stage | Target Gene | RSS | Regulon Activity |
| ∗The dot plots of a searched regulon are shown for all cell subpopulations in each disease state of each tissue based on the regulon specific score inferred using pySCENIC and by calculating the average expression. |
| Page: 1 |
Top |
Somatic mutation of malignant transformation related genes |
| Annotation of somatic variants for genes involved in malignant transformation |
| Hugo Symbol | Variant Class | Variant Classification | dbSNP RS | HGVSc | HGVSp | HGVSp Short | SWISSPROT | BIOTYPE | SIFT | PolyPhen | Tumor Sample Barcode | Tissue | Histology | Sex | Age | Stage | Therapy Types | Drugs | Outcome |
| SDS | SNV | Missense_Mutation | c.423N>G | p.Ile141Met | p.I141M | P20132 | protein_coding | deleterious(0) | possibly_damaging(0.774) | TCGA-IR-A3LA-01 | Cervix | cervical & endocervical cancer | Female | <65 | I/II | Chemotherapy | cisplatin | CR | |
| SDS | SNV | Missense_Mutation | c.568N>A | p.Val190Ile | p.V190I | P20132 | protein_coding | tolerated(1) | benign(0.006) | TCGA-AA-A01R-01 | Colorectum | colon adenocarcinoma | Male | <65 | III/IV | Chemotherapy | 5-fluorouracil | PD | |
| SDS | SNV | Missense_Mutation | rs1050062 | c.688G>A | p.Ala230Thr | p.A230T | P20132 | protein_coding | tolerated(0.21) | benign(0.078) | TCGA-CK-4951-01 | Colorectum | colon adenocarcinoma | Female | >=65 | I/II | Unknown | Unknown | PD |
| SDS | SNV | Missense_Mutation | rs372154433 | c.436N>A | p.Ala146Thr | p.A146T | P20132 | protein_coding | tolerated(0.3) | benign(0.005) | TCGA-CK-6746-01 | Colorectum | colon adenocarcinoma | Female | >=65 | I/II | Unknown | Unknown | SD |
| SDS | SNV | Missense_Mutation | c.311C>T | p.Ala104Val | p.A104V | P20132 | protein_coding | deleterious(0) | probably_damaging(0.996) | TCGA-D5-6930-01 | Colorectum | colon adenocarcinoma | Male | >=65 | I/II | Unknown | Unknown | SD | |
| SDS | SNV | Missense_Mutation | novel | c.602T>C | p.Phe201Ser | p.F201S | P20132 | protein_coding | deleterious(0.03) | probably_damaging(0.986) | TCGA-G4-6302-01 | Colorectum | colon adenocarcinoma | Female | >=65 | I/II | Unknown | Unknown | SD |
| SDS | SNV | Missense_Mutation | novel | c.944C>T | p.Ala315Val | p.A315V | P20132 | protein_coding | tolerated(0.24) | benign(0) | TCGA-A5-A0G2-01 | Endometrium | uterine corpus endometrioid carcinoma | Female | <65 | III/IV | Unknown | Unknown | SD |
| SDS | SNV | Missense_Mutation | novel | c.979N>T | p.Pro327Ser | p.P327S | P20132 | protein_coding | tolerated_low_confidence(0.12) | benign(0) | TCGA-AP-A1DK-01 | Endometrium | uterine corpus endometrioid carcinoma | Female | <65 | I/II | Unknown | Unknown | SD |
| SDS | SNV | Missense_Mutation | rs375713569 | c.292N>T | p.Arg98Cys | p.R98C | P20132 | protein_coding | deleterious(0.01) | probably_damaging(0.97) | TCGA-AP-A1DK-01 | Endometrium | uterine corpus endometrioid carcinoma | Female | <65 | I/II | Unknown | Unknown | SD |
| SDS | SNV | Missense_Mutation | novel | c.749A>G | p.Glu250Gly | p.E250G | P20132 | protein_coding | deleterious(0.02) | possibly_damaging(0.753) | TCGA-AX-A06F-01 | Endometrium | uterine corpus endometrioid carcinoma | Female | <65 | III/IV | Chemotherapy | carboplatin | SD |
| Page: 1 2 3 4 |
Top |
Related drugs of malignant transformation related genes |
| Identification of chemicals and drugs interact with genes involved in malignant transfromation |
| (DGIdb 4.0) |
| Entrez ID | Symbol | Category | Interaction Types | Drug Claim Name | Drug Name | PMIDs |
| 10993 | SDS | ENZYME | DEXAMETHASONE | DEXAMETHASONE | 12210718 |
| Page: 1 |

Copyright 2023-Present -The University of Texas Health Science Center at Houston |