
|
|||||
|
 | |
| |
| |
| |
| |
| |
|
Gene: SDR39U1 |
Gene summary for SDR39U1 |
| Gene information | Species | Human | Gene symbol | SDR39U1 | Gene ID | 56948 |
| Gene name | short chain dehydrogenase/reductase family 39U member 1 | |
| Gene Alias | C14orf124 | |
| Cytomap | 14q12 | |
| Gene Type | protein-coding | GO ID | GO:0005575 | UniProtAcc | F6RWC2 |
Top |
Malignant transformation analysis |
| Identification of the aberrant gene expression in precancerous and cancerous lesions by comparing the gene expression of stem-like cells in diseased tissues with normal stem cells |
| Entrez ID | Symbol | Replicates | Species | Organ | Tissue | Adj P-value | Log2FC | Malignancy |
| 56948 | SDR39U1 | LZE2T | Human | Esophagus | ESCC | 3.81e-02 | 4.15e-01 | 0.082 |
| 56948 | SDR39U1 | LZE4T | Human | Esophagus | ESCC | 2.50e-12 | 3.91e-01 | 0.0811 |
| 56948 | SDR39U1 | LZE5T | Human | Esophagus | ESCC | 1.33e-04 | 3.41e-01 | 0.0514 |
| 56948 | SDR39U1 | LZE7T | Human | Esophagus | ESCC | 4.49e-05 | 4.06e-01 | 0.0667 |
| 56948 | SDR39U1 | LZE8T | Human | Esophagus | ESCC | 8.47e-07 | 2.47e-01 | 0.067 |
| 56948 | SDR39U1 | LZE20T | Human | Esophagus | ESCC | 1.41e-09 | 1.82e-01 | 0.0662 |
| 56948 | SDR39U1 | LZE22T | Human | Esophagus | ESCC | 8.41e-03 | 3.91e-01 | 0.068 |
| 56948 | SDR39U1 | LZE24T | Human | Esophagus | ESCC | 1.59e-20 | 5.84e-01 | 0.0596 |
| 56948 | SDR39U1 | LZE21T | Human | Esophagus | ESCC | 8.03e-10 | 4.67e-01 | 0.0655 |
| 56948 | SDR39U1 | LZE6T | Human | Esophagus | ESCC | 2.39e-05 | 3.38e-01 | 0.0845 |
| 56948 | SDR39U1 | P1T-E | Human | Esophagus | ESCC | 1.54e-04 | 2.13e-01 | 0.0875 |
| 56948 | SDR39U1 | P2T-E | Human | Esophagus | ESCC | 4.39e-34 | 5.91e-01 | 0.1177 |
| 56948 | SDR39U1 | P4T-E | Human | Esophagus | ESCC | 2.93e-28 | 8.15e-01 | 0.1323 |
| 56948 | SDR39U1 | P5T-E | Human | Esophagus | ESCC | 3.66e-17 | 3.38e-01 | 0.1327 |
| 56948 | SDR39U1 | P8T-E | Human | Esophagus | ESCC | 8.73e-33 | 3.56e-01 | 0.0889 |
| 56948 | SDR39U1 | P9T-E | Human | Esophagus | ESCC | 3.56e-23 | 4.16e-01 | 0.1131 |
| 56948 | SDR39U1 | P10T-E | Human | Esophagus | ESCC | 2.70e-56 | 9.56e-01 | 0.116 |
| 56948 | SDR39U1 | P11T-E | Human | Esophagus | ESCC | 1.02e-23 | 7.93e-01 | 0.1426 |
| 56948 | SDR39U1 | P12T-E | Human | Esophagus | ESCC | 4.73e-74 | 1.36e+00 | 0.1122 |
| 56948 | SDR39U1 | P15T-E | Human | Esophagus | ESCC | 1.11e-49 | 1.18e+00 | 0.1149 |
| Page: 1 2 3 4 5 |
| Tissue | Expression Dynamics | Abbreviation |
| Esophagus | 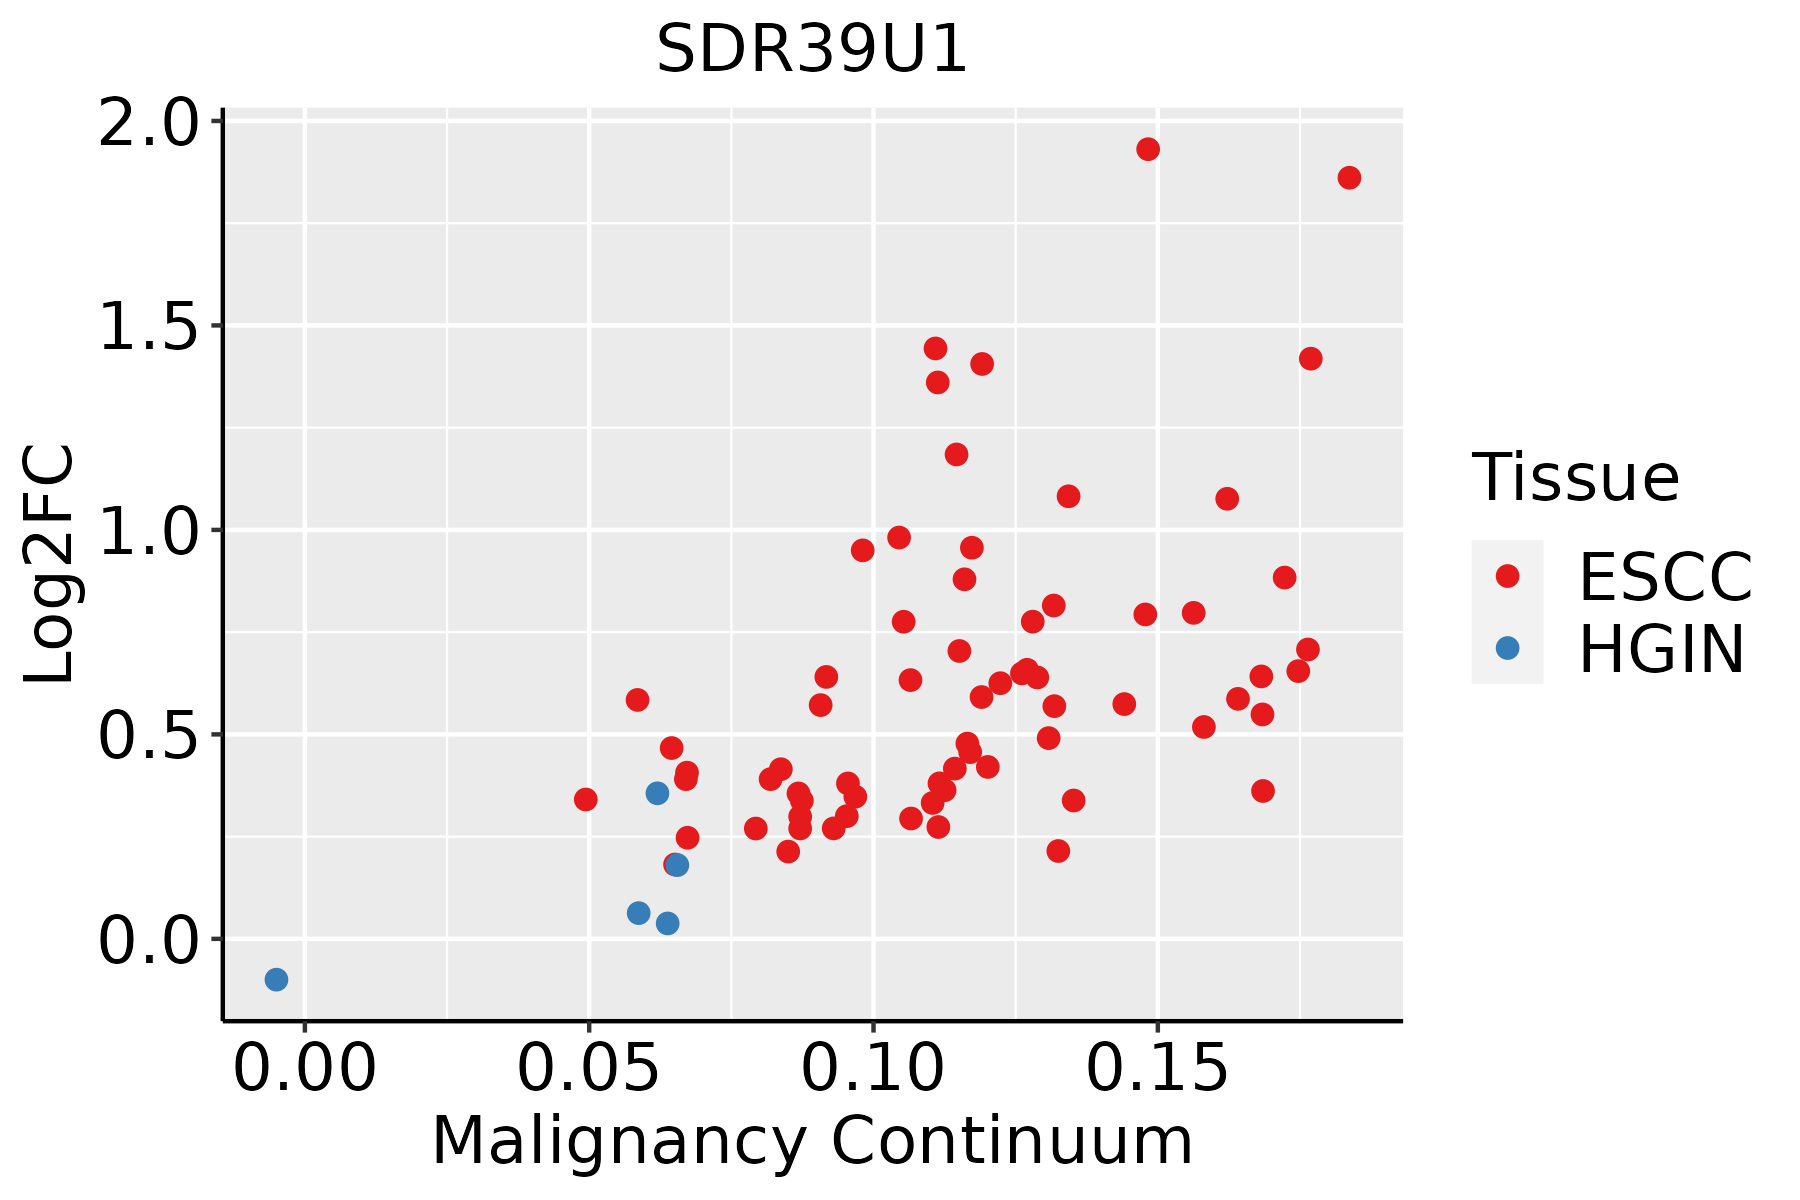 | ESCC: Esophageal squamous cell carcinoma |
| HGIN: High-grade intraepithelial neoplasias | ||
| LGIN: Low-grade intraepithelial neoplasias | ||
| Liver | 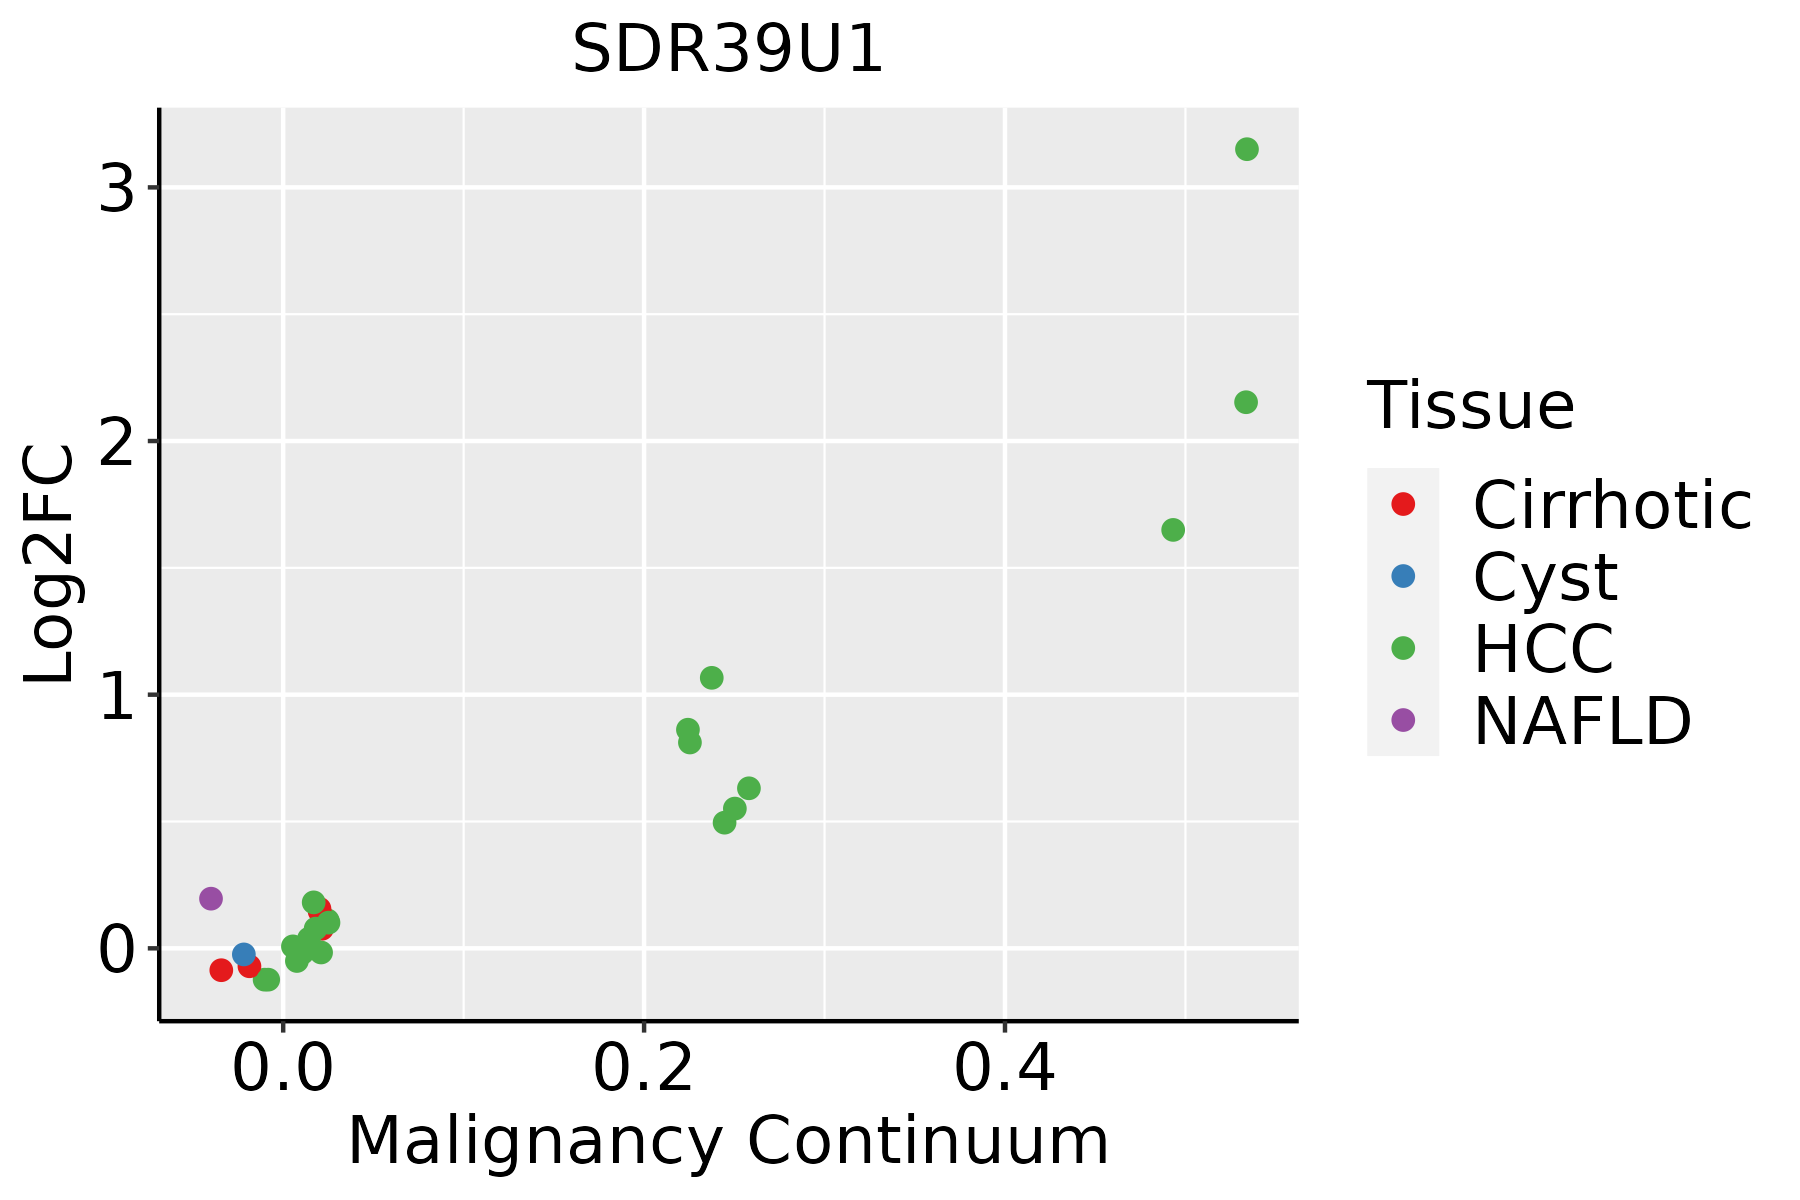 | HCC: Hepatocellular carcinoma |
| NAFLD: Non-alcoholic fatty liver disease | ||
| Oral Cavity | 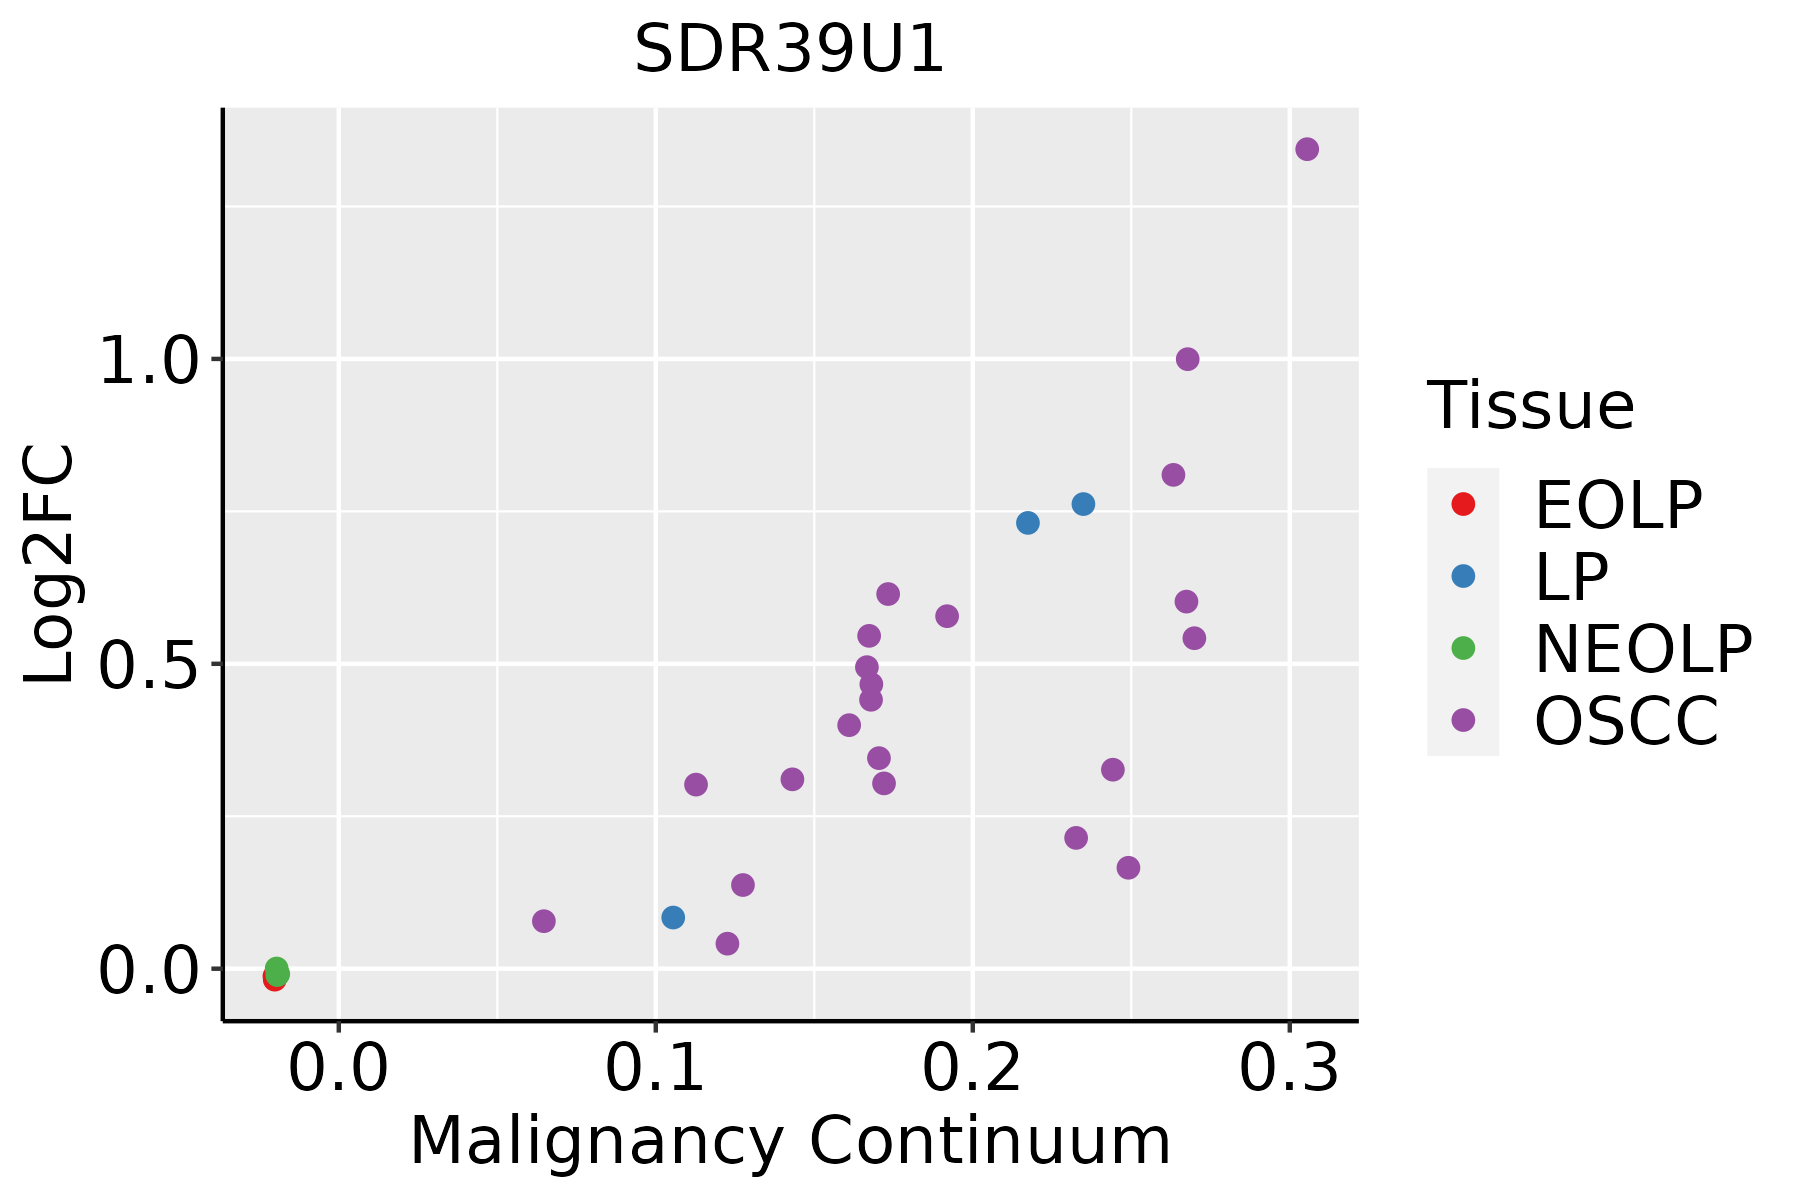 | EOLP: Erosive Oral lichen planus |
| LP: leukoplakia | ||
| NEOLP: Non-erosive oral lichen planus | ||
| OSCC: Oral squamous cell carcinoma |
| ∗log2FC in expression of this searched gene in stem-like cells from each diseased tissue sample relative to stem-like cells in normal samples in each tissue plotted against the malignancy continuum. Samples are colored based on if they are from different disease stage. |
Top |
Malignant transformation related pathway analysis |
| Find out the enriched GO biological processes and KEGG pathways involved in transition from healthy to precancer to cancer |
| Tissue | Disease Stage | Enriched GO biological Processes |
| Colorectum | AD |  |
| Colorectum | SER |  |
| Colorectum | MSS |  |
| Colorectum | MSI-H |  |
| Colorectum | FAP |  |
| ∗Top 15 enriched GO BP terms are showed in the bar plot of each disease state in each tissue. Each row represents a significant GO biological process which is colored according to the -log10(p.adjust). |
| Page: 1 2 3 4 5 6 7 8 9 |
| GO ID | Tissue | Disease Stage | Description | Gene Ratio | Bg Ratio | pvalue | p.adjust | Count |
| Page: 1 |
| Pathway ID | Tissue | Disease Stage | Description | Gene Ratio | Bg Ratio | pvalue | p.adjust | qvalue | Count |
| Page: 1 |
Top |
Cell-cell communication analysis |
| Identification of potential cell-cell interactions between two cell types and their ligand-receptor pairs for different disease states |
| Ligand | Receptor | LRpair | Pathway | Tissue | Disease Stage |
| Page: 1 |
Top |
Single-cell gene regulatory network inference analysis |
| Find out the significant the regulons (TFs) and the target genes of each regulon across cell types for different disease states |
| TF | Cell Type | Tissue | Disease Stage | Target Gene | RSS | Regulon Activity |
| ∗The dot plots of a searched regulon are shown for all cell subpopulations in each disease state of each tissue based on the regulon specific score inferred using pySCENIC and by calculating the average expression. |
| Page: 1 |
Top |
Somatic mutation of malignant transformation related genes |
| Annotation of somatic variants for genes involved in malignant transformation |
| Hugo Symbol | Variant Class | Variant Classification | dbSNP RS | HGVSc | HGVSp | HGVSp Short | SWISSPROT | BIOTYPE | SIFT | PolyPhen | Tumor Sample Barcode | Tissue | Histology | Sex | Age | Stage | Therapy Types | Drugs | Outcome |
| SDR39U1 | SNV | Missense_Mutation | rs778480289 | c.41N>A | p.Thr14Lys | p.T14K | Q9NRG7 | protein_coding | tolerated(0.39) | benign(0.006) | TCGA-A2-A25A-01 | Breast | breast invasive carcinoma | Female | <65 | I/II | Unspecific | Cytoxan | SD |
| SDR39U1 | SNV | Missense_Mutation | rs367826860 | c.787N>A | p.Glu263Lys | p.E263K | Q9NRG7 | protein_coding | tolerated(0.21) | possibly_damaging(0.669) | TCGA-AC-A3W6-01 | Breast | breast invasive carcinoma | Female | >=65 | III/IV | Unknown | Unknown | SD |
| SDR39U1 | SNV | Missense_Mutation | rs368549753 | c.764N>A | p.Arg255Gln | p.R255Q | Q9NRG7 | protein_coding | tolerated(0.49) | benign(0.003) | TCGA-E2-A152-01 | Breast | breast invasive carcinoma | Female | <65 | I/II | Targeted Molecular therapy | trastuzumab | PD |
| SDR39U1 | insertion | Frame_Shift_Ins | novel | c.228_229insA | p.Glu77ArgfsTer15 | p.E77Rfs*15 | Q9NRG7 | protein_coding | TCGA-BH-A18L-01 | Breast | breast invasive carcinoma | Female | <65 | III/IV | Unknown | Unknown | SD | ||
| SDR39U1 | SNV | Missense_Mutation | rs759354151 | c.770N>A | p.Arg257His | p.R257H | Q9NRG7 | protein_coding | deleterious(0) | probably_damaging(0.999) | TCGA-EA-A3HS-01 | Cervix | cervical & endocervical cancer | Female | <65 | I/II | Unknown | Unknown | SD |
| SDR39U1 | SNV | Missense_Mutation | rs759354151 | c.770N>A | p.Arg257His | p.R257H | Q9NRG7 | protein_coding | deleterious(0) | probably_damaging(0.999) | TCGA-LP-A4AV-01 | Cervix | cervical & endocervical cancer | Female | <65 | I/II | Unknown | Unknown | SD |
| SDR39U1 | SNV | Missense_Mutation | rs771553538 | c.245N>A | p.Arg82His | p.R82H | Q9NRG7 | protein_coding | deleterious(0) | probably_damaging(0.999) | TCGA-AA-3502-01 | Colorectum | colon adenocarcinoma | Male | >=65 | I/II | Unknown | Unknown | SD |
| SDR39U1 | SNV | Missense_Mutation | c.127N>A | p.Glu43Lys | p.E43K | Q9NRG7 | protein_coding | tolerated(0.06) | benign(0.154) | TCGA-AZ-6599-01 | Colorectum | colon adenocarcinoma | Male | >=65 | I/II | Unknown | Unknown | SD | |
| SDR39U1 | SNV | Missense_Mutation | c.719N>T | p.Ala240Val | p.A240V | Q9NRG7 | protein_coding | deleterious(0.01) | possibly_damaging(0.738) | TCGA-D5-6923-01 | Colorectum | colon adenocarcinoma | Male | <65 | I/II | Unknown | Unknown | SD | |
| SDR39U1 | insertion | Frame_Shift_Ins | novel | c.494_495insG | p.Gly166TrpfsTer42 | p.G166Wfs*42 | Q9NRG7 | protein_coding | TCGA-AA-3672-01 | Colorectum | colon adenocarcinoma | Female | >=65 | III/IV | Unknown | Unknown | SD |
| Page: 1 2 3 |
Top |
Related drugs of malignant transformation related genes |
| Identification of chemicals and drugs interact with genes involved in malignant transfromation |
| (DGIdb 4.0) |
| Entrez ID | Symbol | Category | Interaction Types | Drug Claim Name | Drug Name | PMIDs |
| Page: 1 |

Copyright 2023-Present -The University of Texas Health Science Center at Houston |