
|
|||||
|
 | |
| |
| |
| |
| |
| |
|
Gene: SDPR |
Gene summary for SDPR |
| Gene information | Species | Human | Gene symbol | SDPR | Gene ID | 8436 |
| Gene name | caveolae associated protein 2 | |
| Gene Alias | PS-p68 | |
| Cytomap | 2q32.3 | |
| Gene Type | protein-coding | GO ID | GO:0007009 | UniProtAcc | O95810 |
Top |
Malignant transformation analysis |
| Identification of the aberrant gene expression in precancerous and cancerous lesions by comparing the gene expression of stem-like cells in diseased tissues with normal stem cells |
| Entrez ID | Symbol | Replicates | Species | Organ | Tissue | Adj P-value | Log2FC | Malignancy |
| 8436 | SDPR | P1T-E | Human | Esophagus | ESCC | 3.50e-03 | 2.02e-01 | 0.0875 |
| 8436 | SDPR | P4T-E | Human | Esophagus | ESCC | 1.65e-24 | 9.21e-01 | 0.1323 |
| 8436 | SDPR | P8T-E | Human | Esophagus | ESCC | 1.15e-18 | 5.89e-01 | 0.0889 |
| 8436 | SDPR | P9T-E | Human | Esophagus | ESCC | 5.85e-13 | 4.82e-01 | 0.1131 |
| 8436 | SDPR | P10T-E | Human | Esophagus | ESCC | 1.14e-06 | 5.66e-02 | 0.116 |
| 8436 | SDPR | P12T-E | Human | Esophagus | ESCC | 8.38e-06 | 1.25e-02 | 0.1122 |
| 8436 | SDPR | P15T-E | Human | Esophagus | ESCC | 9.02e-23 | 6.42e-01 | 0.1149 |
| 8436 | SDPR | P23T-E | Human | Esophagus | ESCC | 2.79e-11 | 6.23e-01 | 0.108 |
| 8436 | SDPR | P26T-E | Human | Esophagus | ESCC | 1.92e-14 | 6.82e-01 | 0.1276 |
| 8436 | SDPR | P27T-E | Human | Esophagus | ESCC | 1.51e-23 | 6.51e-01 | 0.1055 |
| 8436 | SDPR | P28T-E | Human | Esophagus | ESCC | 2.60e-11 | 4.39e-01 | 0.1149 |
| 8436 | SDPR | P30T-E | Human | Esophagus | ESCC | 1.91e-26 | 1.21e+00 | 0.137 |
| 8436 | SDPR | P39T-E | Human | Esophagus | ESCC | 2.23e-18 | 7.38e-01 | 0.0894 |
| 8436 | SDPR | P42T-E | Human | Esophagus | ESCC | 9.31e-05 | 2.37e-01 | 0.1175 |
| 8436 | SDPR | P48T-E | Human | Esophagus | ESCC | 1.05e-24 | 6.46e-01 | 0.0959 |
| 8436 | SDPR | P52T-E | Human | Esophagus | ESCC | 7.45e-03 | 5.08e-01 | 0.1555 |
| 8436 | SDPR | P54T-E | Human | Esophagus | ESCC | 1.20e-10 | 4.92e-01 | 0.0975 |
| 8436 | SDPR | P61T-E | Human | Esophagus | ESCC | 1.18e-05 | 2.66e-01 | 0.099 |
| 8436 | SDPR | P62T-E | Human | Esophagus | ESCC | 5.68e-11 | 4.42e-01 | 0.1302 |
| 8436 | SDPR | P65T-E | Human | Esophagus | ESCC | 3.11e-05 | 2.68e-01 | 0.0978 |
| Page: 1 2 |
| Tissue | Expression Dynamics | Abbreviation |
| Esophagus | 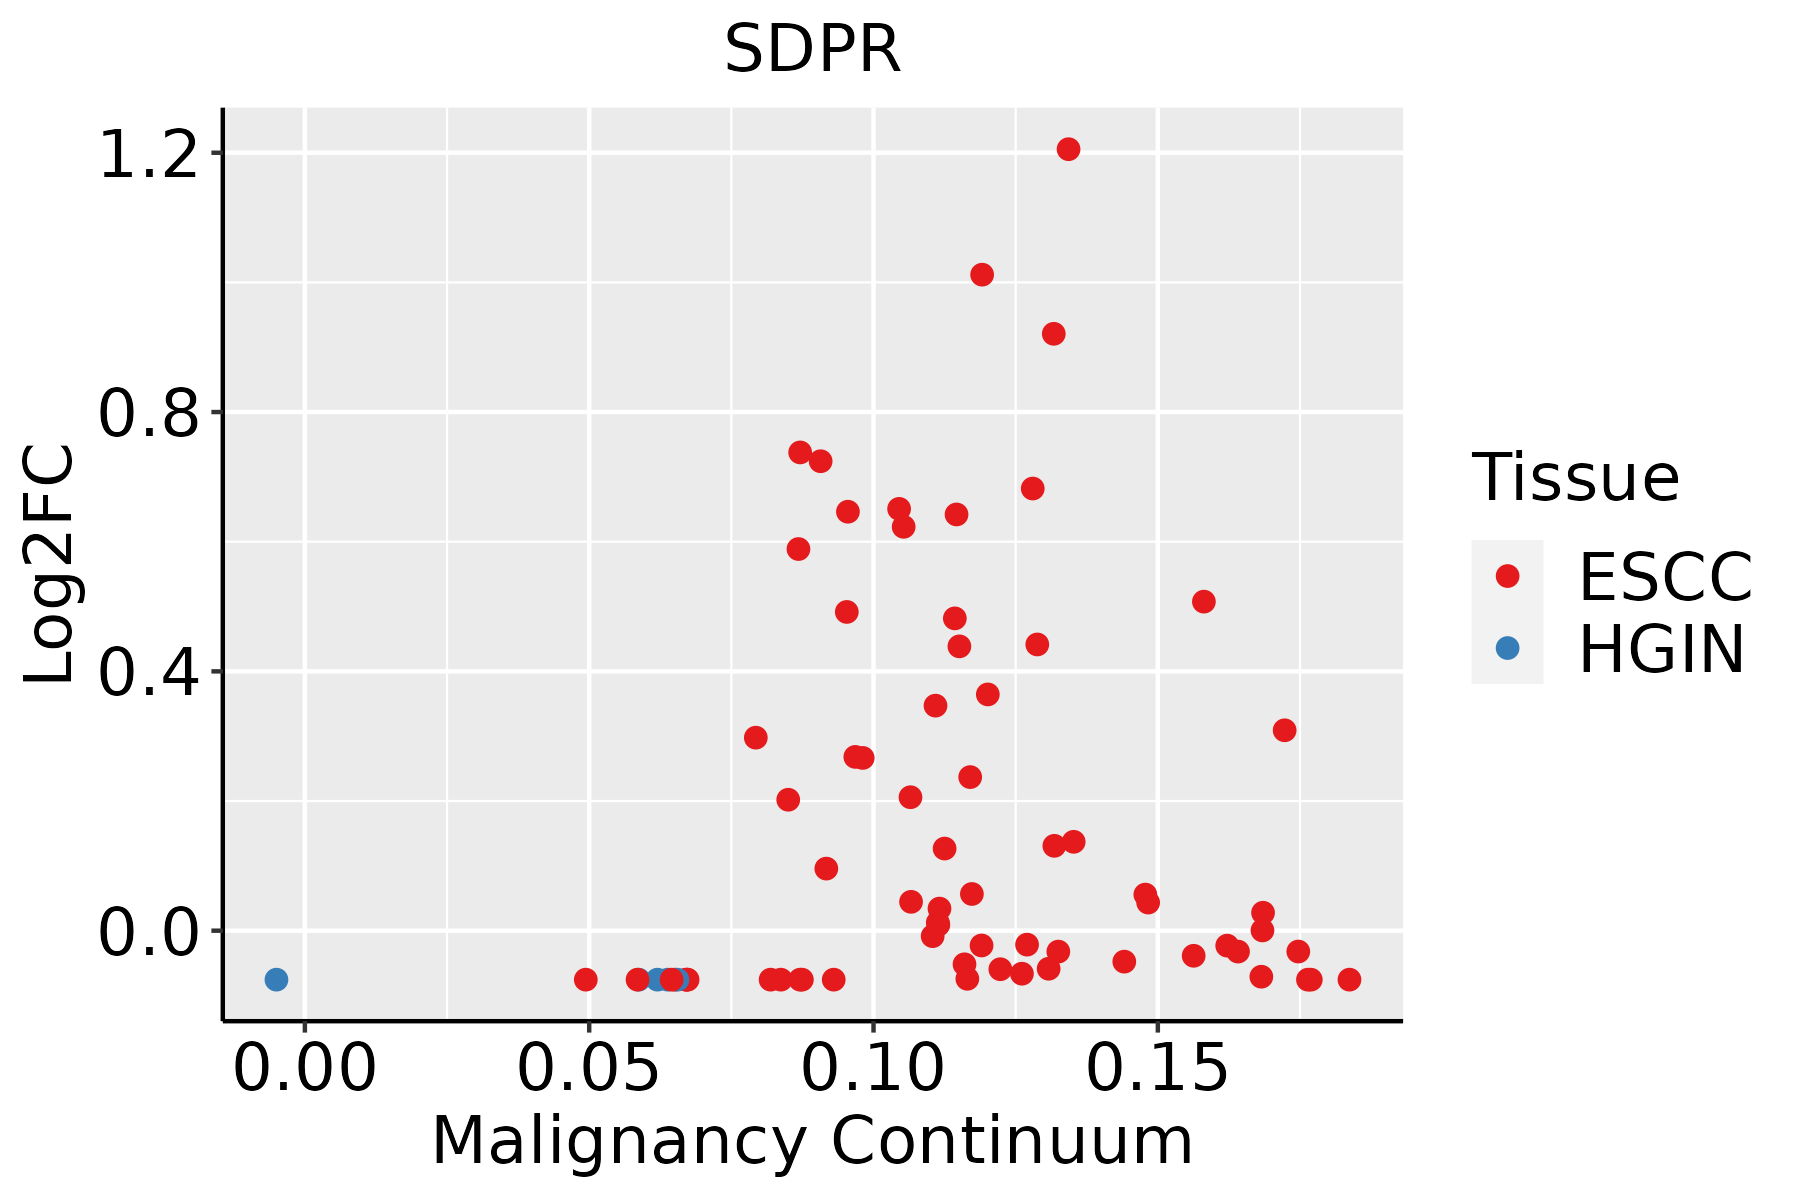 | ESCC: Esophageal squamous cell carcinoma |
| HGIN: High-grade intraepithelial neoplasias | ||
| LGIN: Low-grade intraepithelial neoplasias | ||
| Oral Cavity |  | EOLP: Erosive Oral lichen planus |
| LP: leukoplakia | ||
| NEOLP: Non-erosive oral lichen planus | ||
| OSCC: Oral squamous cell carcinoma |
| ∗log2FC in expression of this searched gene in stem-like cells from each diseased tissue sample relative to stem-like cells in normal samples in each tissue plotted against the malignancy continuum. Samples are colored based on if they are from different disease stage. |
Top |
Malignant transformation related pathway analysis |
| Find out the enriched GO biological processes and KEGG pathways involved in transition from healthy to precancer to cancer |
| Tissue | Disease Stage | Enriched GO biological Processes |
| Colorectum | AD |  |
| Colorectum | SER |  |
| Colorectum | MSS |  |
| Colorectum | MSI-H |  |
| Colorectum | FAP |  |
| ∗Top 15 enriched GO BP terms are showed in the bar plot of each disease state in each tissue. Each row represents a significant GO biological process which is colored according to the -log10(p.adjust). |
| Page: 1 2 3 4 5 6 7 8 9 |
| GO ID | Tissue | Disease Stage | Description | Gene Ratio | Bg Ratio | pvalue | p.adjust | Count |
| Page: 1 |
| Pathway ID | Tissue | Disease Stage | Description | Gene Ratio | Bg Ratio | pvalue | p.adjust | qvalue | Count |
| Page: 1 |
Top |
Cell-cell communication analysis |
| Identification of potential cell-cell interactions between two cell types and their ligand-receptor pairs for different disease states |
| Ligand | Receptor | LRpair | Pathway | Tissue | Disease Stage |
| Page: 1 |
Top |
Single-cell gene regulatory network inference analysis |
| Find out the significant the regulons (TFs) and the target genes of each regulon across cell types for different disease states |
| TF | Cell Type | Tissue | Disease Stage | Target Gene | RSS | Regulon Activity |
| ∗The dot plots of a searched regulon are shown for all cell subpopulations in each disease state of each tissue based on the regulon specific score inferred using pySCENIC and by calculating the average expression. |
| Page: 1 |
Top |
Somatic mutation of malignant transformation related genes |
| Annotation of somatic variants for genes involved in malignant transformation |
| Hugo Symbol | Variant Class | Variant Classification | dbSNP RS | HGVSc | HGVSp | HGVSp Short | SWISSPROT | BIOTYPE | SIFT | PolyPhen | Tumor Sample Barcode | Tissue | Histology | Sex | Age | Stage | Therapy Types | Drugs | Outcome |
| SDPR | SNV | Missense_Mutation | novel | c.729N>T | p.Lys243Asn | p.K243N | O95810 | protein_coding | deleterious(0) | probably_damaging(0.999) | TCGA-AN-A046-01 | Breast | breast invasive carcinoma | Female | >=65 | I/II | Unknown | Unknown | SD |
| SDPR | SNV | Missense_Mutation | novel | c.552N>T | p.Glu184Asp | p.E184D | O95810 | protein_coding | tolerated(0.15) | benign(0.066) | TCGA-AN-A046-01 | Breast | breast invasive carcinoma | Female | >=65 | I/II | Unknown | Unknown | SD |
| SDPR | SNV | Missense_Mutation | c.238N>A | p.Glu80Lys | p.E80K | O95810 | protein_coding | deleterious(0) | probably_damaging(0.979) | TCGA-BH-A0B6-01 | Breast | breast invasive carcinoma | Female | <65 | I/II | Unknown | Unknown | SD | |
| SDPR | SNV | Missense_Mutation | novel | c.49N>C | p.Asp17His | p.D17H | O95810 | protein_coding | tolerated_low_confidence(0.17) | benign(0.001) | TCGA-BH-A0B6-01 | Breast | breast invasive carcinoma | Female | <65 | I/II | Unknown | Unknown | SD |
| SDPR | SNV | Missense_Mutation | novel | c.641N>A | p.Ala214Asp | p.A214D | O95810 | protein_coding | tolerated(0.66) | benign(0.011) | TCGA-E9-A1QZ-01 | Breast | breast invasive carcinoma | Female | <65 | I/II | Unknown | Unknown | SD |
| SDPR | SNV | Missense_Mutation | novel | c.380C>T | p.Ala127Val | p.A127V | O95810 | protein_coding | tolerated(0.18) | benign(0.301) | TCGA-E9-A2JS-01 | Breast | breast invasive carcinoma | Female | >=65 | I/II | Chemotherapy | cyclophosphamide | PD |
| SDPR | insertion | Frame_Shift_Ins | novel | c.720_721insGGGCA | p.Ser241GlyfsTer17 | p.S241Gfs*17 | O95810 | protein_coding | TCGA-A7-A0CJ-01 | Breast | breast invasive carcinoma | Female | <65 | I/II | Chemotherapy | cytoxan | SD | ||
| SDPR | insertion | Frame_Shift_Ins | novel | c.719_720insGGCTGCTGAGAAGGCGACCTCCAGGGGGAGTCTGTGCT | p.Asp240GlufsTer29 | p.D240Efs*29 | O95810 | protein_coding | TCGA-A7-A0CJ-01 | Breast | breast invasive carcinoma | Female | <65 | I/II | Chemotherapy | cytoxan | SD | ||
| SDPR | insertion | Nonsense_Mutation | novel | c.44_45insAGTTCTTTTCTAGCAAATGCACTAGAAAAAGAGA | p.Ser16ValfsTer4 | p.S16Vfs*4 | O95810 | protein_coding | TCGA-BH-A0H7-01 | Breast | breast invasive carcinoma | Female | >=65 | III/IV | Chemotherapy | doxorubicin | SD | ||
| SDPR | insertion | In_Frame_Ins | novel | c.42_43insTGT | p.Pro14_Gly15insCys | p.P14_G15insC | O95810 | protein_coding | TCGA-BH-A0H7-01 | Breast | breast invasive carcinoma | Female | >=65 | III/IV | Chemotherapy | doxorubicin | SD |
| Page: 1 2 3 4 5 6 7 |
Top |
Related drugs of malignant transformation related genes |
| Identification of chemicals and drugs interact with genes involved in malignant transfromation |
| (DGIdb 4.0) |
| Entrez ID | Symbol | Category | Interaction Types | Drug Claim Name | Drug Name | PMIDs |
| Page: 1 |

Copyright 2023-Present -The University of Texas Health Science Center at Houston |