
|
|||||
|
 | |
| |
| |
| |
| |
| |
|
Gene: SDK2 |
Gene summary for SDK2 |
| Gene information | Species | Human | Gene symbol | SDK2 | Gene ID | 54549 |
| Gene name | sidekick cell adhesion molecule 2 | |
| Gene Alias | SDK2 | |
| Cytomap | 17q25.1 | |
| Gene Type | protein-coding | GO ID | GO:0001654 | UniProtAcc | Q58EX2 |
Top |
Malignant transformation analysis |
| Identification of the aberrant gene expression in precancerous and cancerous lesions by comparing the gene expression of stem-like cells in diseased tissues with normal stem cells |
| Entrez ID | Symbol | Replicates | Species | Organ | Tissue | Adj P-value | Log2FC | Malignancy |
| 54549 | SDK2 | C30 | Human | Oral cavity | OSCC | 3.92e-39 | 1.26e+00 | 0.3055 |
| 54549 | SDK2 | C38 | Human | Oral cavity | OSCC | 1.36e-05 | 6.81e-01 | 0.172 |
| 54549 | SDK2 | C51 | Human | Oral cavity | OSCC | 1.66e-17 | 6.35e-01 | 0.2674 |
| 54549 | SDK2 | C06 | Human | Oral cavity | OSCC | 1.70e-02 | 5.25e-01 | 0.2699 |
| 54549 | SDK2 | C08 | Human | Oral cavity | OSCC | 4.92e-05 | 1.60e-01 | 0.1919 |
| 54549 | SDK2 | C09 | Human | Oral cavity | OSCC | 1.75e-10 | 4.36e-01 | 0.1431 |
| 54549 | SDK2 | EOLP-1 | Human | Oral cavity | EOLP | 2.93e-08 | 2.32e-01 | -0.0202 |
| 54549 | SDK2 | SYSMH3 | Human | Oral cavity | OSCC | 8.14e-22 | 3.79e-01 | 0.2442 |
| 54549 | SDK2 | SYSMH5 | Human | Oral cavity | OSCC | 3.58e-03 | 1.53e-01 | 0.0647 |
| Page: 1 |
| Tissue | Expression Dynamics | Abbreviation |
| Oral Cavity | 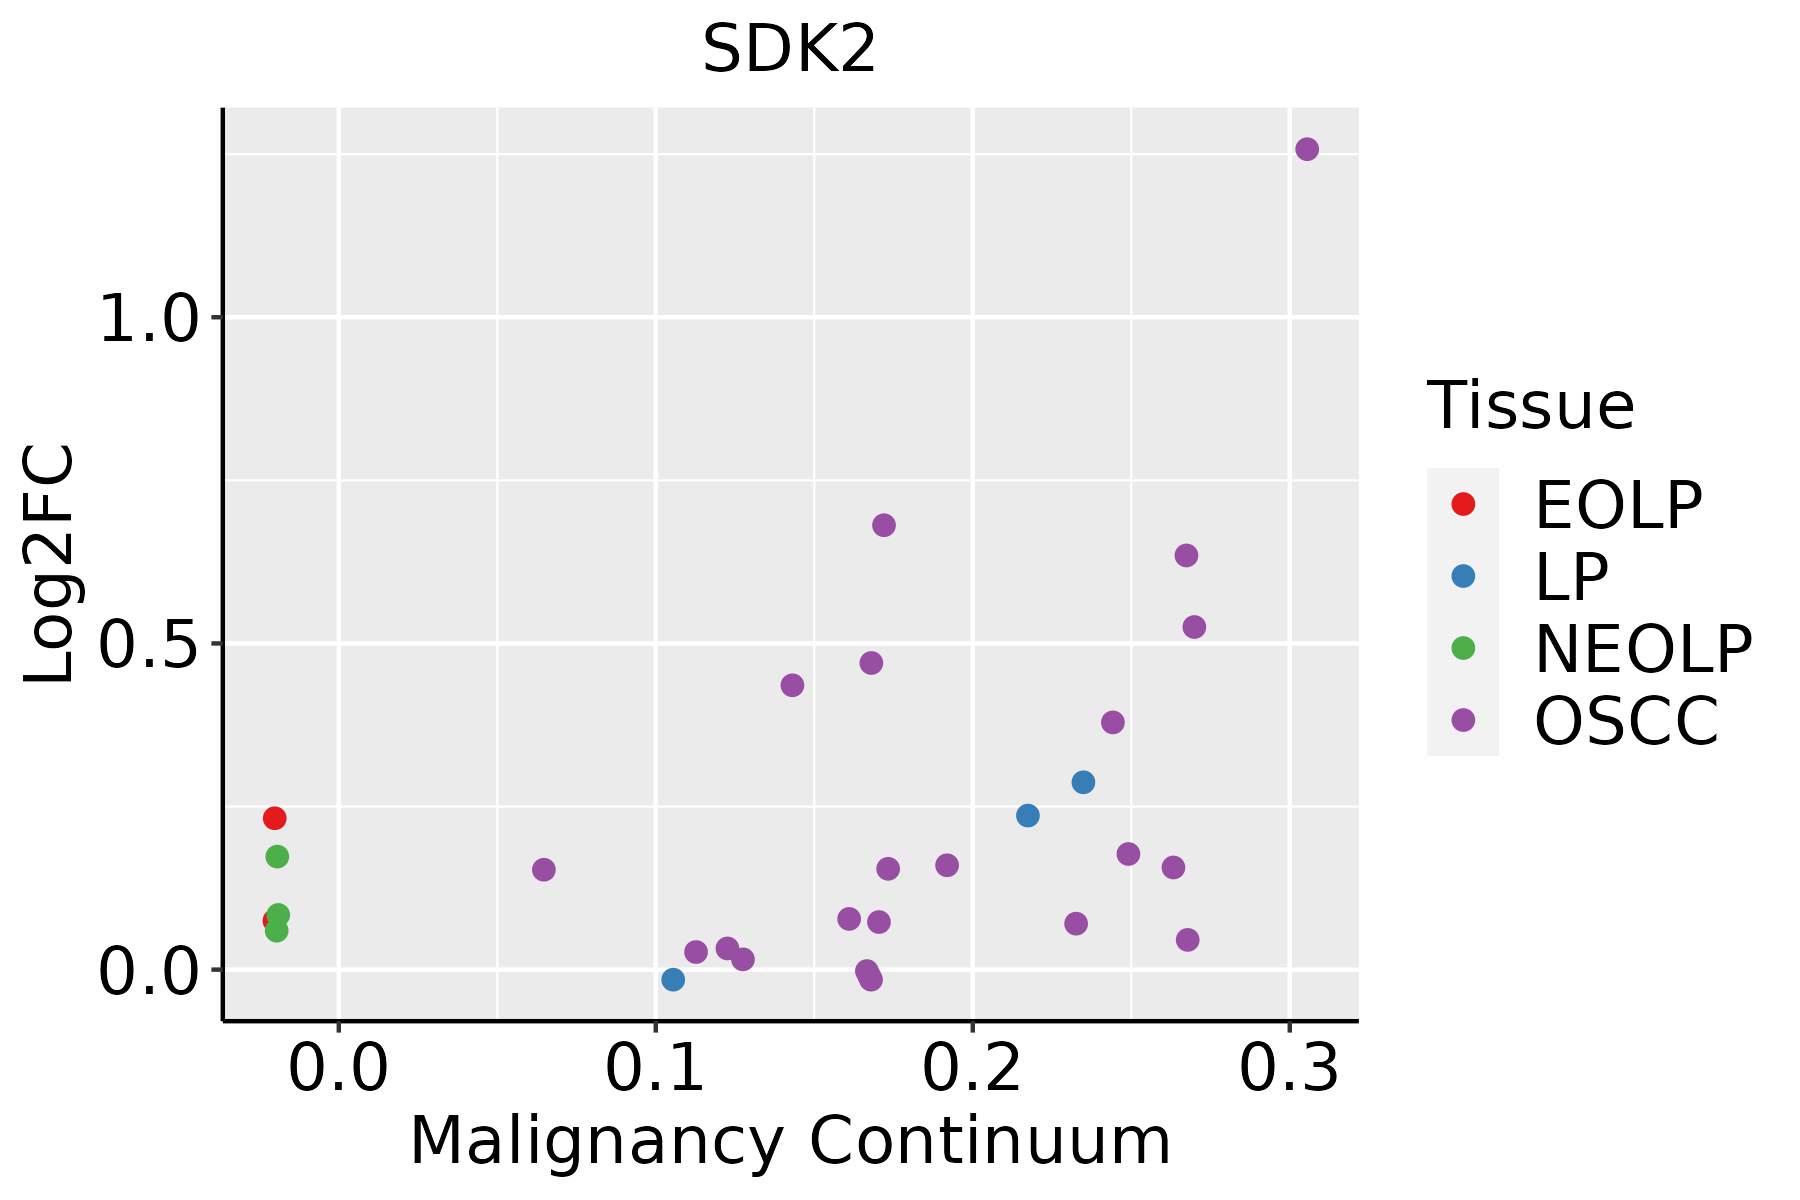 | EOLP: Erosive Oral lichen planus |
| LP: leukoplakia | ||
| NEOLP: Non-erosive oral lichen planus | ||
| OSCC: Oral squamous cell carcinoma |
| ∗log2FC in expression of this searched gene in stem-like cells from each diseased tissue sample relative to stem-like cells in normal samples in each tissue plotted against the malignancy continuum. Samples are colored based on if they are from different disease stage. |
Top |
Malignant transformation related pathway analysis |
| Find out the enriched GO biological processes and KEGG pathways involved in transition from healthy to precancer to cancer |
| Tissue | Disease Stage | Enriched GO biological Processes |
| Colorectum | AD |  |
| Colorectum | SER |  |
| Colorectum | MSS |  |
| Colorectum | MSI-H |  |
| Colorectum | FAP |  |
| ∗Top 15 enriched GO BP terms are showed in the bar plot of each disease state in each tissue. Each row represents a significant GO biological process which is colored according to the -log10(p.adjust). |
| Page: 1 2 3 4 5 6 7 8 9 |
| GO ID | Tissue | Disease Stage | Description | Gene Ratio | Bg Ratio | pvalue | p.adjust | Count |
| GO:003432916 | Oral cavity | OSCC | cell junction assembly | 190/7305 | 420/18723 | 4.99e-03 | 1.96e-02 | 190 |
| GO:003432917 | Oral cavity | EOLP | cell junction assembly | 76/2218 | 420/18723 | 1.02e-04 | 1.17e-03 | 76 |
| GO:00016542 | Oral cavity | EOLP | eye development | 62/2218 | 371/18723 | 3.18e-03 | 1.85e-02 | 62 |
| GO:01500632 | Oral cavity | EOLP | visual system development | 62/2218 | 375/18723 | 4.07e-03 | 2.24e-02 | 62 |
| GO:00488802 | Oral cavity | EOLP | sensory system development | 62/2218 | 381/18723 | 5.82e-03 | 2.94e-02 | 62 |
| Page: 1 |
| Pathway ID | Tissue | Disease Stage | Description | Gene Ratio | Bg Ratio | pvalue | p.adjust | qvalue | Count |
| Page: 1 |
Top |
Cell-cell communication analysis |
| Identification of potential cell-cell interactions between two cell types and their ligand-receptor pairs for different disease states |
| Ligand | Receptor | LRpair | Pathway | Tissue | Disease Stage |
| Page: 1 |
Top |
Single-cell gene regulatory network inference analysis |
| Find out the significant the regulons (TFs) and the target genes of each regulon across cell types for different disease states |
| TF | Cell Type | Tissue | Disease Stage | Target Gene | RSS | Regulon Activity |
| ∗The dot plots of a searched regulon are shown for all cell subpopulations in each disease state of each tissue based on the regulon specific score inferred using pySCENIC and by calculating the average expression. |
| Page: 1 |
Top |
Somatic mutation of malignant transformation related genes |
| Annotation of somatic variants for genes involved in malignant transformation |
| Hugo Symbol | Variant Class | Variant Classification | dbSNP RS | HGVSc | HGVSp | HGVSp Short | SWISSPROT | BIOTYPE | SIFT | PolyPhen | Tumor Sample Barcode | Tissue | Histology | Sex | Age | Stage | Therapy Types | Drugs | Outcome |
| SDK2 | SNV | Missense_Mutation | c.4948N>T | p.Asp1650Tyr | p.D1650Y | Q58EX2 | protein_coding | deleterious(0) | benign(0.389) | TCGA-A7-A26E-01 | Breast | breast invasive carcinoma | Female | >=65 | III/IV | Chemotherapy | cytoxan | SD | |
| SDK2 | SNV | Missense_Mutation | rs755128780 | c.4091N>T | p.Gly1364Val | p.G1364V | Q58EX2 | protein_coding | deleterious(0.02) | possibly_damaging(0.759) | TCGA-A7-A26J-01 | Breast | breast invasive carcinoma | Female | <65 | I/II | Hormone Therapy | tamoxiphen | SD |
| SDK2 | SNV | Missense_Mutation | rs747769635 | c.1447N>T | p.Val483Phe | p.V483F | Q58EX2 | protein_coding | deleterious(0.05) | benign(0.148) | TCGA-A8-A06Z-01 | Breast | breast invasive carcinoma | Female | >=65 | I/II | Unknown | Unknown | SD |
| SDK2 | SNV | Missense_Mutation | rs770209140 | c.3694N>A | p.Val1232Met | p.V1232M | Q58EX2 | protein_coding | deleterious(0) | possibly_damaging(0.824) | TCGA-AC-A23H-01 | Breast | breast invasive carcinoma | Female | >=65 | I/II | Unknown | Unknown | PD |
| SDK2 | SNV | Missense_Mutation | rs144170771 | c.3514N>T | p.Arg1172Cys | p.R1172C | Q58EX2 | protein_coding | deleterious(0) | possibly_damaging(0.791) | TCGA-AC-A23H-01 | Breast | breast invasive carcinoma | Female | >=65 | I/II | Unknown | Unknown | PD |
| SDK2 | SNV | Missense_Mutation | rs760209315 | c.1277N>T | p.Ser426Leu | p.S426L | Q58EX2 | protein_coding | deleterious(0.04) | benign(0.15) | TCGA-AC-A23H-01 | Breast | breast invasive carcinoma | Female | >=65 | I/II | Unknown | Unknown | PD |
| SDK2 | SNV | Missense_Mutation | c.5116G>A | p.Ala1706Thr | p.A1706T | Q58EX2 | protein_coding | deleterious(0.02) | probably_damaging(1) | TCGA-B6-A0IH-01 | Breast | breast invasive carcinoma | Female | >=65 | III/IV | Unknown | Unknown | SD | |
| SDK2 | SNV | Missense_Mutation | rs767139377 | c.583N>C | p.Thr195Pro | p.T195P | Q58EX2 | protein_coding | deleterious(0.02) | benign(0.444) | TCGA-B6-A1KC-01 | Breast | breast invasive carcinoma | Female | >=65 | I/II | Unknown | Unknown | SD |
| SDK2 | SNV | Missense_Mutation | c.3164N>T | p.Ser1055Phe | p.S1055F | Q58EX2 | protein_coding | deleterious(0.01) | probably_damaging(0.939) | TCGA-BH-A0EA-01 | Breast | breast invasive carcinoma | Female | >=65 | I/II | Chemotherapy | taxotere | CR | |
| SDK2 | SNV | Missense_Mutation | rs181948937 | c.685N>A | p.Gly229Ser | p.G229S | Q58EX2 | protein_coding | deleterious(0) | probably_damaging(0.939) | TCGA-BH-A0HA-01 | Breast | breast invasive carcinoma | Female | <65 | I/II | Unknown | Unknown | SD |
| Page: 1 2 3 4 5 6 7 8 9 10 11 12 13 14 15 16 17 18 19 20 21 22 23 24 25 26 27 |
Top |
Related drugs of malignant transformation related genes |
| Identification of chemicals and drugs interact with genes involved in malignant transfromation |
| (DGIdb 4.0) |
| Entrez ID | Symbol | Category | Interaction Types | Drug Claim Name | Drug Name | PMIDs |
| Page: 1 |

Copyright 2023-Present -The University of Texas Health Science Center at Houston |