
|
|||||
|
 | |
| |
| |
| |
| |
| |
|
Gene: SDK1 |
Gene summary for SDK1 |
| Gene information | Species | Human | Gene symbol | SDK1 | Gene ID | 221935 |
| Gene name | sidekick cell adhesion molecule 1 | |
| Gene Alias | SDK1 | |
| Cytomap | 7p22.2 | |
| Gene Type | protein-coding | GO ID | GO:0001654 | UniProtAcc | Q7Z5N4 |
Top |
Malignant transformation analysis |
| Identification of the aberrant gene expression in precancerous and cancerous lesions by comparing the gene expression of stem-like cells in diseased tissues with normal stem cells |
| Entrez ID | Symbol | Replicates | Species | Organ | Tissue | Adj P-value | Log2FC | Malignancy |
| 221935 | SDK1 | CCI_2 | Human | Cervix | CC | 9.11e-18 | 1.45e+00 | 0.5249 |
| 221935 | SDK1 | CCI_3 | Human | Cervix | CC | 1.38e-34 | 1.44e+00 | 0.516 |
| 221935 | SDK1 | CCII_1 | Human | Cervix | CC | 1.31e-05 | 2.79e-01 | 0.3249 |
| 221935 | SDK1 | AEH-subject1 | Human | Endometrium | AEH | 5.12e-23 | 6.65e-01 | -0.3059 |
| 221935 | SDK1 | AEH-subject2 | Human | Endometrium | AEH | 1.01e-10 | 4.35e-01 | -0.2525 |
| 221935 | SDK1 | AEH-subject3 | Human | Endometrium | AEH | 3.41e-08 | 3.78e-01 | -0.2576 |
| 221935 | SDK1 | AEH-subject4 | Human | Endometrium | AEH | 3.50e-26 | 8.48e-01 | -0.2657 |
| 221935 | SDK1 | AEH-subject5 | Human | Endometrium | AEH | 1.74e-11 | 5.01e-01 | -0.2953 |
| 221935 | SDK1 | EEC-subject1 | Human | Endometrium | EEC | 2.33e-19 | 6.46e-01 | -0.2682 |
| 221935 | SDK1 | EEC-subject2 | Human | Endometrium | EEC | 5.61e-04 | 1.44e-01 | -0.2607 |
| 221935 | SDK1 | EEC-subject3 | Human | Endometrium | EEC | 8.89e-22 | 4.09e-01 | -0.2525 |
| 221935 | SDK1 | EEC-subject4 | Human | Endometrium | EEC | 8.02e-15 | 5.54e-01 | -0.2571 |
| 221935 | SDK1 | GSM5276934 | Human | Endometrium | EEC | 1.91e-10 | -2.23e-01 | -0.0913 |
| 221935 | SDK1 | GSM5276935 | Human | Endometrium | EEC | 3.50e-03 | -2.01e-01 | -0.123 |
| 221935 | SDK1 | GSM6177620_NYU_UCEC1_lib1_lib1 | Human | Endometrium | EEC | 2.53e-08 | -2.29e-01 | -0.1869 |
| 221935 | SDK1 | GSM6177620_NYU_UCEC1_lib2_lib2 | Human | Endometrium | EEC | 1.07e-10 | -2.45e-01 | -0.1875 |
| 221935 | SDK1 | GSM6177620_NYU_UCEC1_lib3_lib3 | Human | Endometrium | EEC | 3.64e-12 | -2.70e-01 | -0.1883 |
| 221935 | SDK1 | GSM6177621_NYU_UCEC2_lib1_lib1 | Human | Endometrium | EEC | 6.13e-08 | -8.30e-02 | -0.1934 |
| 221935 | SDK1 | GSM6177622_NYU_UCEC3_lib1_lib1 | Human | Endometrium | EEC | 4.74e-16 | -2.58e-01 | -0.1917 |
| 221935 | SDK1 | GSM6177622_NYU_UCEC3_lib2_lib2 | Human | Endometrium | EEC | 2.95e-16 | -2.70e-01 | -0.1916 |
| Page: 1 2 3 4 5 |
| Tissue | Expression Dynamics | Abbreviation |
| Cervix | 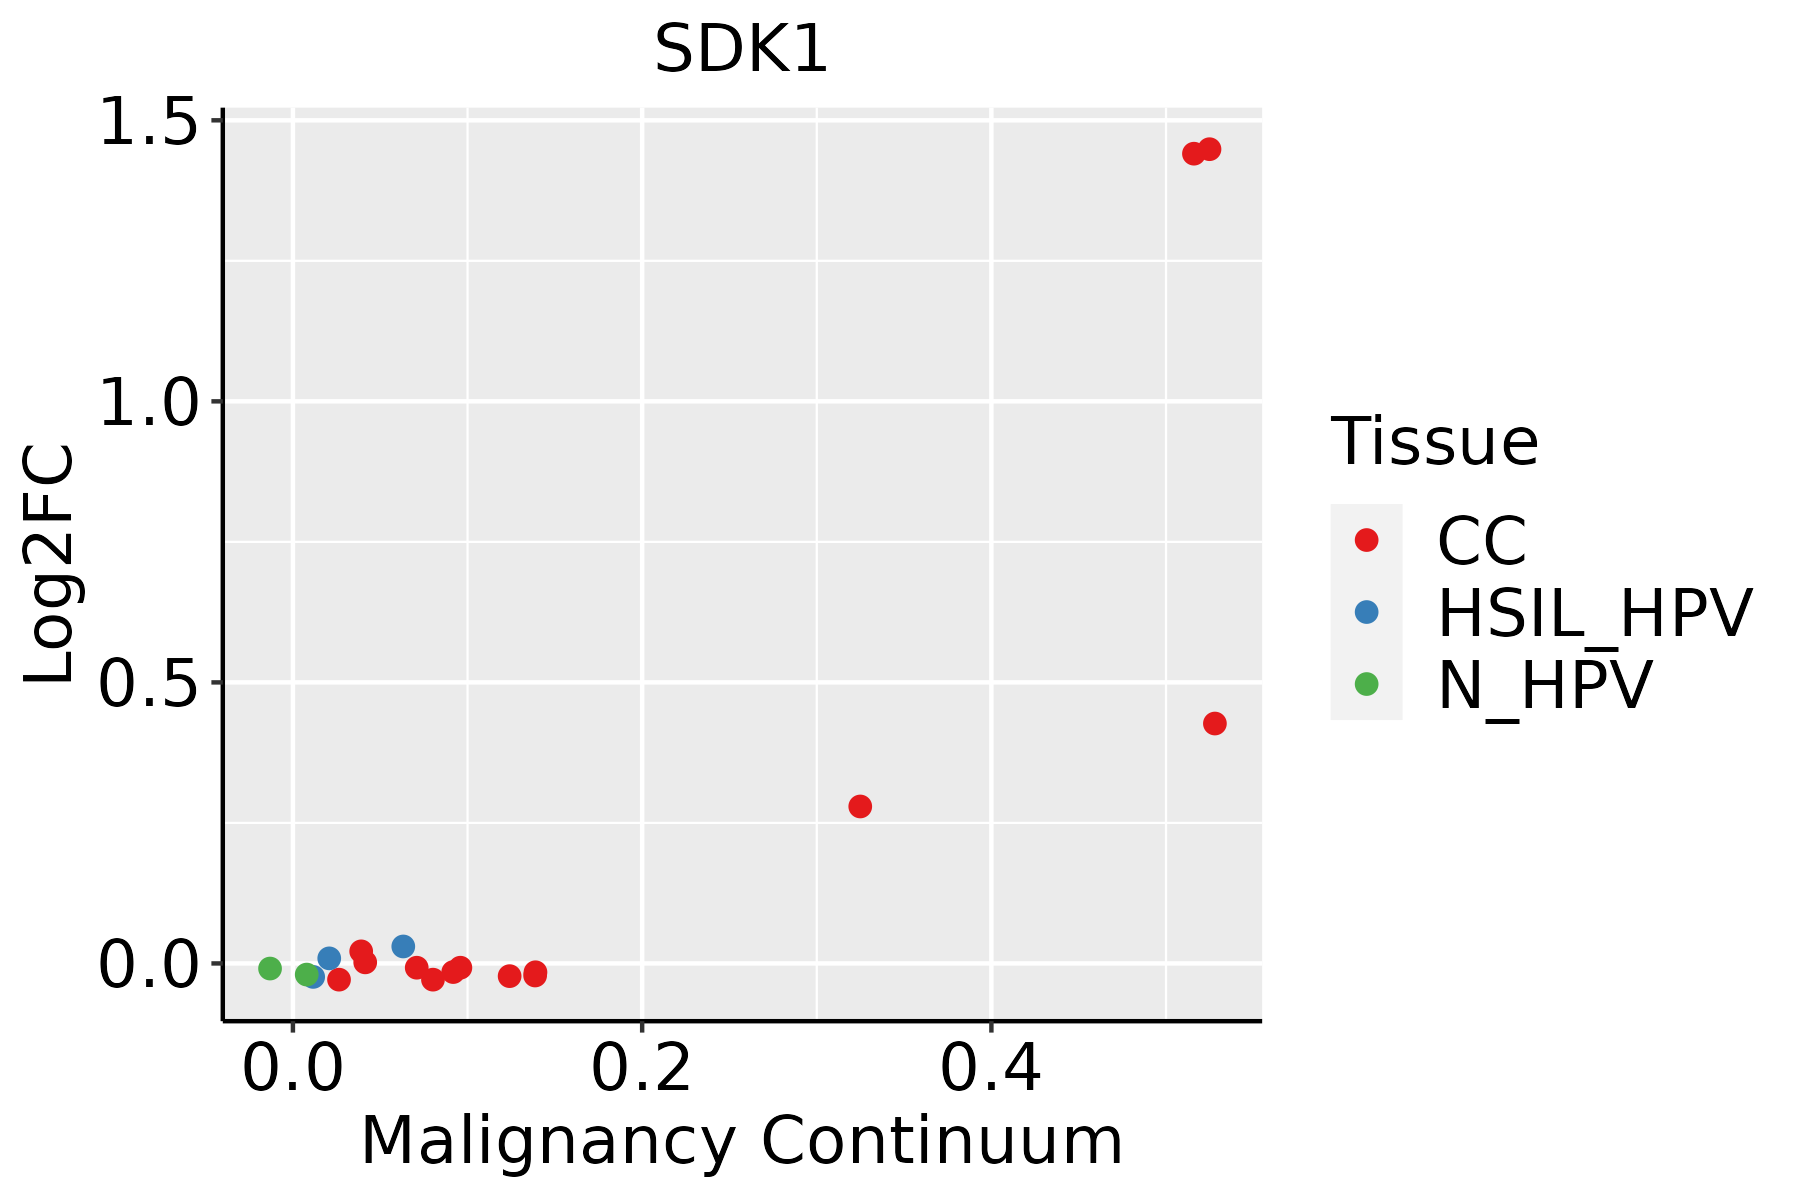 | CC: Cervix cancer |
| HSIL_HPV: HPV-infected high-grade squamous intraepithelial lesions | ||
| N_HPV: HPV-infected normal cervix | ||
| Endometrium | 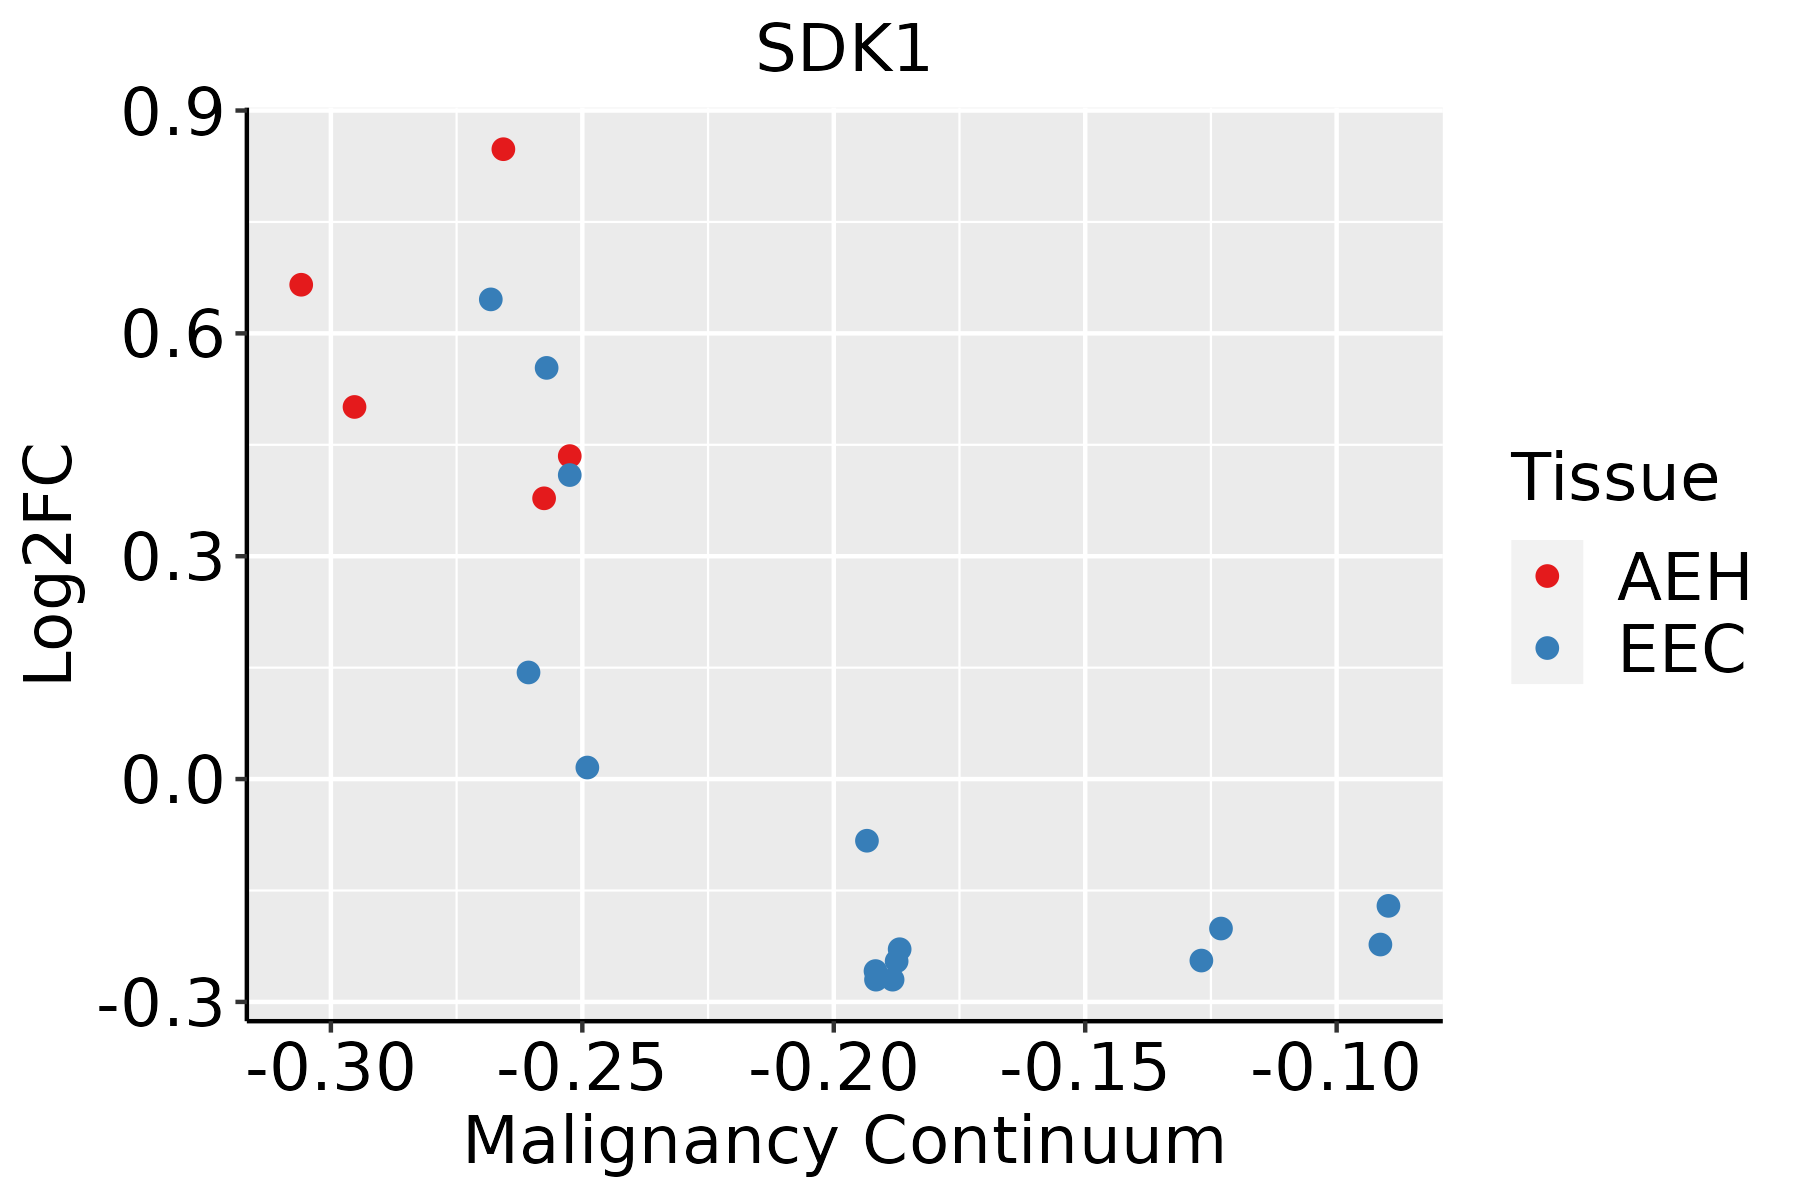 | AEH: Atypical endometrial hyperplasia |
| EEC: Endometrioid Cancer | ||
| Lung |  | AAH: Atypical adenomatous hyperplasia |
| AIS: Adenocarcinoma in situ | ||
| IAC: Invasive lung adenocarcinoma | ||
| MIA: Minimally invasive adenocarcinoma | ||
| Oral Cavity | 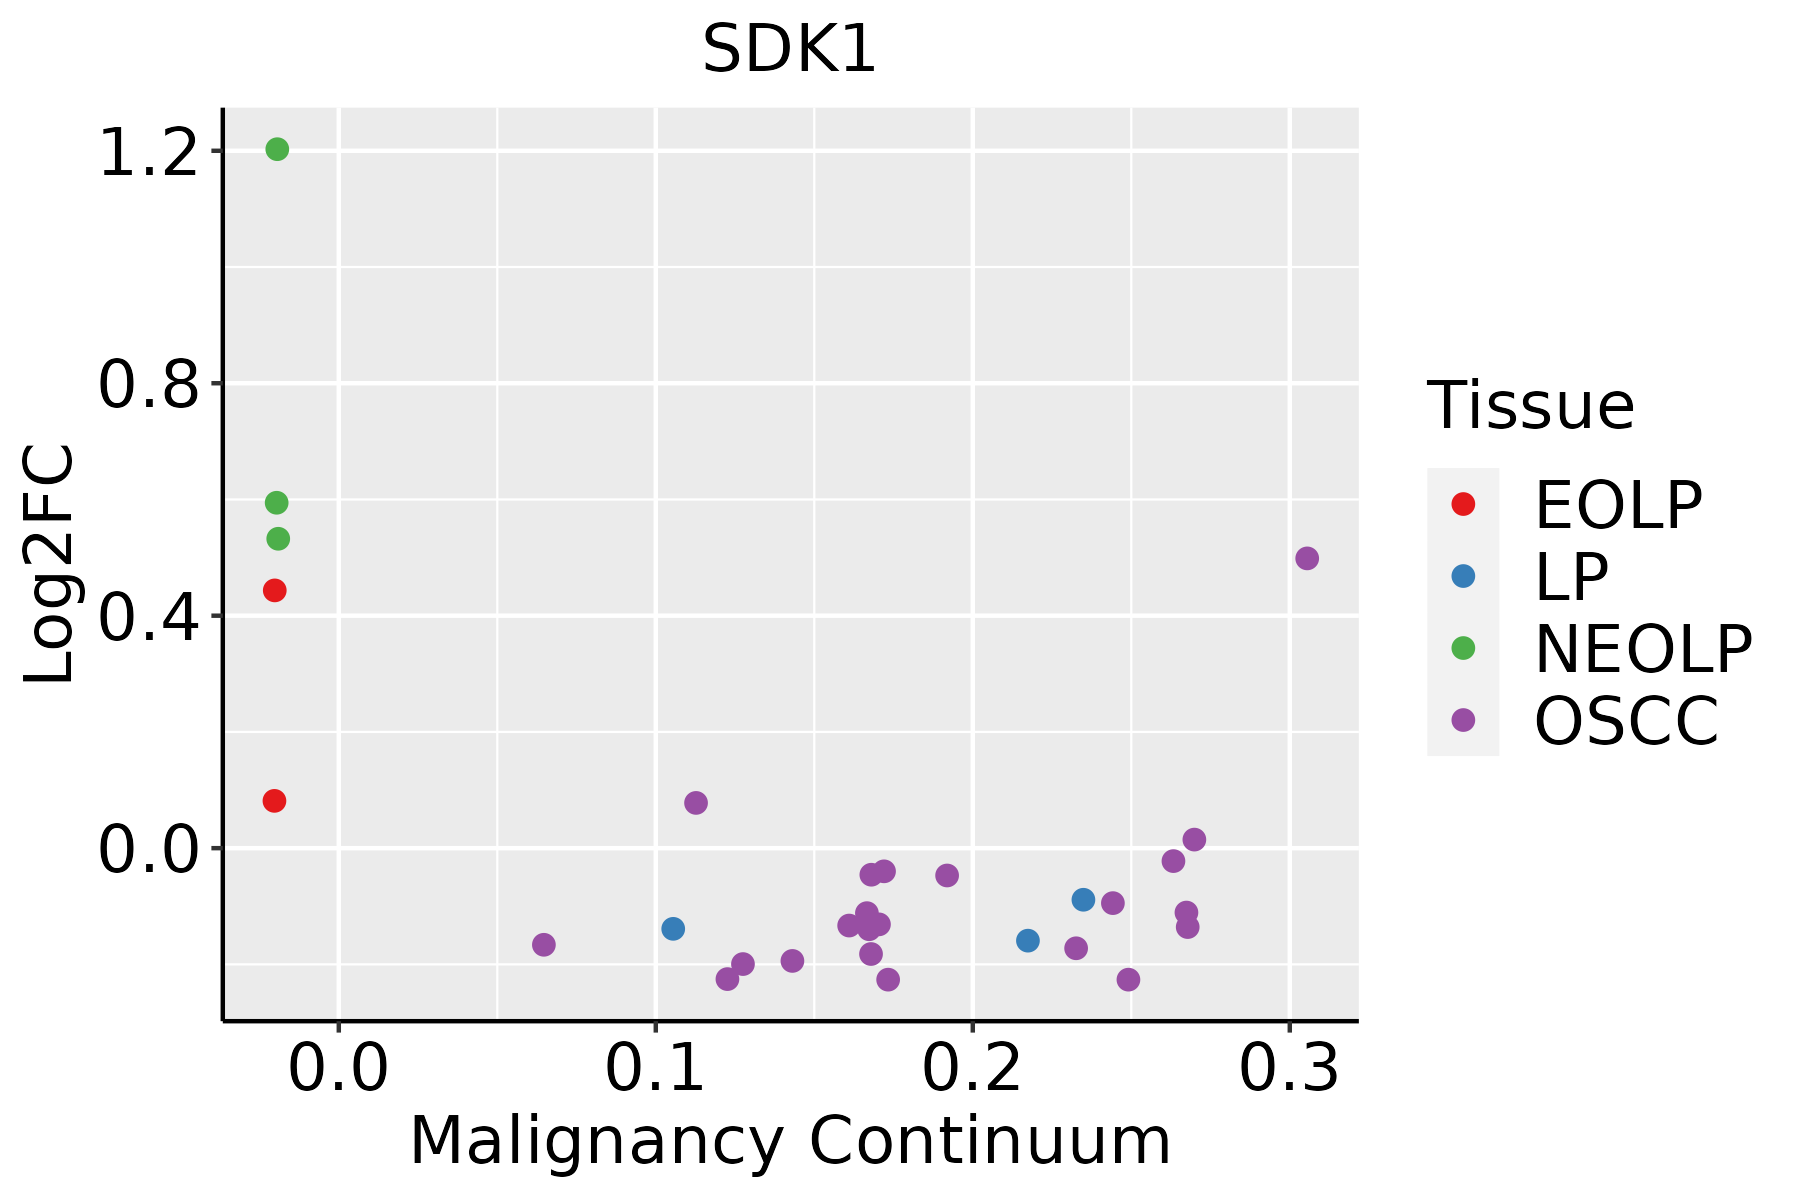 | EOLP: Erosive Oral lichen planus |
| LP: leukoplakia | ||
| NEOLP: Non-erosive oral lichen planus | ||
| OSCC: Oral squamous cell carcinoma | ||
| Prostate |  | BPH: Benign Prostatic Hyperplasia |
| Skin | 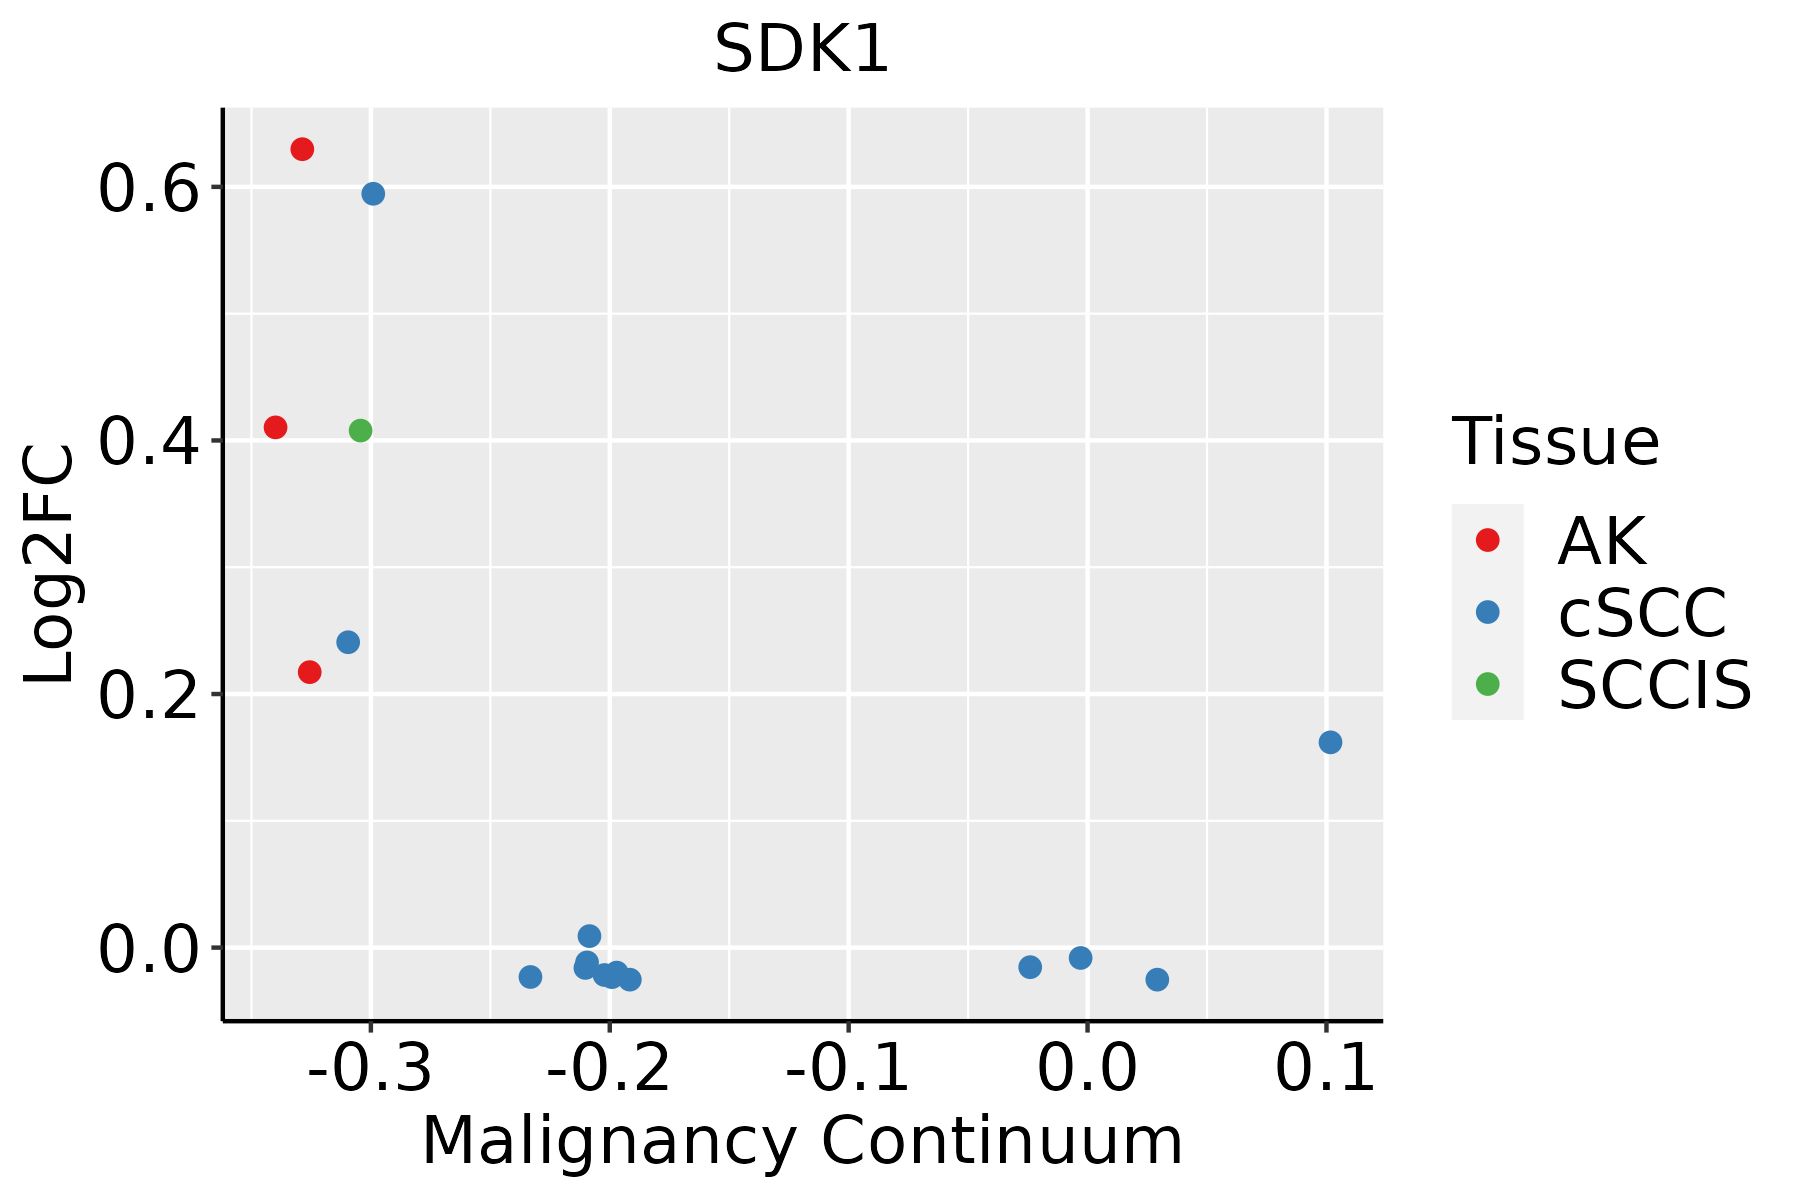 | AK: Actinic keratosis |
| cSCC: Cutaneous squamous cell carcinoma | ||
| SCCIS:squamous cell carcinoma in situ |
| ∗log2FC in expression of this searched gene in stem-like cells from each diseased tissue sample relative to stem-like cells in normal samples in each tissue plotted against the malignancy continuum. Samples are colored based on if they are from different disease stage. |
Top |
Malignant transformation related pathway analysis |
| Find out the enriched GO biological processes and KEGG pathways involved in transition from healthy to precancer to cancer |
| Tissue | Disease Stage | Enriched GO biological Processes |
| Colorectum | AD |  |
| Colorectum | SER |  |
| Colorectum | MSS |  |
| Colorectum | MSI-H |  |
| Colorectum | FAP |  |
| ∗Top 15 enriched GO BP terms are showed in the bar plot of each disease state in each tissue. Each row represents a significant GO biological process which is colored according to the -log10(p.adjust). |
| Page: 1 2 3 4 5 6 7 8 9 |
| GO ID | Tissue | Disease Stage | Description | Gene Ratio | Bg Ratio | pvalue | p.adjust | Count |
| GO:00343298 | Cervix | CC | cell junction assembly | 88/2311 | 420/18723 | 3.42e-07 | 1.38e-05 | 88 |
| GO:00163587 | Cervix | CC | dendrite development | 58/2311 | 243/18723 | 4.52e-07 | 1.76e-05 | 58 |
| GO:00609965 | Cervix | CC | dendritic spine development | 28/2311 | 99/18723 | 1.61e-05 | 3.15e-04 | 28 |
| GO:00609984 | Cervix | CC | regulation of dendritic spine development | 18/2311 | 61/18723 | 2.84e-04 | 3.07e-03 | 18 |
| GO:0150063 | Cervix | CC | visual system development | 63/2311 | 375/18723 | 6.58e-03 | 3.65e-02 | 63 |
| GO:0001654 | Cervix | CC | eye development | 62/2311 | 371/18723 | 7.83e-03 | 4.13e-02 | 62 |
| GO:0048880 | Cervix | CC | sensory system development | 63/2311 | 381/18723 | 9.29e-03 | 4.66e-02 | 63 |
| GO:00343299 | Endometrium | AEH | cell junction assembly | 78/2100 | 420/18723 | 4.80e-06 | 1.24e-04 | 78 |
| GO:00163588 | Endometrium | AEH | dendrite development | 46/2100 | 243/18723 | 2.56e-04 | 3.03e-03 | 46 |
| GO:00508086 | Endometrium | AEH | synapse organization | 67/2100 | 426/18723 | 2.67e-03 | 1.94e-02 | 67 |
| GO:003432914 | Endometrium | EEC | cell junction assembly | 79/2168 | 420/18723 | 8.37e-06 | 1.85e-04 | 79 |
| GO:001635813 | Endometrium | EEC | dendrite development | 44/2168 | 243/18723 | 1.72e-03 | 1.34e-02 | 44 |
| GO:005080812 | Endometrium | EEC | synapse organization | 68/2168 | 426/18723 | 3.73e-03 | 2.49e-02 | 68 |
| GO:00343297 | Lung | IAC | cell junction assembly | 86/2061 | 420/18723 | 7.98e-09 | 1.10e-06 | 86 |
| GO:00163586 | Lung | IAC | dendrite development | 55/2061 | 243/18723 | 1.35e-07 | 1.18e-05 | 55 |
| GO:00609964 | Lung | IAC | dendritic spine development | 25/2061 | 99/18723 | 5.18e-05 | 1.18e-03 | 25 |
| GO:00609983 | Lung | IAC | regulation of dendritic spine development | 16/2061 | 61/18723 | 7.09e-04 | 9.50e-03 | 16 |
| GO:00508085 | Lung | IAC | synapse organization | 65/2061 | 426/18723 | 4.05e-03 | 3.31e-02 | 65 |
| GO:003432912 | Lung | AIS | cell junction assembly | 84/1849 | 420/18723 | 2.16e-10 | 5.71e-08 | 84 |
| GO:001635812 | Lung | AIS | dendrite development | 49/1849 | 243/18723 | 9.53e-07 | 6.69e-05 | 49 |
| Page: 1 2 3 4 |
| Pathway ID | Tissue | Disease Stage | Description | Gene Ratio | Bg Ratio | pvalue | p.adjust | qvalue | Count |
| Page: 1 |
Top |
Cell-cell communication analysis |
| Identification of potential cell-cell interactions between two cell types and their ligand-receptor pairs for different disease states |
| Ligand | Receptor | LRpair | Pathway | Tissue | Disease Stage |
| Page: 1 |
Top |
Single-cell gene regulatory network inference analysis |
| Find out the significant the regulons (TFs) and the target genes of each regulon across cell types for different disease states |
| TF | Cell Type | Tissue | Disease Stage | Target Gene | RSS | Regulon Activity |
| ∗The dot plots of a searched regulon are shown for all cell subpopulations in each disease state of each tissue based on the regulon specific score inferred using pySCENIC and by calculating the average expression. |
| Page: 1 |
Top |
Somatic mutation of malignant transformation related genes |
| Annotation of somatic variants for genes involved in malignant transformation |
| Hugo Symbol | Variant Class | Variant Classification | dbSNP RS | HGVSc | HGVSp | HGVSp Short | SWISSPROT | BIOTYPE | SIFT | PolyPhen | Tumor Sample Barcode | Tissue | Histology | Sex | Age | Stage | Therapy Types | Drugs | Outcome |
| SDK1 | SNV | Missense_Mutation | c.4370N>A | p.Arg1457Lys | p.R1457K | Q7Z5N4 | protein_coding | deleterious(0.04) | benign(0.171) | TCGA-A1-A0SP-01 | Breast | breast invasive carcinoma | Female | <65 | I/II | Chemotherapy | SD | ||
| SDK1 | SNV | Missense_Mutation | rs147295784 | c.5981N>T | p.Thr1994Met | p.T1994M | Q7Z5N4 | protein_coding | tolerated(0.11) | benign(0.006) | TCGA-A7-A13D-01 | Breast | breast invasive carcinoma | Female | <65 | I/II | Chemotherapy | cytoxan | SD |
| SDK1 | SNV | Missense_Mutation | novel | c.806N>A | p.Gly269Glu | p.G269E | Q7Z5N4 | protein_coding | deleterious(0) | probably_damaging(0.997) | TCGA-AC-A23H-01 | Breast | breast invasive carcinoma | Female | >=65 | I/II | Unknown | Unknown | PD |
| SDK1 | SNV | Missense_Mutation | novel | c.3827N>T | p.Pro1276Leu | p.P1276L | Q7Z5N4 | protein_coding | deleterious(0) | probably_damaging(0.999) | TCGA-AC-A23H-01 | Breast | breast invasive carcinoma | Female | >=65 | I/II | Unknown | Unknown | PD |
| SDK1 | SNV | Missense_Mutation | novel | c.3901N>A | p.Pro1301Thr | p.P1301T | Q7Z5N4 | protein_coding | deleterious(0) | probably_damaging(1) | TCGA-AC-A3EH-01 | Breast | breast invasive carcinoma | Female | >=65 | III/IV | Unknown | Unknown | SD |
| SDK1 | SNV | Missense_Mutation | novel | c.3008C>A | p.Thr1003Asn | p.T1003N | Q7Z5N4 | protein_coding | deleterious(0) | benign(0.391) | TCGA-AN-A046-01 | Breast | breast invasive carcinoma | Female | >=65 | I/II | Unknown | Unknown | SD |
| SDK1 | SNV | Missense_Mutation | novel | c.3170C>T | p.Thr1057Ile | p.T1057I | Q7Z5N4 | protein_coding | deleterious(0.01) | probably_damaging(0.996) | TCGA-AN-A046-01 | Breast | breast invasive carcinoma | Female | >=65 | I/II | Unknown | Unknown | SD |
| SDK1 | SNV | Missense_Mutation | c.2213N>T | p.Thr738Ile | p.T738I | Q7Z5N4 | protein_coding | deleterious(0) | probably_damaging(0.966) | TCGA-AO-A128-01 | Breast | breast invasive carcinoma | Female | <65 | I/II | Chemotherapy | doxorubicin | SD | |
| SDK1 | SNV | Missense_Mutation | rs140259802 | c.2764N>G | p.Thr922Ala | p.T922A | Q7Z5N4 | protein_coding | deleterious(0.01) | possibly_damaging(0.78) | TCGA-AR-A1AJ-01 | Breast | breast invasive carcinoma | Female | >=65 | I/II | Unknown | Unknown | SD |
| SDK1 | SNV | Missense_Mutation | rs201132659 | c.5906N>A | p.Arg1969Gln | p.R1969Q | Q7Z5N4 | protein_coding | tolerated(0.09) | benign(0.187) | TCGA-AR-A252-01 | Breast | breast invasive carcinoma | Female | <65 | I/II | Chemotherapy | doxorubicin | SD |
| Page: 1 2 3 4 5 6 7 8 9 10 11 12 13 14 15 16 17 18 19 20 21 22 23 24 25 26 27 28 29 30 31 32 33 34 35 36 37 38 39 |
Top |
Related drugs of malignant transformation related genes |
| Identification of chemicals and drugs interact with genes involved in malignant transfromation |
| (DGIdb 4.0) |
| Entrez ID | Symbol | Category | Interaction Types | Drug Claim Name | Drug Name | PMIDs |
| Page: 1 |

Copyright 2023-Present -The University of Texas Health Science Center at Houston |