
|
|||||
|
 | |
| |
| |
| |
| |
| |
|
Gene: SDHAF2 |
Gene summary for SDHAF2 |
| Gene information | Species | Human | Gene symbol | SDHAF2 | Gene ID | 54949 |
| Gene name | succinate dehydrogenase complex assembly factor 2 | |
| Gene Alias | C11orf79 | |
| Cytomap | 11q12.2 | |
| Gene Type | protein-coding | GO ID | GO:0001837 | UniProtAcc | Q9NX18 |
Top |
Malignant transformation analysis |
| Identification of the aberrant gene expression in precancerous and cancerous lesions by comparing the gene expression of stem-like cells in diseased tissues with normal stem cells |
| Entrez ID | Symbol | Replicates | Species | Organ | Tissue | Adj P-value | Log2FC | Malignancy |
| 54949 | SDHAF2 | HTA11_2487_2000001011 | Human | Colorectum | SER | 3.37e-03 | 1.53e-01 | -0.1808 |
| 54949 | SDHAF2 | HTA11_1938_2000001011 | Human | Colorectum | AD | 1.73e-09 | 3.19e-01 | -0.0811 |
| 54949 | SDHAF2 | HTA11_78_2000001011 | Human | Colorectum | AD | 6.68e-05 | 1.68e-01 | -0.1088 |
| 54949 | SDHAF2 | HTA11_347_2000001011 | Human | Colorectum | AD | 4.93e-10 | 2.00e-01 | -0.1954 |
| 54949 | SDHAF2 | HTA11_411_2000001011 | Human | Colorectum | SER | 1.86e-06 | 5.05e-01 | -0.2602 |
| 54949 | SDHAF2 | HTA11_3361_2000001011 | Human | Colorectum | AD | 3.26e-04 | 1.57e-01 | -0.1207 |
| 54949 | SDHAF2 | HTA11_83_2000001011 | Human | Colorectum | SER | 8.73e-04 | 2.18e-01 | -0.1526 |
| 54949 | SDHAF2 | HTA11_696_2000001011 | Human | Colorectum | AD | 1.73e-12 | 2.39e-01 | -0.1464 |
| 54949 | SDHAF2 | HTA11_866_2000001011 | Human | Colorectum | AD | 1.82e-03 | 1.27e-01 | -0.1001 |
| 54949 | SDHAF2 | HTA11_1391_2000001011 | Human | Colorectum | AD | 7.00e-13 | 3.03e-01 | -0.059 |
| 54949 | SDHAF2 | HTA11_2992_2000001011 | Human | Colorectum | SER | 2.31e-08 | 3.79e-01 | -0.1706 |
| 54949 | SDHAF2 | HTA11_546_2000001011 | Human | Colorectum | AD | 7.78e-03 | 1.52e-01 | -0.0842 |
| 54949 | SDHAF2 | HTA11_866_3004761011 | Human | Colorectum | AD | 2.32e-06 | 1.60e-01 | 0.096 |
| 54949 | SDHAF2 | HTA11_7696_3000711011 | Human | Colorectum | AD | 1.92e-04 | 1.22e-01 | 0.0674 |
| 54949 | SDHAF2 | HTA11_99999970781_79442 | Human | Colorectum | MSS | 2.07e-07 | 1.71e-01 | 0.294 |
| 54949 | SDHAF2 | HTA11_99999971662_82457 | Human | Colorectum | MSS | 6.35e-15 | 3.20e-01 | 0.3859 |
| 54949 | SDHAF2 | HTA11_99999973899_84307 | Human | Colorectum | MSS | 5.51e-09 | 3.22e-01 | 0.2585 |
| 54949 | SDHAF2 | HTA11_99999974143_84620 | Human | Colorectum | MSS | 4.38e-06 | 1.42e-01 | 0.3005 |
| 54949 | SDHAF2 | LZE3D | Human | Esophagus | HGIN | 9.53e-03 | 4.42e-01 | 0.0668 |
| 54949 | SDHAF2 | LZE4T | Human | Esophagus | ESCC | 7.27e-19 | 5.45e-01 | 0.0811 |
| Page: 1 2 3 4 5 6 |
| Tissue | Expression Dynamics | Abbreviation |
| Colorectum (GSE201348) |  | FAP: Familial adenomatous polyposis |
| CRC: Colorectal cancer | ||
| Colorectum (HTA11) |  | AD: Adenomas |
| SER: Sessile serrated lesions | ||
| MSI-H: Microsatellite-high colorectal cancer | ||
| MSS: Microsatellite stable colorectal cancer | ||
| Esophagus | 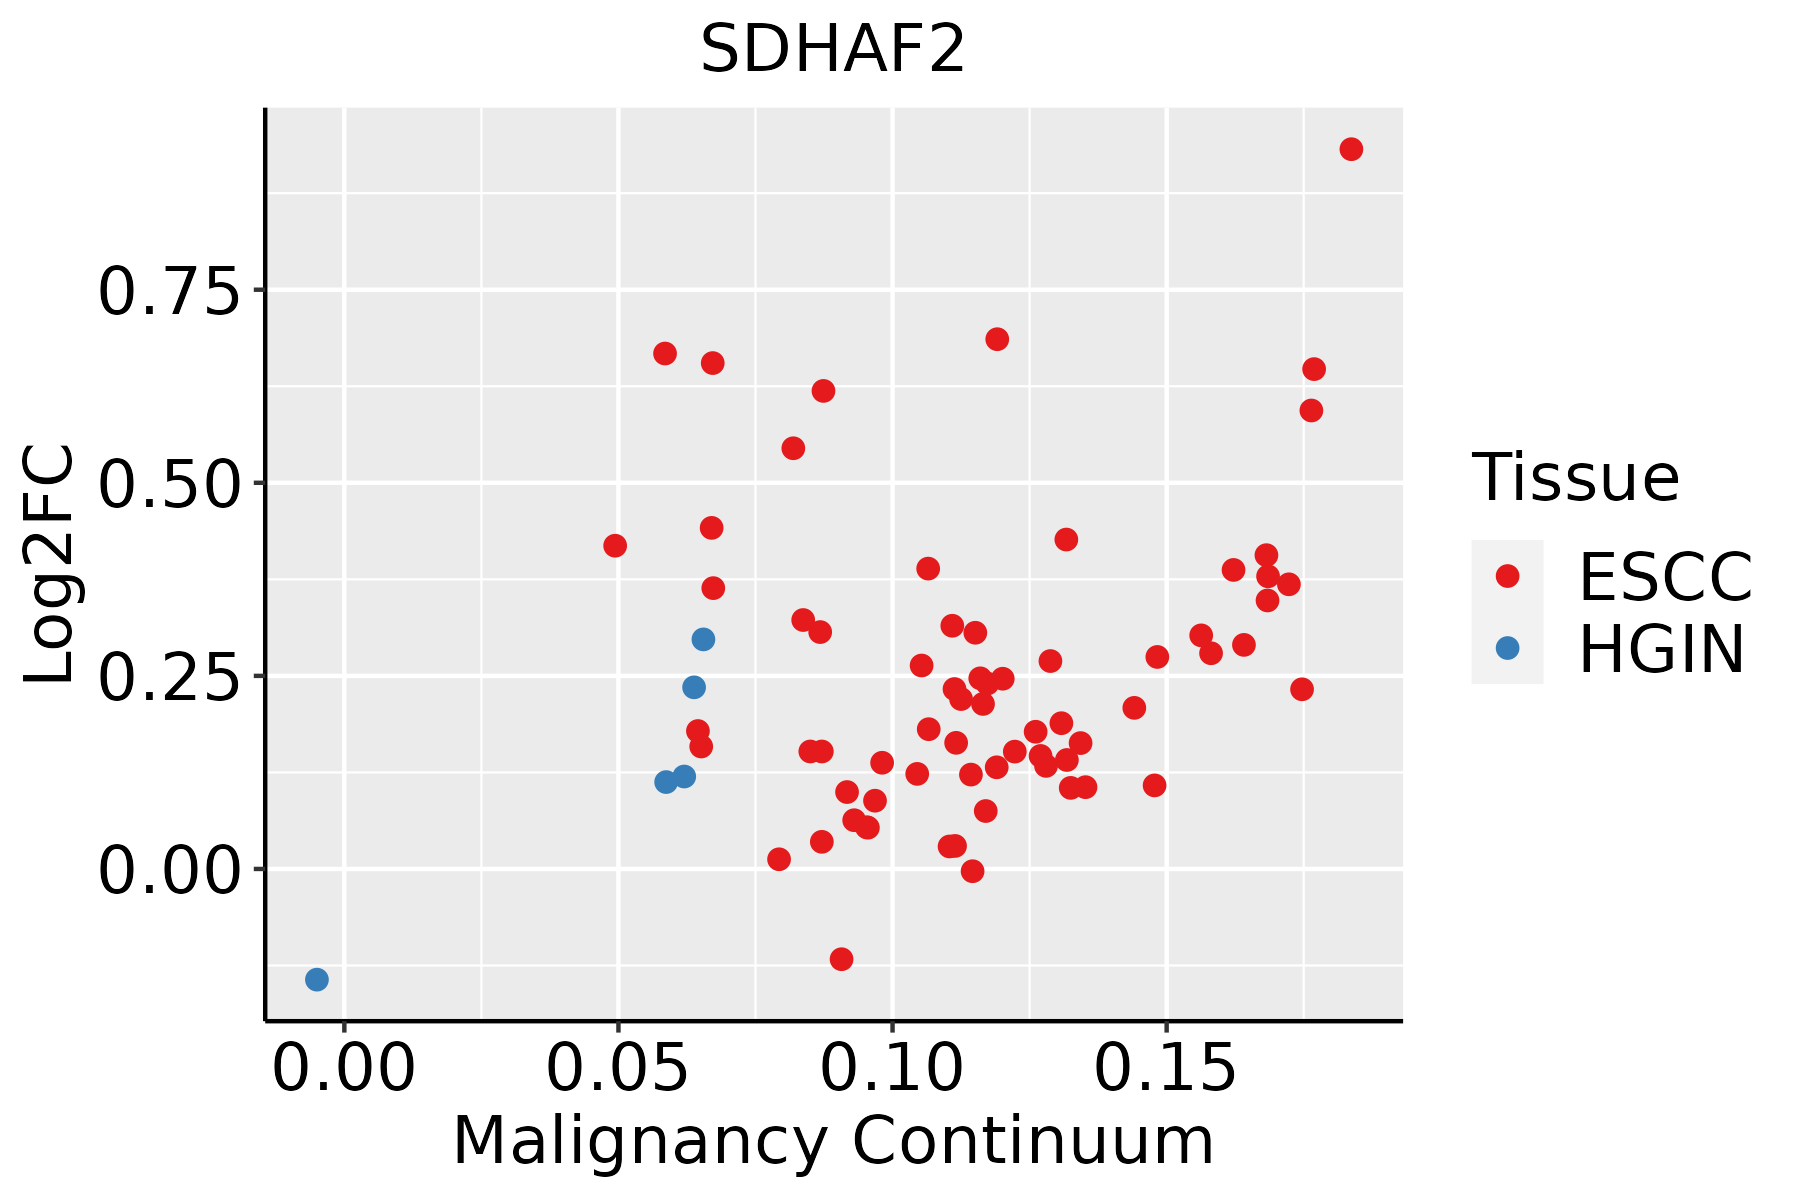 | ESCC: Esophageal squamous cell carcinoma |
| HGIN: High-grade intraepithelial neoplasias | ||
| LGIN: Low-grade intraepithelial neoplasias | ||
| Liver |  | HCC: Hepatocellular carcinoma |
| NAFLD: Non-alcoholic fatty liver disease | ||
| Oral Cavity |  | EOLP: Erosive Oral lichen planus |
| LP: leukoplakia | ||
| NEOLP: Non-erosive oral lichen planus | ||
| OSCC: Oral squamous cell carcinoma | ||
| Skin | 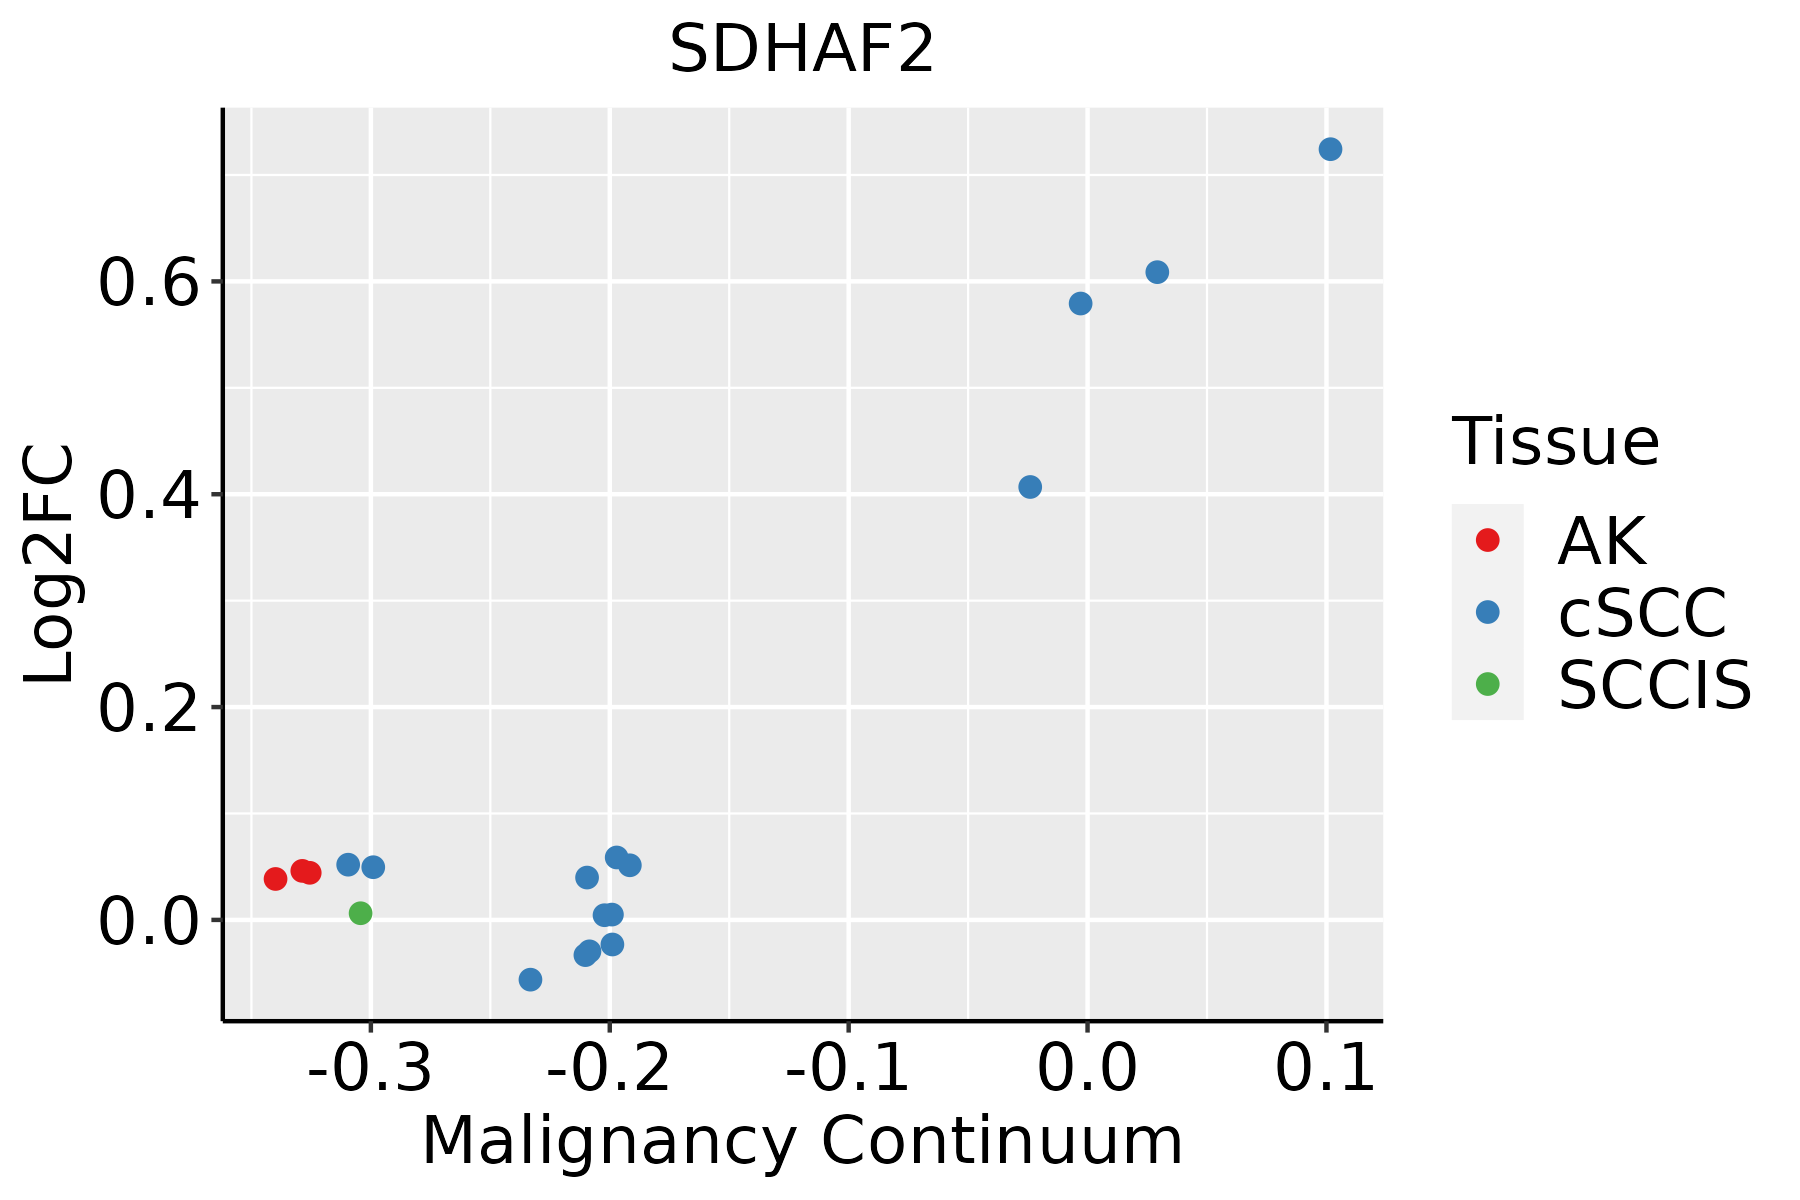 | AK: Actinic keratosis |
| cSCC: Cutaneous squamous cell carcinoma | ||
| SCCIS:squamous cell carcinoma in situ |
| ∗log2FC in expression of this searched gene in stem-like cells from each diseased tissue sample relative to stem-like cells in normal samples in each tissue plotted against the malignancy continuum. Samples are colored based on if they are from different disease stage. |
Top |
Malignant transformation related pathway analysis |
| Find out the enriched GO biological processes and KEGG pathways involved in transition from healthy to precancer to cancer |
| Tissue | Disease Stage | Enriched GO biological Processes |
| Colorectum | AD |  |
| Colorectum | SER |  |
| Colorectum | MSS |  |
| Colorectum | MSI-H |  |
| Colorectum | FAP |  |
| ∗Top 15 enriched GO BP terms are showed in the bar plot of each disease state in each tissue. Each row represents a significant GO biological process which is colored according to the -log10(p.adjust). |
| Page: 1 2 3 4 5 6 7 8 9 |
| GO ID | Tissue | Disease Stage | Description | Gene Ratio | Bg Ratio | pvalue | p.adjust | Count |
| GO:0046034 | Colorectum | AD | ATP metabolic process | 142/3918 | 277/18723 | 2.64e-29 | 8.26e-26 | 142 |
| GO:0006091 | Colorectum | AD | generation of precursor metabolites and energy | 209/3918 | 490/18723 | 3.17e-28 | 6.61e-25 | 209 |
| GO:0009060 | Colorectum | AD | aerobic respiration | 108/3918 | 189/18723 | 9.14e-28 | 1.43e-24 | 108 |
| GO:0045333 | Colorectum | AD | cellular respiration | 119/3918 | 230/18723 | 3.21e-25 | 4.02e-22 | 119 |
| GO:0006119 | Colorectum | AD | oxidative phosphorylation | 83/3918 | 141/18723 | 7.95e-23 | 8.30e-20 | 83 |
| GO:0015980 | Colorectum | AD | energy derivation by oxidation of organic compounds | 143/3918 | 318/18723 | 2.78e-22 | 2.49e-19 | 143 |
| GO:0022900 | Colorectum | AD | electron transport chain | 89/3918 | 175/18723 | 1.42e-18 | 8.91e-16 | 89 |
| GO:0019646 | Colorectum | AD | aerobic electron transport chain | 53/3918 | 87/18723 | 5.58e-16 | 2.16e-13 | 53 |
| GO:0042773 | Colorectum | AD | ATP synthesis coupled electron transport | 56/3918 | 95/18723 | 6.76e-16 | 2.22e-13 | 56 |
| GO:0042775 | Colorectum | AD | mitochondrial ATP synthesis coupled electron transport | 56/3918 | 95/18723 | 6.76e-16 | 2.22e-13 | 56 |
| GO:0022904 | Colorectum | AD | respiratory electron transport chain | 63/3918 | 114/18723 | 8.23e-16 | 2.45e-13 | 63 |
| GO:0033108 | Colorectum | AD | mitochondrial respiratory chain complex assembly | 46/3918 | 93/18723 | 8.95e-10 | 6.91e-08 | 46 |
| GO:0006099 | Colorectum | AD | tricarboxylic acid cycle | 19/3918 | 30/18723 | 5.82e-07 | 2.09e-05 | 19 |
| GO:0030111 | Colorectum | AD | regulation of Wnt signaling pathway | 102/3918 | 328/18723 | 8.51e-06 | 2.03e-04 | 102 |
| GO:0016055 | Colorectum | AD | Wnt signaling pathway | 130/3918 | 444/18723 | 1.60e-05 | 3.37e-04 | 130 |
| GO:0016311 | Colorectum | AD | dephosphorylation | 123/3918 | 417/18723 | 1.84e-05 | 3.82e-04 | 123 |
| GO:0198738 | Colorectum | AD | cell-cell signaling by wnt | 130/3918 | 446/18723 | 2.02e-05 | 4.10e-04 | 130 |
| GO:0006470 | Colorectum | AD | protein dephosphorylation | 88/3918 | 281/18723 | 2.56e-05 | 4.89e-04 | 88 |
| GO:0060070 | Colorectum | AD | canonical Wnt signaling pathway | 90/3918 | 303/18723 | 1.76e-04 | 2.38e-03 | 90 |
| GO:0060828 | Colorectum | AD | regulation of canonical Wnt signaling pathway | 77/3918 | 253/18723 | 2.19e-04 | 2.87e-03 | 77 |
| Page: 1 2 3 4 5 6 7 8 9 10 |
| Pathway ID | Tissue | Disease Stage | Description | Gene Ratio | Bg Ratio | pvalue | p.adjust | qvalue | Count |
| Page: 1 |
Top |
Cell-cell communication analysis |
| Identification of potential cell-cell interactions between two cell types and their ligand-receptor pairs for different disease states |
| Ligand | Receptor | LRpair | Pathway | Tissue | Disease Stage |
| Page: 1 |
Top |
Single-cell gene regulatory network inference analysis |
| Find out the significant the regulons (TFs) and the target genes of each regulon across cell types for different disease states |
| TF | Cell Type | Tissue | Disease Stage | Target Gene | RSS | Regulon Activity |
| ∗The dot plots of a searched regulon are shown for all cell subpopulations in each disease state of each tissue based on the regulon specific score inferred using pySCENIC and by calculating the average expression. |
| Page: 1 |
Top |
Somatic mutation of malignant transformation related genes |
| Annotation of somatic variants for genes involved in malignant transformation |
| Hugo Symbol | Variant Class | Variant Classification | dbSNP RS | HGVSc | HGVSp | HGVSp Short | SWISSPROT | BIOTYPE | SIFT | PolyPhen | Tumor Sample Barcode | Tissue | Histology | Sex | Age | Stage | Therapy Types | Drugs | Outcome |
| SDHAF2 | SNV | Missense_Mutation | c.251N>C | p.Ile84Thr | p.I84T | Q9NX18 | protein_coding | deleterious(0) | probably_damaging(0.998) | TCGA-AN-A0XS-01 | Breast | breast invasive carcinoma | Female | <65 | III/IV | Unknown | Unknown | SD | |
| SDHAF2 | SNV | Missense_Mutation | rs145616631 | c.331N>A | p.Glu111Lys | p.E111K | Q9NX18 | protein_coding | tolerated(0.67) | possibly_damaging(0.827) | TCGA-B6-A1KF-01 | Breast | breast invasive carcinoma | Female | >=65 | I/II | Unknown | Unknown | SD |
| SDHAF2 | SNV | Missense_Mutation | c.29N>T | p.Ser10Leu | p.S10L | Q9NX18 | protein_coding | tolerated_low_confidence(0.83) | benign(0) | TCGA-Q1-A73O-01 | Cervix | cervical & endocervical cancer | Female | <65 | I/II | Chemotherapy | cisplatin | CR | |
| SDHAF2 | SNV | Missense_Mutation | c.135G>T | p.Lys45Asn | p.K45N | Q9NX18 | protein_coding | tolerated(0.17) | benign(0.036) | TCGA-A6-6141-01 | Colorectum | colon adenocarcinoma | Male | <65 | I/II | Chemotherapy | 5-fu | SD | |
| SDHAF2 | SNV | Missense_Mutation | rs778585796 | c.460N>T | p.Arg154Cys | p.R154C | Q9NX18 | protein_coding | tolerated(0.09) | probably_damaging(0.952) | TCGA-AA-A01R-01 | Colorectum | colon adenocarcinoma | Male | <65 | III/IV | Chemotherapy | 5-fluorouracil | PD |
| SDHAF2 | SNV | Missense_Mutation | c.262C>A | p.Leu88Ile | p.L88I | Q9NX18 | protein_coding | tolerated(0.13) | possibly_damaging(0.802) | TCGA-CA-6718-01 | Colorectum | colon adenocarcinoma | Male | <65 | I/II | Unknown | Unknown | PD | |
| SDHAF2 | insertion | Frame_Shift_Ins | novel | c.224_225insA | p.Arg77GlufsTer11 | p.R77Efs*11 | Q9NX18 | protein_coding | TCGA-F4-6463-01 | Colorectum | colon adenocarcinoma | Male | <65 | I/II | Unknown | Unknown | SD | ||
| SDHAF2 | SNV | Missense_Mutation | c.44N>A | p.Ala15Asp | p.A15D | Q9NX18 | protein_coding | tolerated_low_confidence(0.13) | benign(0.091) | TCGA-AP-A056-01 | Endometrium | uterine corpus endometrioid carcinoma | Female | <65 | I/II | Unknown | Unknown | SD | |
| SDHAF2 | SNV | Missense_Mutation | c.253N>A | p.Leu85Ile | p.L85I | Q9NX18 | protein_coding | tolerated(0.13) | probably_damaging(0.998) | TCGA-BS-A0UV-01 | Endometrium | uterine corpus endometrioid carcinoma | Female | <65 | III/IV | Unknown | Unknown | SD | |
| SDHAF2 | SNV | Missense_Mutation | novel | c.152N>A | p.Pro51His | p.P51H | Q9NX18 | protein_coding | deleterious(0) | possibly_damaging(0.87) | TCGA-DF-A2KN-01 | Endometrium | uterine corpus endometrioid carcinoma | Female | Unknown | I/II | Unknown | Unknown | SD |
| Page: 1 2 3 |
Top |
Related drugs of malignant transformation related genes |
| Identification of chemicals and drugs interact with genes involved in malignant transfromation |
| (DGIdb 4.0) |
| Entrez ID | Symbol | Category | Interaction Types | Drug Claim Name | Drug Name | PMIDs |
| Page: 1 |

Copyright 2023-Present -The University of Texas Health Science Center at Houston |