
|
|||||
|
 | |
| |
| |
| |
| |
| |
|
Gene: SDF2L1 |
Gene summary for SDF2L1 |
| Gene information | Species | Human | Gene symbol | SDF2L1 | Gene ID | 23753 |
| Gene name | stromal cell derived factor 2 like 1 | |
| Gene Alias | SDF2L1 | |
| Cytomap | 22q11.21 | |
| Gene Type | protein-coding | GO ID | GO:0006457 | UniProtAcc | Q9HCN8 |
Top |
Malignant transformation analysis |
| Identification of the aberrant gene expression in precancerous and cancerous lesions by comparing the gene expression of stem-like cells in diseased tissues with normal stem cells |
| Entrez ID | Symbol | Replicates | Species | Organ | Tissue | Adj P-value | Log2FC | Malignancy |
| 23753 | SDF2L1 | GSM4909281 | Human | Breast | IDC | 4.21e-21 | 6.54e-01 | 0.21 |
| 23753 | SDF2L1 | GSM4909282 | Human | Breast | IDC | 2.37e-02 | 3.46e-01 | -0.0288 |
| 23753 | SDF2L1 | GSM4909287 | Human | Breast | IDC | 4.28e-04 | 3.58e-01 | 0.2057 |
| 23753 | SDF2L1 | GSM4909291 | Human | Breast | IDC | 6.69e-08 | 4.82e-01 | 0.1753 |
| 23753 | SDF2L1 | GSM4909294 | Human | Breast | IDC | 9.88e-03 | -1.85e-01 | 0.2022 |
| 23753 | SDF2L1 | GSM4909296 | Human | Breast | IDC | 2.17e-03 | 1.81e-01 | 0.1524 |
| 23753 | SDF2L1 | GSM4909297 | Human | Breast | IDC | 4.76e-07 | 3.32e-02 | 0.1517 |
| 23753 | SDF2L1 | GSM4909304 | Human | Breast | IDC | 1.41e-03 | 3.13e-01 | 0.1636 |
| 23753 | SDF2L1 | GSM4909308 | Human | Breast | IDC | 5.72e-11 | 4.13e-01 | 0.158 |
| 23753 | SDF2L1 | GSM4909311 | Human | Breast | IDC | 3.40e-14 | -1.08e-02 | 0.1534 |
| 23753 | SDF2L1 | GSM4909312 | Human | Breast | IDC | 1.04e-02 | 1.56e-01 | 0.1552 |
| 23753 | SDF2L1 | GSM4909315 | Human | Breast | IDC | 2.71e-02 | -2.08e-01 | 0.21 |
| 23753 | SDF2L1 | GSM4909317 | Human | Breast | IDC | 2.32e-05 | 3.45e-01 | 0.1355 |
| 23753 | SDF2L1 | GSM4909319 | Human | Breast | IDC | 3.04e-36 | 2.10e-01 | 0.1563 |
| 23753 | SDF2L1 | GSM4909320 | Human | Breast | IDC | 2.65e-07 | 2.89e-01 | 0.1575 |
| 23753 | SDF2L1 | GSM4909321 | Human | Breast | IDC | 1.28e-09 | 2.11e-01 | 0.1559 |
| 23753 | SDF2L1 | brca1 | Human | Breast | Precancer | 5.13e-04 | 3.17e-01 | -0.0338 |
| 23753 | SDF2L1 | brca2 | Human | Breast | Precancer | 4.50e-11 | 3.92e-01 | -0.024 |
| 23753 | SDF2L1 | NCCBC14 | Human | Breast | DCIS | 8.25e-03 | -1.04e-01 | 0.2021 |
| 23753 | SDF2L1 | NCCBC5 | Human | Breast | DCIS | 2.73e-02 | -6.12e-02 | 0.2046 |
| Page: 1 2 3 4 5 6 7 8 9 10 11 |
| Tissue | Expression Dynamics | Abbreviation |
| Breast | 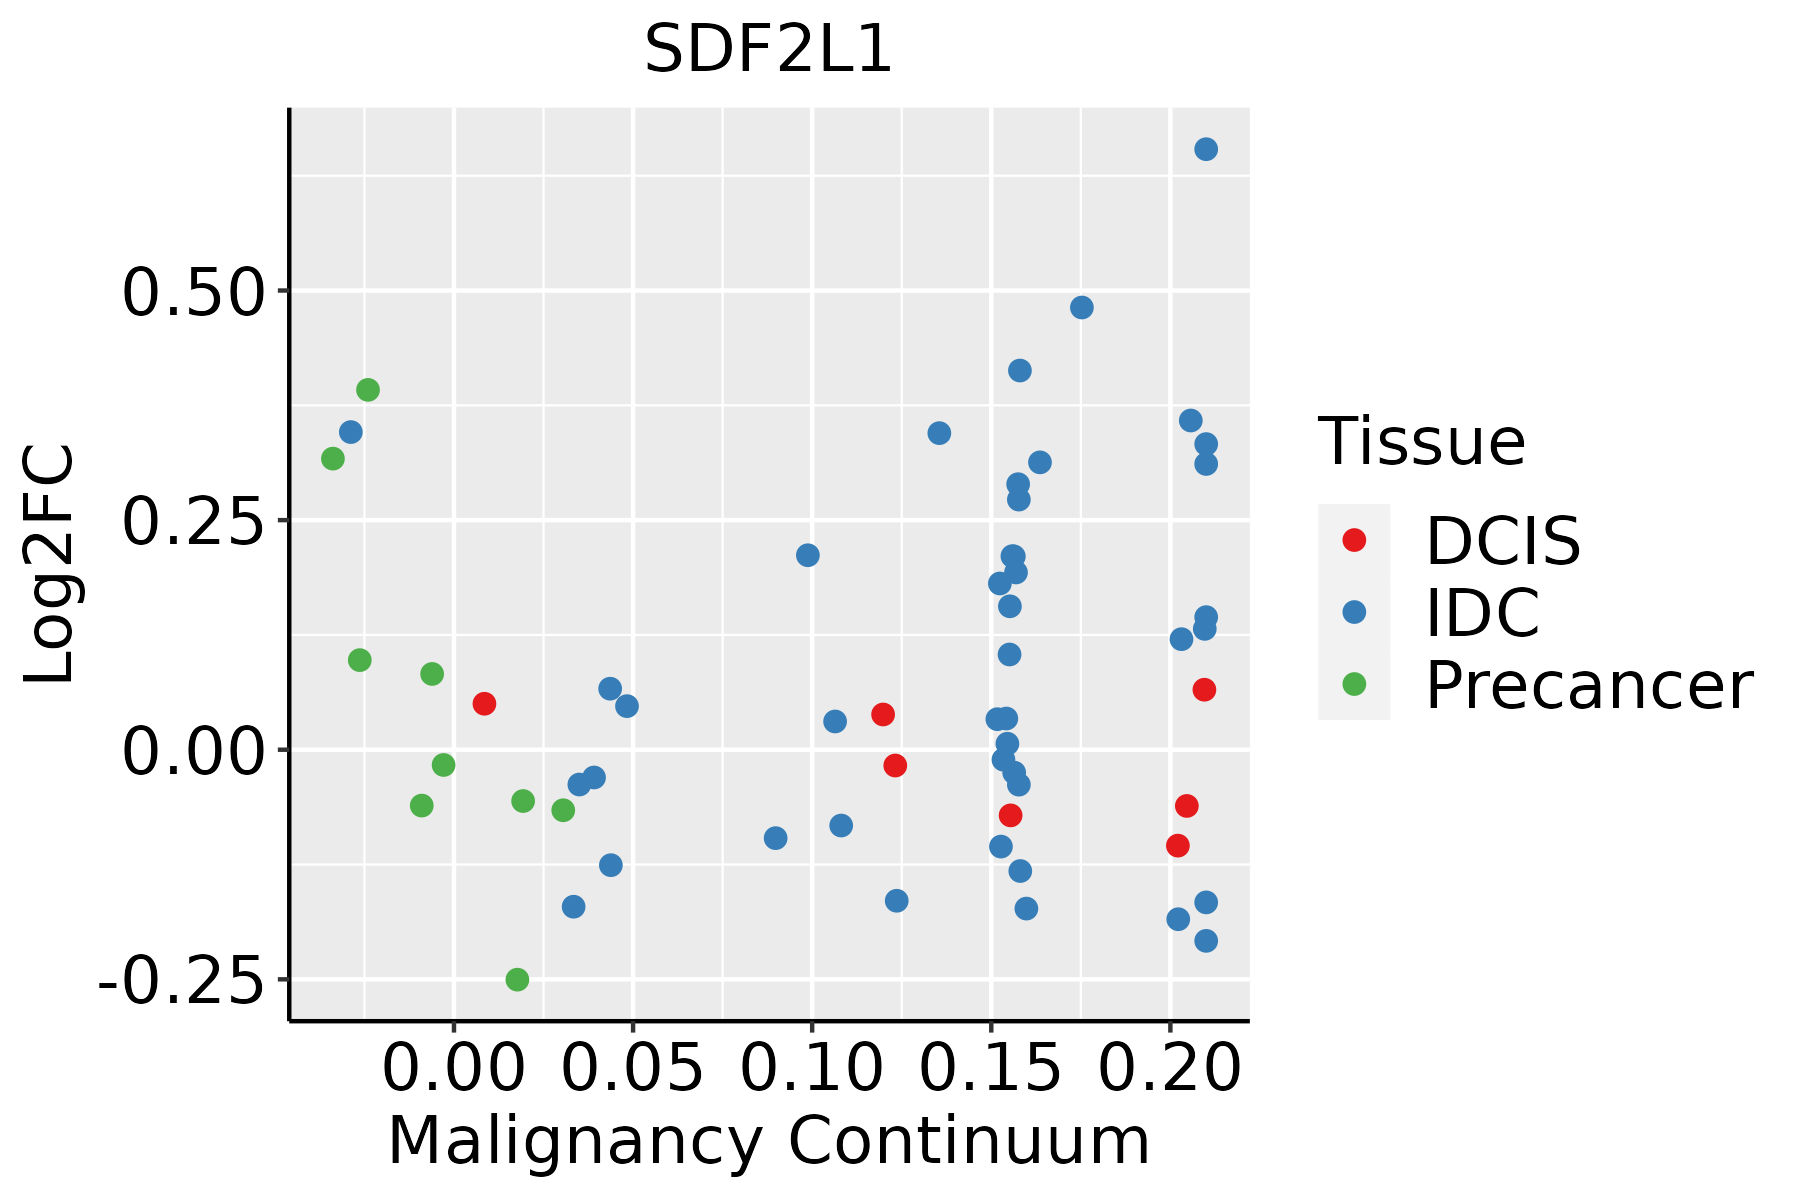 | IDC: Invasive ductal carcinoma |
| DCIS: Ductal carcinoma in situ | ||
| Precancer(BRCA1-mut): Precancerous lesion from BRCA1 mutation carriers | ||
| Colorectum (GSE201348) |  | FAP: Familial adenomatous polyposis |
| CRC: Colorectal cancer | ||
| Colorectum (HTA11) |  | AD: Adenomas |
| SER: Sessile serrated lesions | ||
| MSI-H: Microsatellite-high colorectal cancer | ||
| MSS: Microsatellite stable colorectal cancer | ||
| Esophagus | 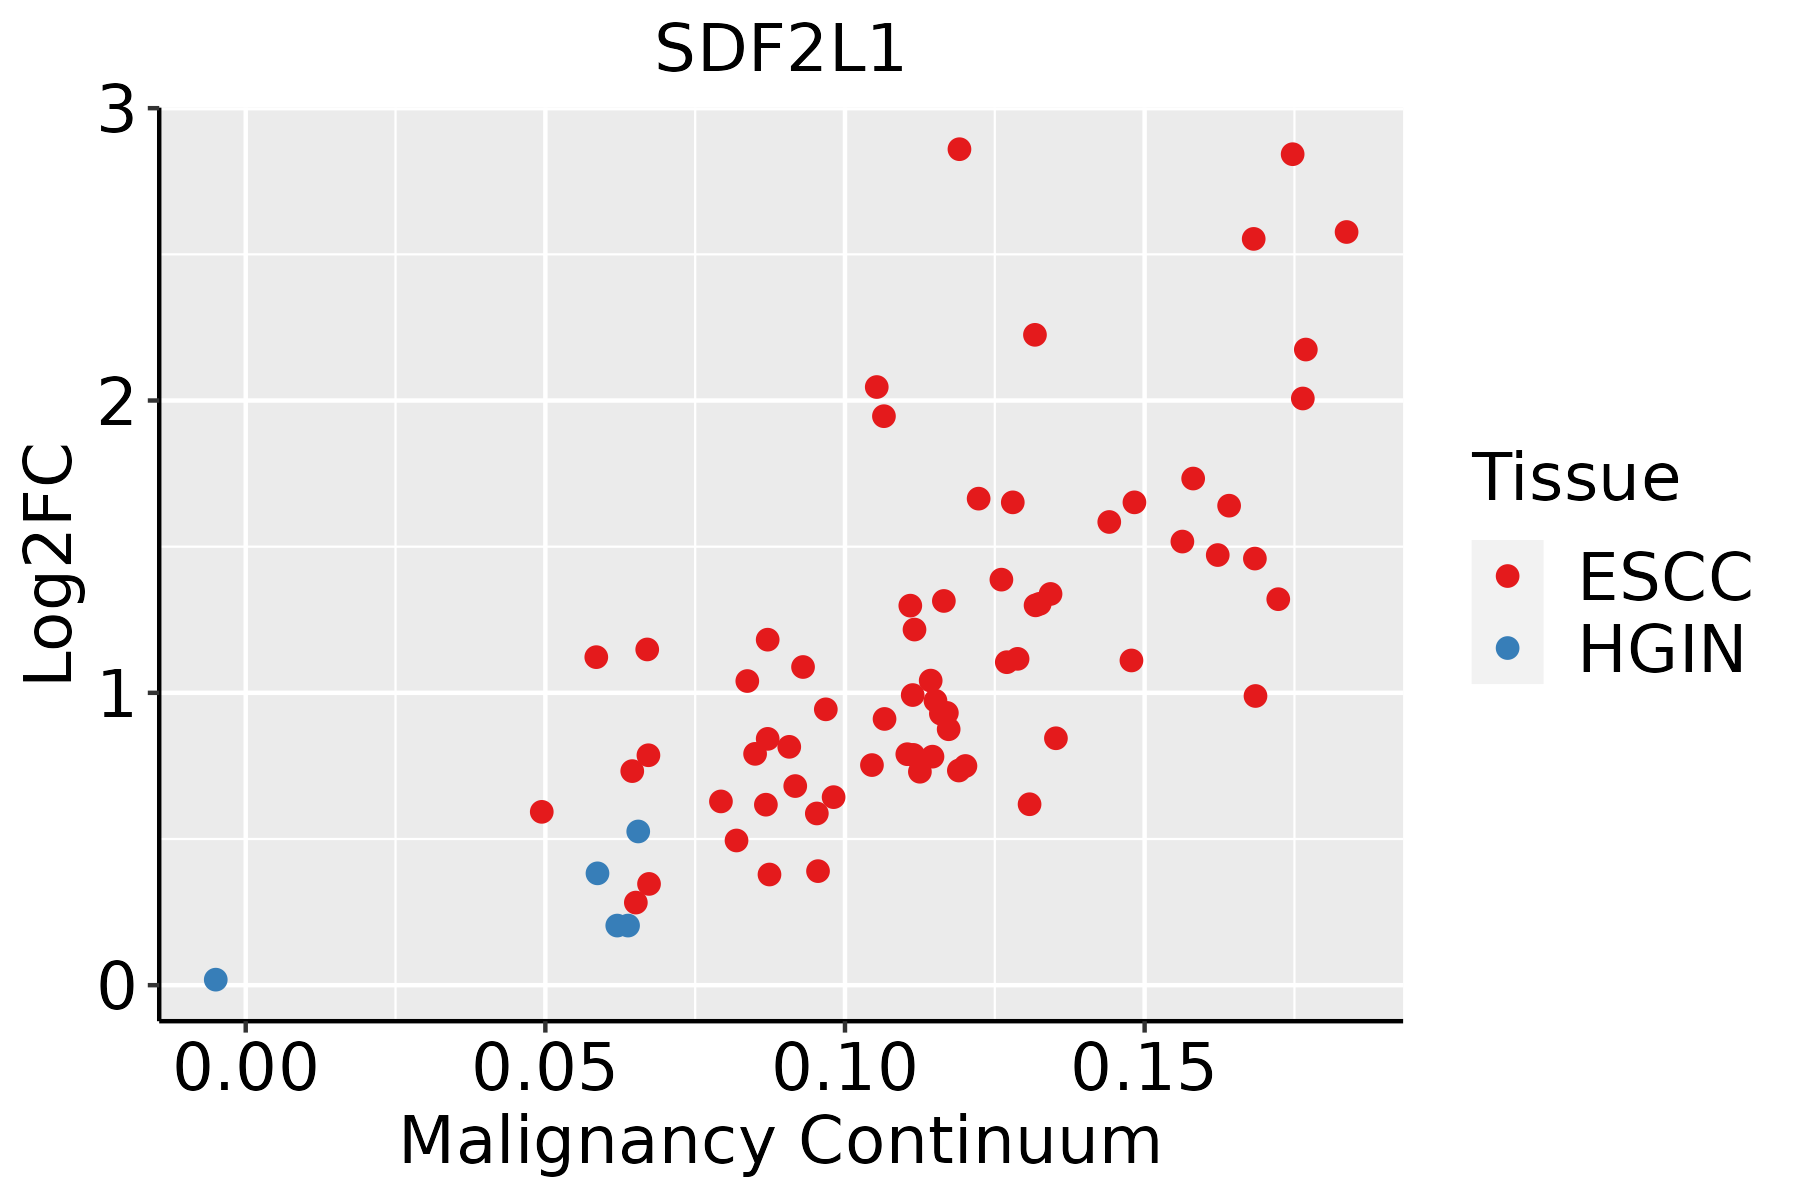 | ESCC: Esophageal squamous cell carcinoma |
| HGIN: High-grade intraepithelial neoplasias | ||
| LGIN: Low-grade intraepithelial neoplasias | ||
| GC |  | CAG: Chronic atrophic gastritis |
| CAG with IM: Chronic atrophic gastritis with intestinal metaplasia | ||
| CSG: Chronic superficial gastritis | ||
| GC: Gastric cancer | ||
| SIM: Severe intestinal metaplasia | ||
| WIM: Wild intestinal metaplasia | ||
| Liver | 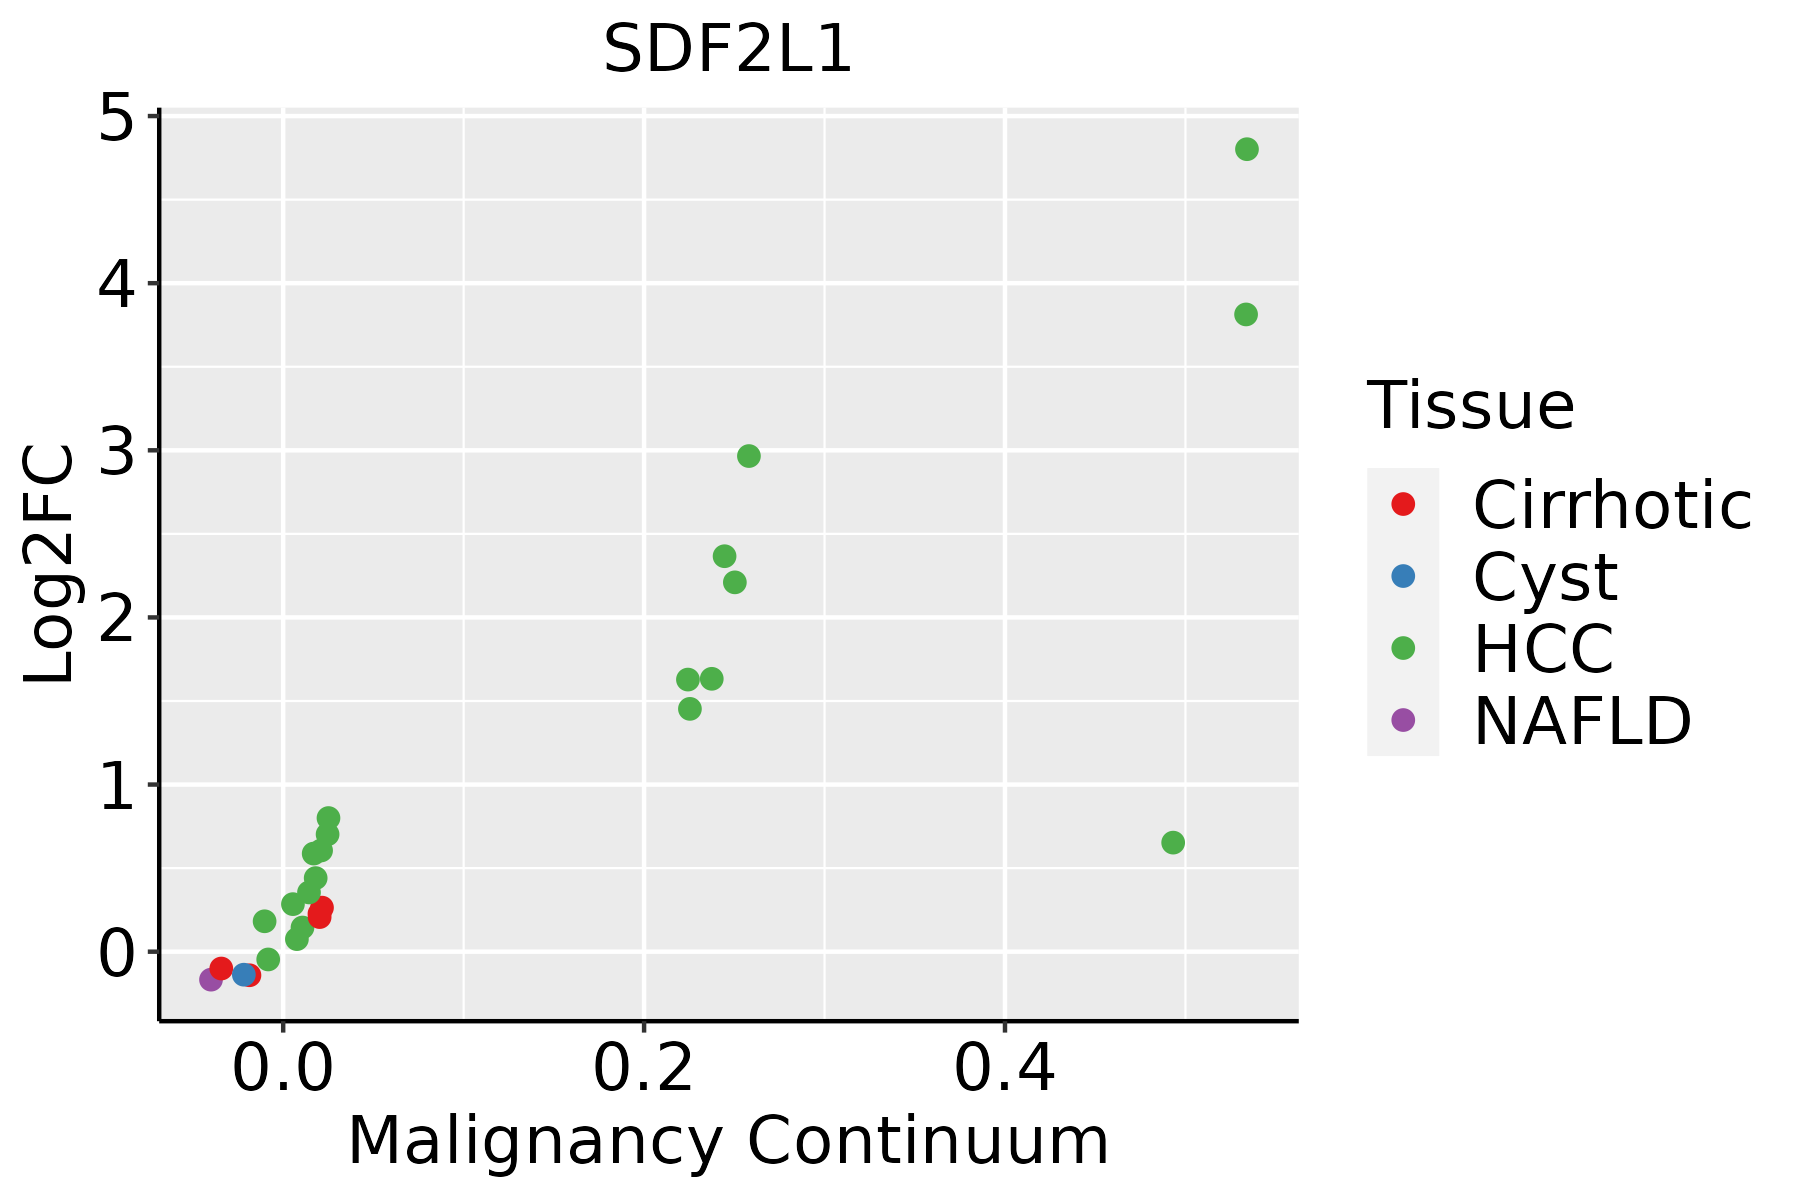 | HCC: Hepatocellular carcinoma |
| NAFLD: Non-alcoholic fatty liver disease | ||
| Oral Cavity | 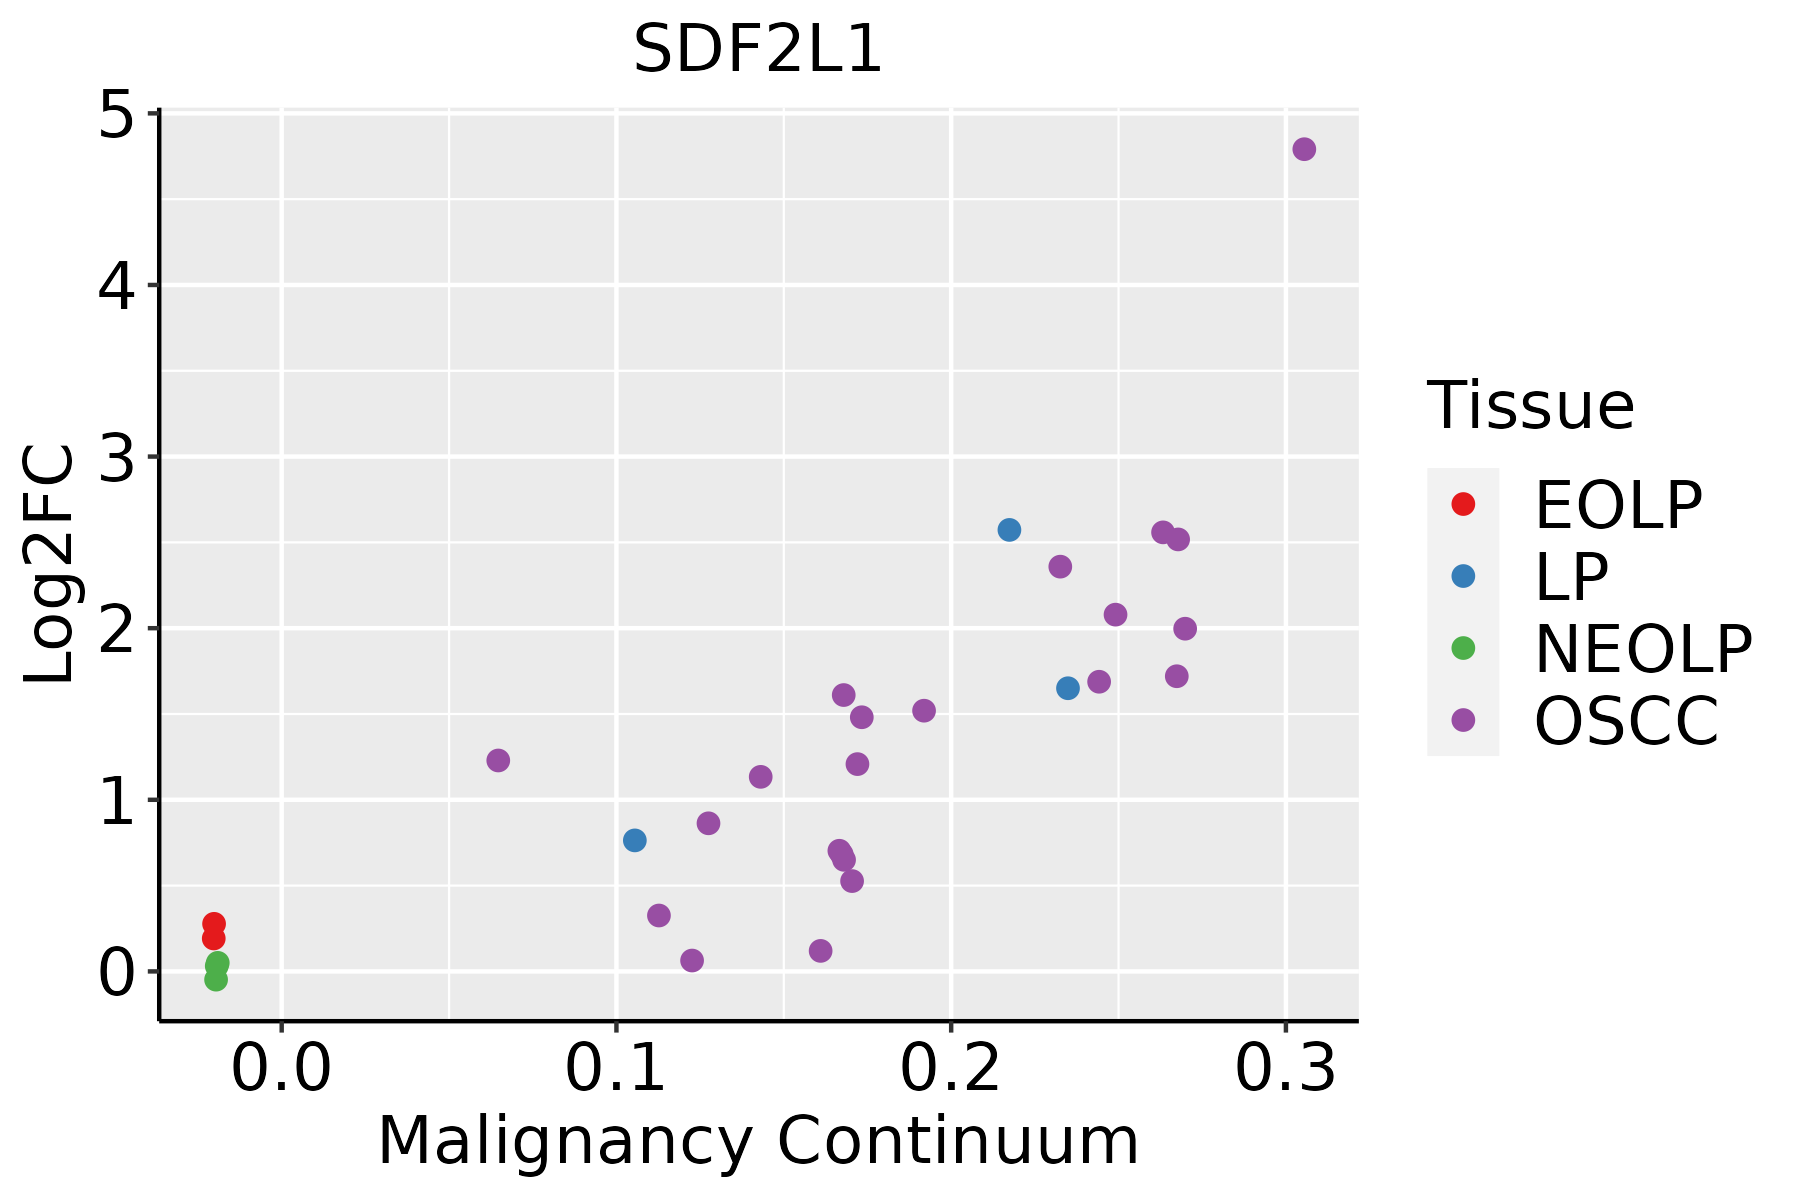 | EOLP: Erosive Oral lichen planus |
| LP: leukoplakia | ||
| NEOLP: Non-erosive oral lichen planus | ||
| OSCC: Oral squamous cell carcinoma | ||
| Prostate | 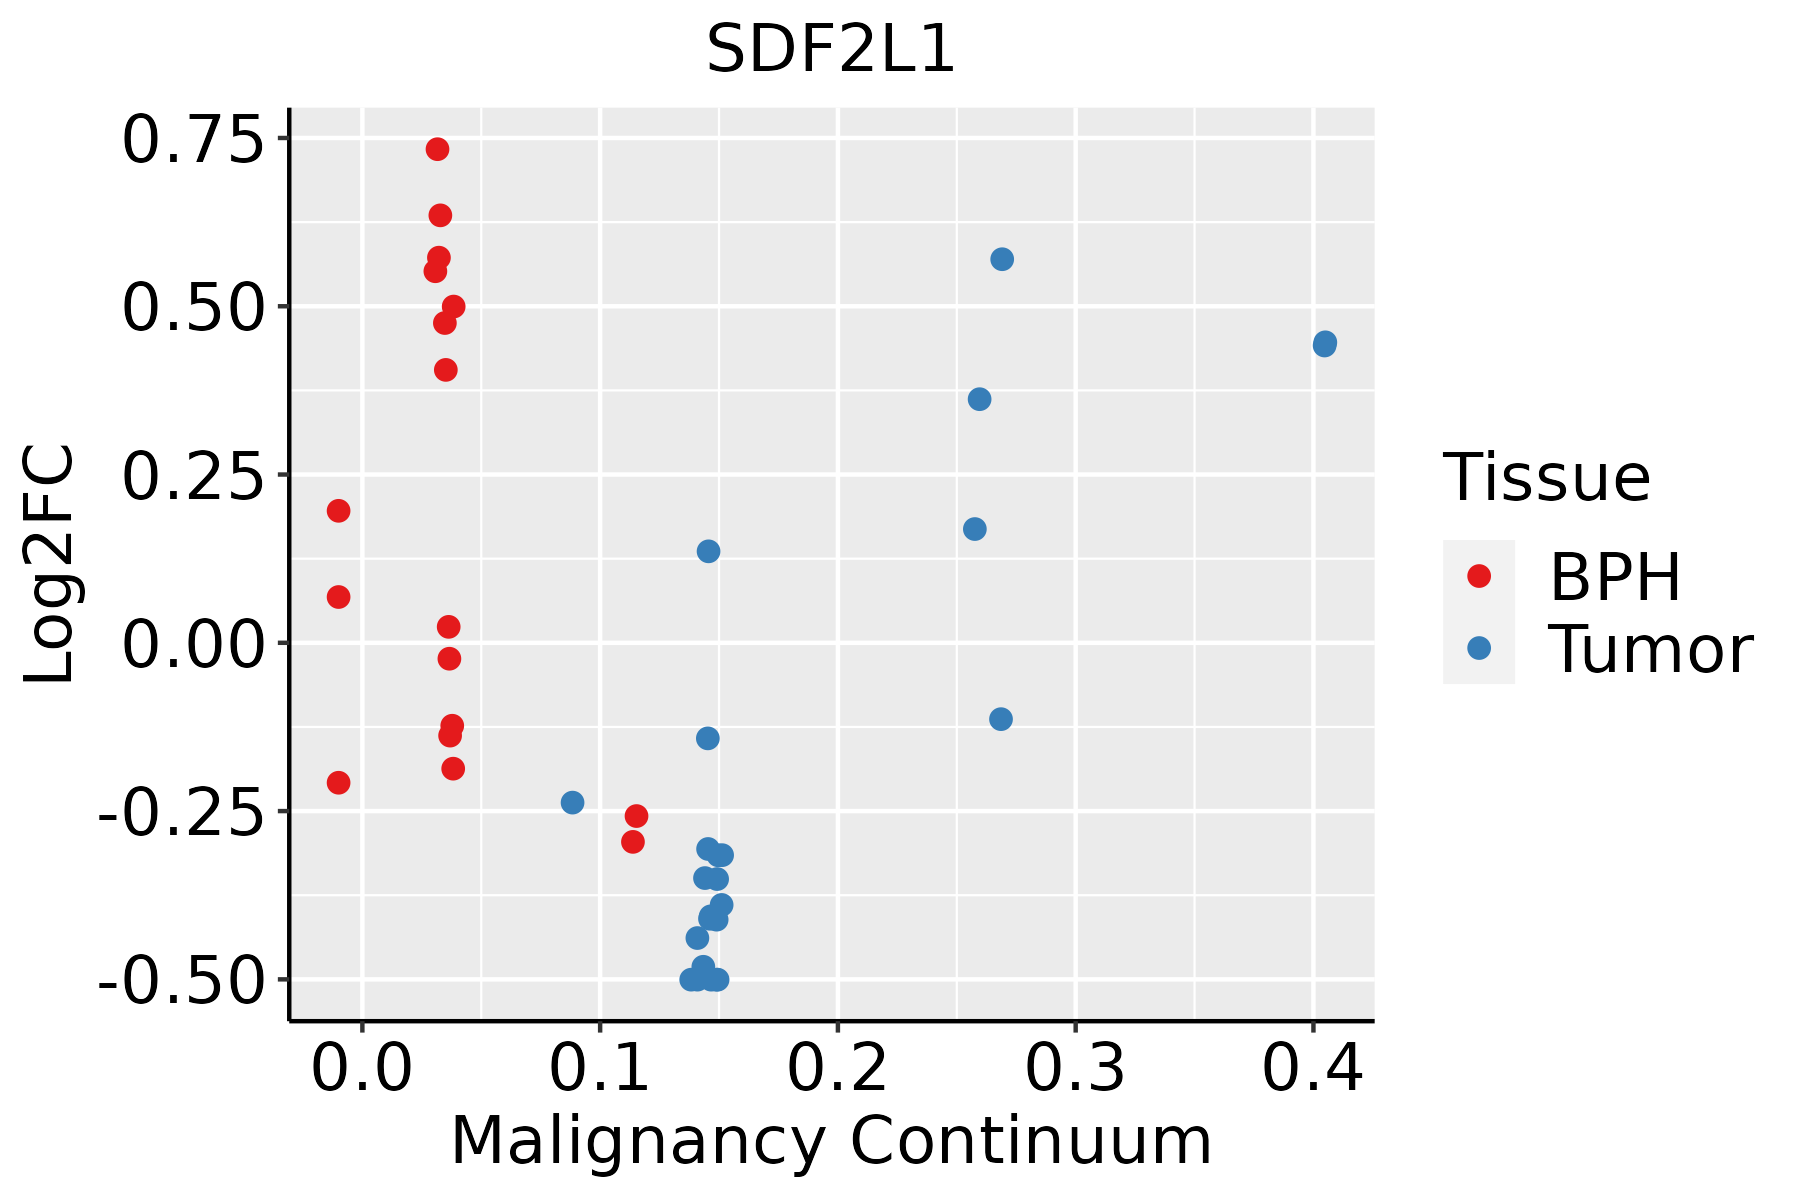 | BPH: Benign Prostatic Hyperplasia |
| Skin |  | AK: Actinic keratosis |
| cSCC: Cutaneous squamous cell carcinoma | ||
| SCCIS:squamous cell carcinoma in situ | ||
| Thyroid |  | ATC: Anaplastic thyroid cancer |
| HT: Hashimoto's thyroiditis | ||
| PTC: Papillary thyroid cancer |
| ∗log2FC in expression of this searched gene in stem-like cells from each diseased tissue sample relative to stem-like cells in normal samples in each tissue plotted against the malignancy continuum. Samples are colored based on if they are from different disease stage. |
Top |
Malignant transformation related pathway analysis |
| Find out the enriched GO biological processes and KEGG pathways involved in transition from healthy to precancer to cancer |
| Tissue | Disease Stage | Enriched GO biological Processes |
| Colorectum | AD |  |
| Colorectum | SER |  |
| Colorectum | MSS |  |
| Colorectum | MSI-H |  |
| Colorectum | FAP |  |
| ∗Top 15 enriched GO BP terms are showed in the bar plot of each disease state in each tissue. Each row represents a significant GO biological process which is colored according to the -log10(p.adjust). |
| Page: 1 2 3 4 5 6 7 8 9 |
| GO ID | Tissue | Disease Stage | Description | Gene Ratio | Bg Ratio | pvalue | p.adjust | Count |
| GO:00064578 | Breast | Precancer | protein folding | 43/1080 | 212/18723 | 3.48e-13 | 7.45e-11 | 43 |
| GO:00064588 | Breast | Precancer | 'de novo' protein folding | 16/1080 | 43/18723 | 8.14e-10 | 6.92e-08 | 16 |
| GO:00610778 | Breast | Precancer | chaperone-mediated protein folding | 19/1080 | 67/18723 | 4.22e-09 | 3.28e-07 | 19 |
| GO:00510848 | Breast | Precancer | 'de novo' posttranslational protein folding | 14/1080 | 39/18723 | 1.61e-08 | 1.12e-06 | 14 |
| GO:00510858 | Breast | Precancer | chaperone cofactor-dependent protein refolding | 13/1080 | 34/18723 | 2.17e-08 | 1.47e-06 | 13 |
| GO:00359669 | Breast | Precancer | response to topologically incorrect protein | 29/1080 | 159/18723 | 3.00e-08 | 1.89e-06 | 29 |
| GO:00349769 | Breast | Precancer | response to endoplasmic reticulum stress | 38/1080 | 256/18723 | 7.89e-08 | 4.60e-06 | 38 |
| GO:00104989 | Breast | Precancer | proteasomal protein catabolic process | 58/1080 | 490/18723 | 1.54e-07 | 8.05e-06 | 58 |
| GO:00359679 | Breast | Precancer | cellular response to topologically incorrect protein | 22/1080 | 116/18723 | 6.84e-07 | 2.80e-05 | 22 |
| GO:000645713 | Breast | IDC | protein folding | 47/1434 | 212/18723 | 2.31e-11 | 3.86e-09 | 47 |
| GO:001049814 | Breast | IDC | proteasomal protein catabolic process | 75/1434 | 490/18723 | 5.59e-09 | 4.41e-07 | 75 |
| GO:006107713 | Breast | IDC | chaperone-mediated protein folding | 21/1434 | 67/18723 | 1.35e-08 | 9.71e-07 | 21 |
| GO:000645813 | Breast | IDC | 'de novo' protein folding | 16/1434 | 43/18723 | 4.69e-08 | 3.02e-06 | 16 |
| GO:003596614 | Breast | IDC | response to topologically incorrect protein | 32/1434 | 159/18723 | 3.71e-07 | 1.85e-05 | 32 |
| GO:005108413 | Breast | IDC | 'de novo' posttranslational protein folding | 14/1434 | 39/18723 | 5.46e-07 | 2.65e-05 | 14 |
| GO:005108513 | Breast | IDC | chaperone cofactor-dependent protein refolding | 13/1434 | 34/18723 | 5.96e-07 | 2.85e-05 | 13 |
| GO:003497614 | Breast | IDC | response to endoplasmic reticulum stress | 43/1434 | 256/18723 | 8.42e-07 | 3.82e-05 | 43 |
| GO:003596714 | Breast | IDC | cellular response to topologically incorrect protein | 24/1434 | 116/18723 | 6.27e-06 | 1.98e-04 | 24 |
| GO:000645723 | Breast | DCIS | protein folding | 47/1390 | 212/18723 | 7.84e-12 | 1.53e-09 | 47 |
| GO:001049824 | Breast | DCIS | proteasomal protein catabolic process | 75/1390 | 490/18723 | 1.44e-09 | 1.40e-07 | 75 |
| Page: 1 2 3 4 5 6 7 8 9 10 11 12 13 |
| Pathway ID | Tissue | Disease Stage | Description | Gene Ratio | Bg Ratio | pvalue | p.adjust | qvalue | Count |
| Page: 1 |
Top |
Cell-cell communication analysis |
| Identification of potential cell-cell interactions between two cell types and their ligand-receptor pairs for different disease states |
| Ligand | Receptor | LRpair | Pathway | Tissue | Disease Stage |
| Page: 1 |
Top |
Single-cell gene regulatory network inference analysis |
| Find out the significant the regulons (TFs) and the target genes of each regulon across cell types for different disease states |
| TF | Cell Type | Tissue | Disease Stage | Target Gene | RSS | Regulon Activity |
| ∗The dot plots of a searched regulon are shown for all cell subpopulations in each disease state of each tissue based on the regulon specific score inferred using pySCENIC and by calculating the average expression. |
| Page: 1 |
Top |
Somatic mutation of malignant transformation related genes |
| Annotation of somatic variants for genes involved in malignant transformation |
| Hugo Symbol | Variant Class | Variant Classification | dbSNP RS | HGVSc | HGVSp | HGVSp Short | SWISSPROT | BIOTYPE | SIFT | PolyPhen | Tumor Sample Barcode | Tissue | Histology | Sex | Age | Stage | Therapy Types | Drugs | Outcome |
| SDF2L1 | SNV | Missense_Mutation | rs111993817 | c.548G>A | p.Arg183His | p.R183H | Q9HCN8 | protein_coding | tolerated(0.65) | benign(0.012) | TCGA-AD-6964-01 | Colorectum | colon adenocarcinoma | Male | <65 | III/IV | Chemotherapy | folfox | PD |
| SDF2L1 | SNV | Missense_Mutation | rs775215919 | c.568N>A | p.Gly190Ser | p.G190S | Q9HCN8 | protein_coding | deleterious(0.03) | probably_damaging(0.992) | TCGA-CM-4743-01 | Colorectum | colon adenocarcinoma | Male | >=65 | I/II | Chemotherapy | capecitabine | SD |
| SDF2L1 | SNV | Missense_Mutation | c.410N>A | p.Gly137Asp | p.G137D | Q9HCN8 | protein_coding | deleterious(0.02) | possibly_damaging(0.889) | TCGA-D1-A160-01 | Endometrium | uterine corpus endometrioid carcinoma | Female | >=65 | I/II | Unknown | Unknown | SD | |
| SDF2L1 | SNV | Missense_Mutation | c.547C>T | p.Arg183Cys | p.R183C | Q9HCN8 | protein_coding | deleterious(0.02) | probably_damaging(0.947) | TCGA-EY-A549-01 | Endometrium | uterine corpus endometrioid carcinoma | Female | >=65 | I/II | Unknown | Unknown | SD | |
| SDF2L1 | deletion | Frame_Shift_Del | novel | c.270delN | p.Cys92AlafsTer13 | p.C92Afs*13 | Q9HCN8 | protein_coding | TCGA-EY-A2ON-01 | Endometrium | uterine corpus endometrioid carcinoma | Female | <65 | III/IV | Chemotherapy | taxol | PD | ||
| SDF2L1 | SNV | Missense_Mutation | novel | c.172N>G | p.Ile58Val | p.I58V | Q9HCN8 | protein_coding | tolerated(1) | benign(0.005) | TCGA-DD-AAE3-01 | Liver | liver hepatocellular carcinoma | Male | <65 | I/II | Unknown | Unknown | SD |
| SDF2L1 | SNV | Missense_Mutation | novel | c.581N>T | p.Ala194Val | p.A194V | Q9HCN8 | protein_coding | tolerated(0.07) | benign(0.046) | TCGA-22-1016-01 | Lung | lung squamous cell carcinoma | Male | >=65 | I/II | Unknown | Unknown | SD |
| SDF2L1 | SNV | Missense_Mutation | novel | c.256G>T | p.Gly86Cys | p.G86C | Q9HCN8 | protein_coding | deleterious(0) | probably_damaging(1) | TCGA-34-7107-01 | Lung | lung squamous cell carcinoma | Male | >=65 | I/II | Unknown | Unknown | SD |
| SDF2L1 | SNV | Missense_Mutation | novel | c.578N>T | p.Ser193Ile | p.S193I | Q9HCN8 | protein_coding | deleterious(0.04) | benign(0.343) | TCGA-52-7812-01 | Lung | lung squamous cell carcinoma | Male | >=65 | I/II | Chemotherapy | paclitaxel | PD |
| SDF2L1 | SNV | Missense_Mutation | c.486N>G | p.Phe162Leu | p.F162L | Q9HCN8 | protein_coding | tolerated(0.77) | benign(0.324) | TCGA-VP-AA1N-01 | Prostate | prostate adenocarcinoma | Male | >=65 | 9 | Unknown | Unknown | SD |
| Page: 1 2 |
Top |
Related drugs of malignant transformation related genes |
| Identification of chemicals and drugs interact with genes involved in malignant transfromation |
| (DGIdb 4.0) |
| Entrez ID | Symbol | Category | Interaction Types | Drug Claim Name | Drug Name | PMIDs |
| Page: 1 |

Copyright 2023-Present -The University of Texas Health Science Center at Houston |