
|
|||||
|
 | |
| |
| |
| |
| |
| |
|
Gene: SDE2 |
Gene summary for SDE2 |
| Gene information | Species | Human | Gene symbol | SDE2 | Gene ID | 163859 |
| Gene name | SDE2 telomere maintenance homolog | |
| Gene Alias | C1orf55 | |
| Cytomap | 1q42.12 | |
| Gene Type | protein-coding | GO ID | GO:0000075 | UniProtAcc | Q6IQ49 |
Top |
Malignant transformation analysis |
| Identification of the aberrant gene expression in precancerous and cancerous lesions by comparing the gene expression of stem-like cells in diseased tissues with normal stem cells |
| Entrez ID | Symbol | Replicates | Species | Organ | Tissue | Adj P-value | Log2FC | Malignancy |
| 163859 | SDE2 | LZE2T | Human | Esophagus | ESCC | 2.47e-02 | 2.08e-01 | 0.082 |
| 163859 | SDE2 | LZE4T | Human | Esophagus | ESCC | 1.04e-11 | 2.69e-01 | 0.0811 |
| 163859 | SDE2 | LZE7T | Human | Esophagus | ESCC | 8.67e-04 | 4.37e-01 | 0.0667 |
| 163859 | SDE2 | LZE8T | Human | Esophagus | ESCC | 2.86e-05 | 7.84e-02 | 0.067 |
| 163859 | SDE2 | LZE24T | Human | Esophagus | ESCC | 5.14e-13 | 3.24e-01 | 0.0596 |
| 163859 | SDE2 | P1T-E | Human | Esophagus | ESCC | 2.26e-03 | 2.10e-01 | 0.0875 |
| 163859 | SDE2 | P2T-E | Human | Esophagus | ESCC | 1.23e-18 | 2.24e-01 | 0.1177 |
| 163859 | SDE2 | P4T-E | Human | Esophagus | ESCC | 6.84e-09 | 1.55e-01 | 0.1323 |
| 163859 | SDE2 | P5T-E | Human | Esophagus | ESCC | 5.45e-13 | 2.35e-01 | 0.1327 |
| 163859 | SDE2 | P8T-E | Human | Esophagus | ESCC | 1.44e-11 | 7.74e-02 | 0.0889 |
| 163859 | SDE2 | P9T-E | Human | Esophagus | ESCC | 5.14e-06 | 1.84e-01 | 0.1131 |
| 163859 | SDE2 | P10T-E | Human | Esophagus | ESCC | 1.88e-08 | 1.34e-01 | 0.116 |
| 163859 | SDE2 | P11T-E | Human | Esophagus | ESCC | 2.79e-09 | 3.48e-01 | 0.1426 |
| 163859 | SDE2 | P12T-E | Human | Esophagus | ESCC | 1.33e-04 | 9.06e-02 | 0.1122 |
| 163859 | SDE2 | P15T-E | Human | Esophagus | ESCC | 1.34e-08 | 2.46e-01 | 0.1149 |
| 163859 | SDE2 | P16T-E | Human | Esophagus | ESCC | 5.34e-14 | 2.16e-01 | 0.1153 |
| 163859 | SDE2 | P19T-E | Human | Esophagus | ESCC | 1.47e-06 | 2.80e-01 | 0.1662 |
| 163859 | SDE2 | P20T-E | Human | Esophagus | ESCC | 6.77e-08 | 2.30e-01 | 0.1124 |
| 163859 | SDE2 | P21T-E | Human | Esophagus | ESCC | 3.57e-19 | 2.58e-01 | 0.1617 |
| 163859 | SDE2 | P22T-E | Human | Esophagus | ESCC | 7.05e-13 | 1.88e-01 | 0.1236 |
| Page: 1 2 3 4 |
| Tissue | Expression Dynamics | Abbreviation |
| Esophagus | 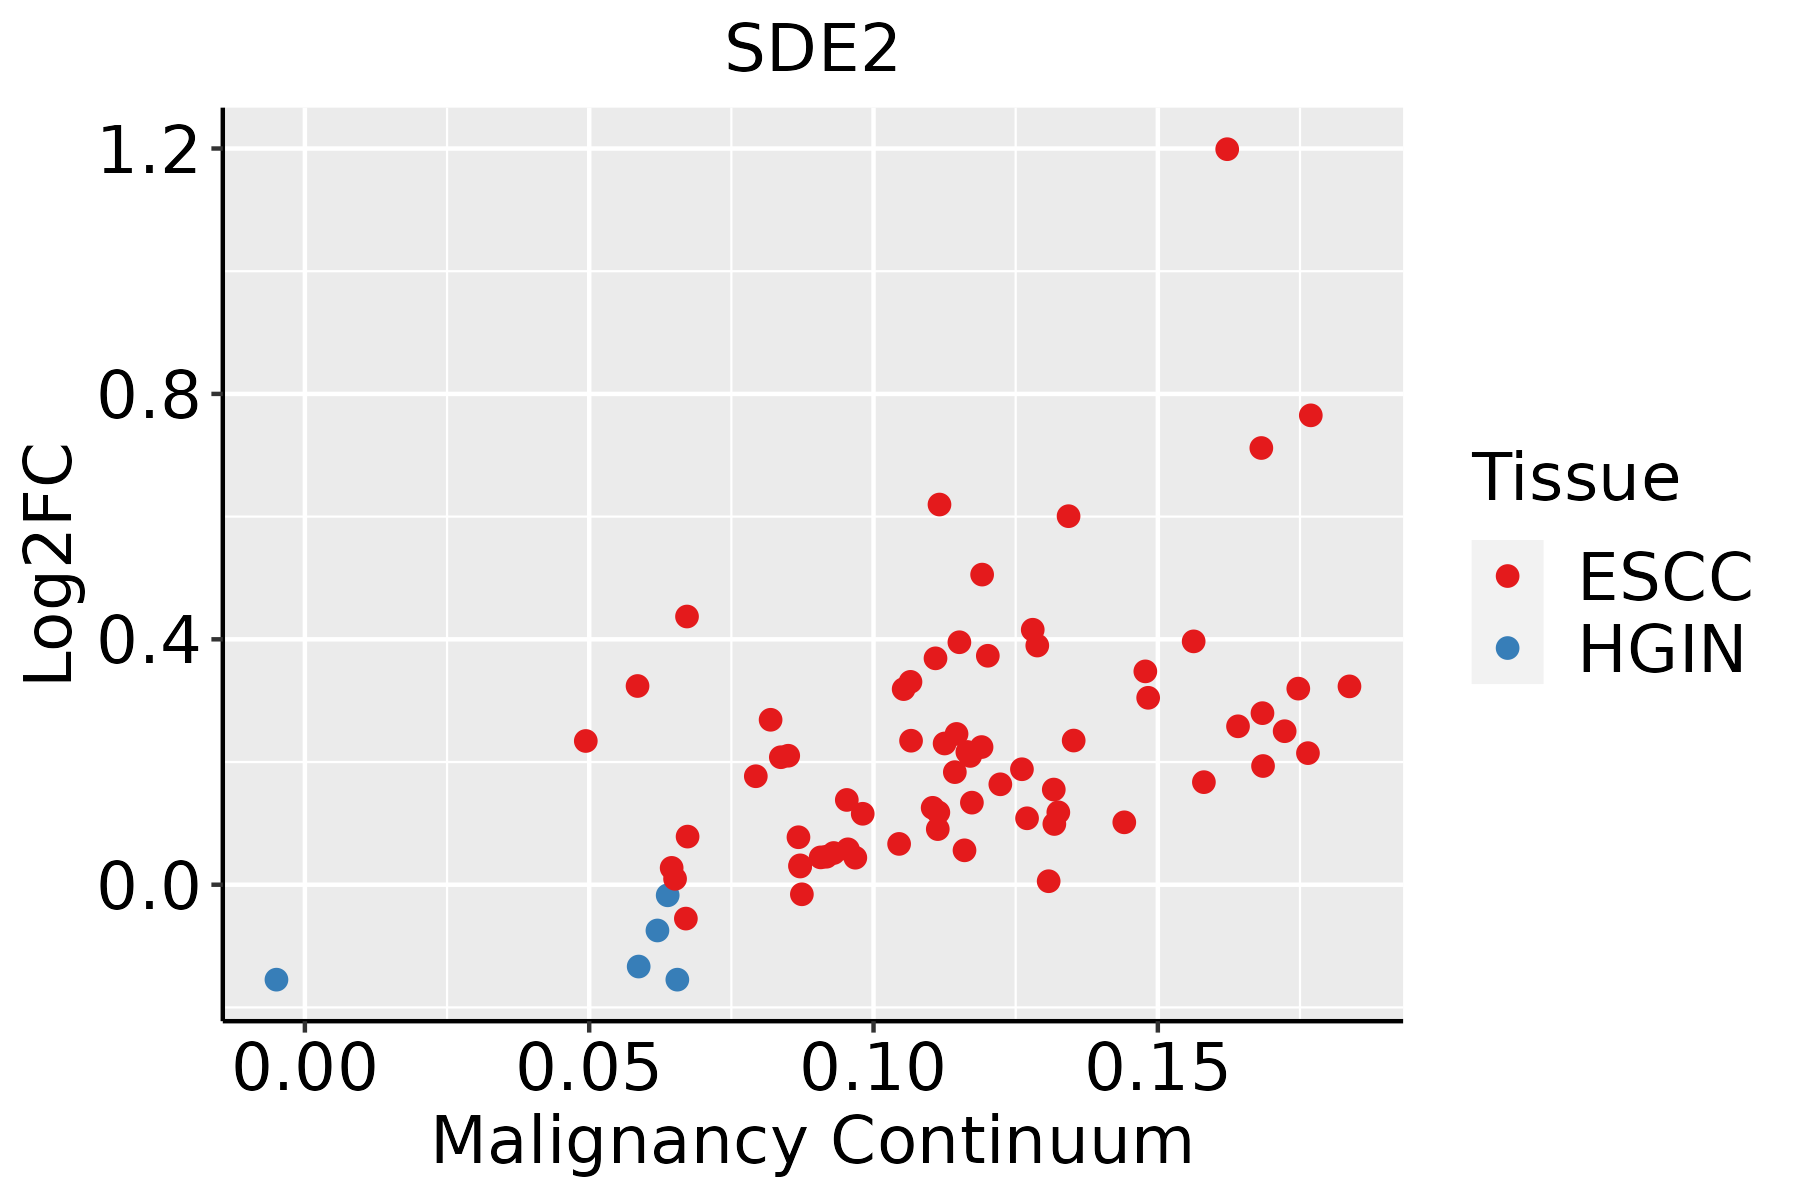 | ESCC: Esophageal squamous cell carcinoma |
| HGIN: High-grade intraepithelial neoplasias | ||
| LGIN: Low-grade intraepithelial neoplasias | ||
| Liver |  | HCC: Hepatocellular carcinoma |
| NAFLD: Non-alcoholic fatty liver disease | ||
| Oral Cavity | 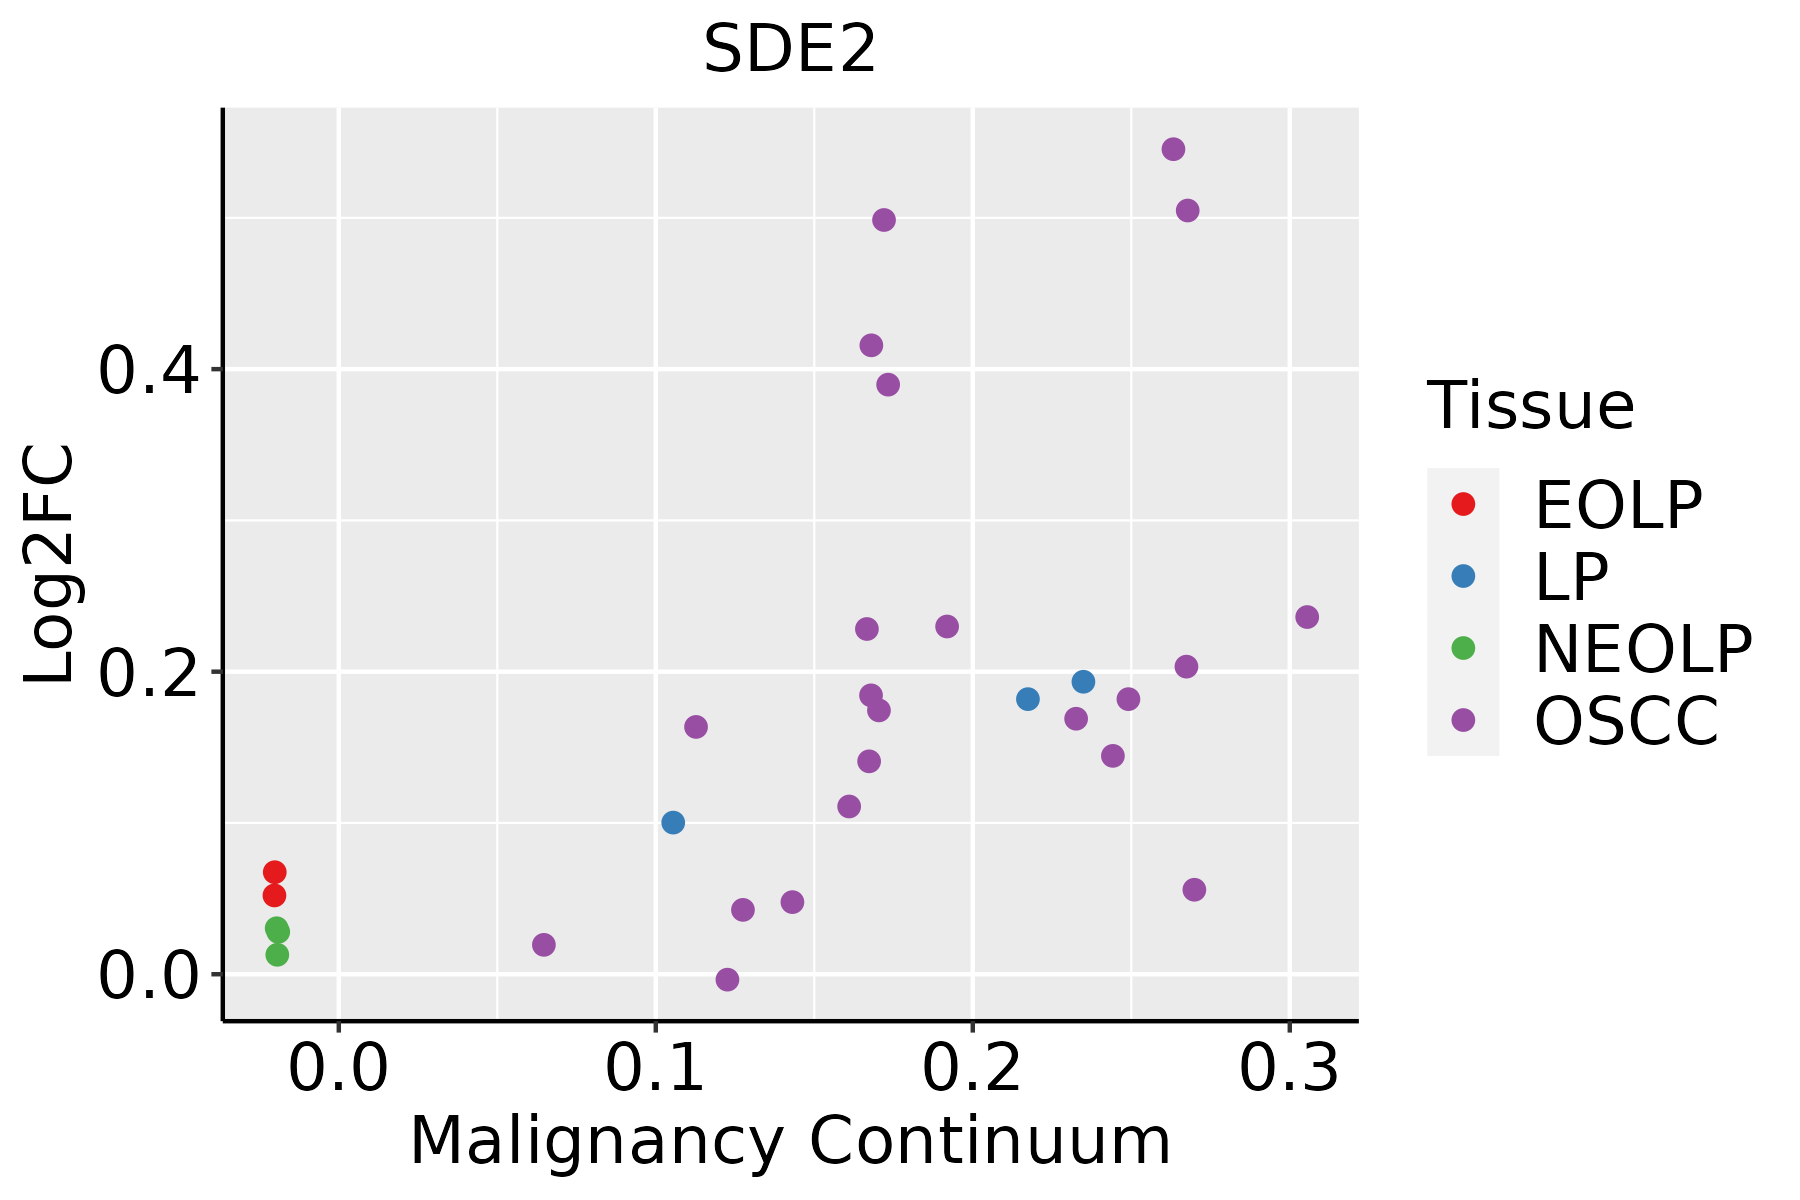 | EOLP: Erosive Oral lichen planus |
| LP: leukoplakia | ||
| NEOLP: Non-erosive oral lichen planus | ||
| OSCC: Oral squamous cell carcinoma |
| ∗log2FC in expression of this searched gene in stem-like cells from each diseased tissue sample relative to stem-like cells in normal samples in each tissue plotted against the malignancy continuum. Samples are colored based on if they are from different disease stage. |
Top |
Malignant transformation related pathway analysis |
| Find out the enriched GO biological processes and KEGG pathways involved in transition from healthy to precancer to cancer |
| Tissue | Disease Stage | Enriched GO biological Processes |
| Colorectum | AD |  |
| Colorectum | SER |  |
| Colorectum | MSS |  |
| Colorectum | MSI-H |  |
| Colorectum | FAP |  |
| ∗Top 15 enriched GO BP terms are showed in the bar plot of each disease state in each tissue. Each row represents a significant GO biological process which is colored according to the -log10(p.adjust). |
| Page: 1 2 3 4 5 6 7 8 9 |
| GO ID | Tissue | Disease Stage | Description | Gene Ratio | Bg Ratio | pvalue | p.adjust | Count |
| GO:004477216 | Esophagus | ESCC | mitotic cell cycle phase transition | 281/8552 | 424/18723 | 4.63e-18 | 4.45e-16 | 281 |
| GO:000734615 | Esophagus | ESCC | regulation of mitotic cell cycle | 293/8552 | 457/18723 | 8.00e-16 | 5.64e-14 | 293 |
| GO:000941113 | Esophagus | ESCC | response to UV | 115/8552 | 149/18723 | 3.29e-15 | 1.93e-13 | 115 |
| GO:00062604 | Esophagus | ESCC | DNA replication | 181/8552 | 260/18723 | 3.55e-15 | 2.05e-13 | 181 |
| GO:190198713 | Esophagus | ESCC | regulation of cell cycle phase transition | 242/8552 | 390/18723 | 3.86e-11 | 1.26e-09 | 242 |
| GO:000931419 | Esophagus | ESCC | response to radiation | 277/8552 | 456/18723 | 4.42e-11 | 1.43e-09 | 277 |
| GO:005160418 | Esophagus | ESCC | protein maturation | 189/8552 | 294/18723 | 7.64e-11 | 2.39e-09 | 189 |
| GO:190199013 | Esophagus | ESCC | regulation of mitotic cell cycle phase transition | 191/8552 | 299/18723 | 1.35e-10 | 3.94e-09 | 191 |
| GO:00457865 | Esophagus | ESCC | negative regulation of cell cycle | 236/8552 | 385/18723 | 3.62e-10 | 9.93e-09 | 236 |
| GO:00000754 | Esophagus | ESCC | cell cycle checkpoint | 117/8552 | 169/18723 | 4.47e-10 | 1.17e-08 | 117 |
| GO:003464413 | Esophagus | ESCC | cellular response to UV | 70/8552 | 90/18723 | 4.59e-10 | 1.20e-08 | 70 |
| GO:007121419 | Esophagus | ESCC | cellular response to abiotic stimulus | 206/8552 | 331/18723 | 7.52e-10 | 1.88e-08 | 206 |
| GO:010400419 | Esophagus | ESCC | cellular response to environmental stimulus | 206/8552 | 331/18723 | 7.52e-10 | 1.88e-08 | 206 |
| GO:004277014 | Esophagus | ESCC | signal transduction in response to DNA damage | 117/8552 | 172/18723 | 2.38e-09 | 5.32e-08 | 117 |
| GO:00070934 | Esophagus | ESCC | mitotic cell cycle checkpoint | 90/8552 | 129/18723 | 2.49e-08 | 4.69e-07 | 90 |
| GO:007147816 | Esophagus | ESCC | cellular response to radiation | 122/8552 | 186/18723 | 3.07e-08 | 5.73e-07 | 122 |
| GO:00109484 | Esophagus | ESCC | negative regulation of cell cycle process | 177/8552 | 294/18723 | 3.26e-07 | 4.59e-06 | 177 |
| GO:000008214 | Esophagus | ESCC | G1/S transition of mitotic cell cycle | 134/8552 | 214/18723 | 4.04e-07 | 5.55e-06 | 134 |
| GO:004484314 | Esophagus | ESCC | cell cycle G1/S phase transition | 148/8552 | 241/18723 | 5.68e-07 | 7.48e-06 | 148 |
| GO:00315705 | Esophagus | ESCC | DNA integrity checkpoint | 83/8552 | 123/18723 | 8.17e-07 | 1.06e-05 | 83 |
| Page: 1 2 3 4 5 |
| Pathway ID | Tissue | Disease Stage | Description | Gene Ratio | Bg Ratio | pvalue | p.adjust | qvalue | Count |
| Page: 1 |
Top |
Cell-cell communication analysis |
| Identification of potential cell-cell interactions between two cell types and their ligand-receptor pairs for different disease states |
| Ligand | Receptor | LRpair | Pathway | Tissue | Disease Stage |
| Page: 1 |
Top |
Single-cell gene regulatory network inference analysis |
| Find out the significant the regulons (TFs) and the target genes of each regulon across cell types for different disease states |
| TF | Cell Type | Tissue | Disease Stage | Target Gene | RSS | Regulon Activity |
| ∗The dot plots of a searched regulon are shown for all cell subpopulations in each disease state of each tissue based on the regulon specific score inferred using pySCENIC and by calculating the average expression. |
| Page: 1 |
Top |
Somatic mutation of malignant transformation related genes |
| Annotation of somatic variants for genes involved in malignant transformation |
| Hugo Symbol | Variant Class | Variant Classification | dbSNP RS | HGVSc | HGVSp | HGVSp Short | SWISSPROT | BIOTYPE | SIFT | PolyPhen | Tumor Sample Barcode | Tissue | Histology | Sex | Age | Stage | Therapy Types | Drugs | Outcome |
| SDE2 | SNV | Missense_Mutation | c.598N>G | p.Gln200Glu | p.Q200E | Q6IQ49 | protein_coding | tolerated(0.63) | benign(0) | TCGA-A2-A0YK-01 | Breast | breast invasive carcinoma | Female | <65 | I/II | Chemotherapy | cytoxan | SD | |
| SDE2 | SNV | Missense_Mutation | c.1183N>C | p.Glu395Gln | p.E395Q | Q6IQ49 | protein_coding | tolerated(0.09) | possibly_damaging(0.461) | TCGA-A8-A08T-01 | Breast | breast invasive carcinoma | Female | <65 | III/IV | Unknown | Unknown | PD | |
| SDE2 | SNV | Missense_Mutation | c.1175N>G | p.Ser392Cys | p.S392C | Q6IQ49 | protein_coding | deleterious(0.02) | possibly_damaging(0.464) | TCGA-D8-A1JA-01 | Breast | breast invasive carcinoma | Female | <65 | III/IV | Chemotherapy | adriamycin | PD | |
| SDE2 | SNV | Missense_Mutation | c.1048G>C | p.Asp350His | p.D350H | Q6IQ49 | protein_coding | tolerated(0.09) | benign(0.023) | TCGA-E9-A1NA-01 | Breast | breast invasive carcinoma | Female | <65 | I/II | Chemotherapy | cyclophosphamide | SD | |
| SDE2 | insertion | Nonsense_Mutation | novel | c.910_911insGAGACTCCGTCT | p.Glu303_Ser304insTer | p.E303_S304ins* | Q6IQ49 | protein_coding | TCGA-AO-A128-01 | Breast | breast invasive carcinoma | Female | <65 | I/II | Chemotherapy | doxorubicin | SD | ||
| SDE2 | insertion | In_Frame_Ins | novel | c.29_30insAAG | p.Ile10_Arg11insSer | p.I10_R11insS | Q6IQ49 | protein_coding | TCGA-BH-A0AY-01 | Breast | breast invasive carcinoma | Female | <65 | I/II | Chemotherapy | SD | |||
| SDE2 | SNV | Missense_Mutation | novel | c.1225A>C | p.Met409Leu | p.M409L | Q6IQ49 | protein_coding | tolerated(0.2) | benign(0.009) | TCGA-C5-A8XH-01 | Cervix | cervical & endocervical cancer | Female | <65 | I/II | Unknown | Unknown | SD |
| SDE2 | SNV | Missense_Mutation | rs765185264 | c.502N>C | p.Glu168Gln | p.E168Q | Q6IQ49 | protein_coding | deleterious(0.01) | probably_damaging(0.932) | TCGA-IR-A3LI-01 | Cervix | cervical & endocervical cancer | Female | <65 | I/II | Chemotherapy | cisplatin | CR |
| SDE2 | SNV | Missense_Mutation | c.565G>A | p.Glu189Lys | p.E189K | Q6IQ49 | protein_coding | tolerated(0.23) | benign(0.02) | TCGA-Q1-A73O-01 | Cervix | cervical & endocervical cancer | Female | <65 | I/II | Chemotherapy | cisplatin | CR | |
| SDE2 | SNV | Missense_Mutation | novel | c.497N>A | p.Arg166His | p.R166H | Q6IQ49 | protein_coding | deleterious(0) | probably_damaging(0.959) | TCGA-5M-AAT6-01 | Colorectum | colon adenocarcinoma | Female | <65 | III/IV | Unknown | Unknown | PD |
| Page: 1 2 3 4 5 |
Top |
Related drugs of malignant transformation related genes |
| Identification of chemicals and drugs interact with genes involved in malignant transfromation |
| (DGIdb 4.0) |
| Entrez ID | Symbol | Category | Interaction Types | Drug Claim Name | Drug Name | PMIDs |
| Page: 1 |

Copyright 2023-Present -The University of Texas Health Science Center at Houston |