| Tissue | Expression Dynamics | Abbreviation |
| Cervix | 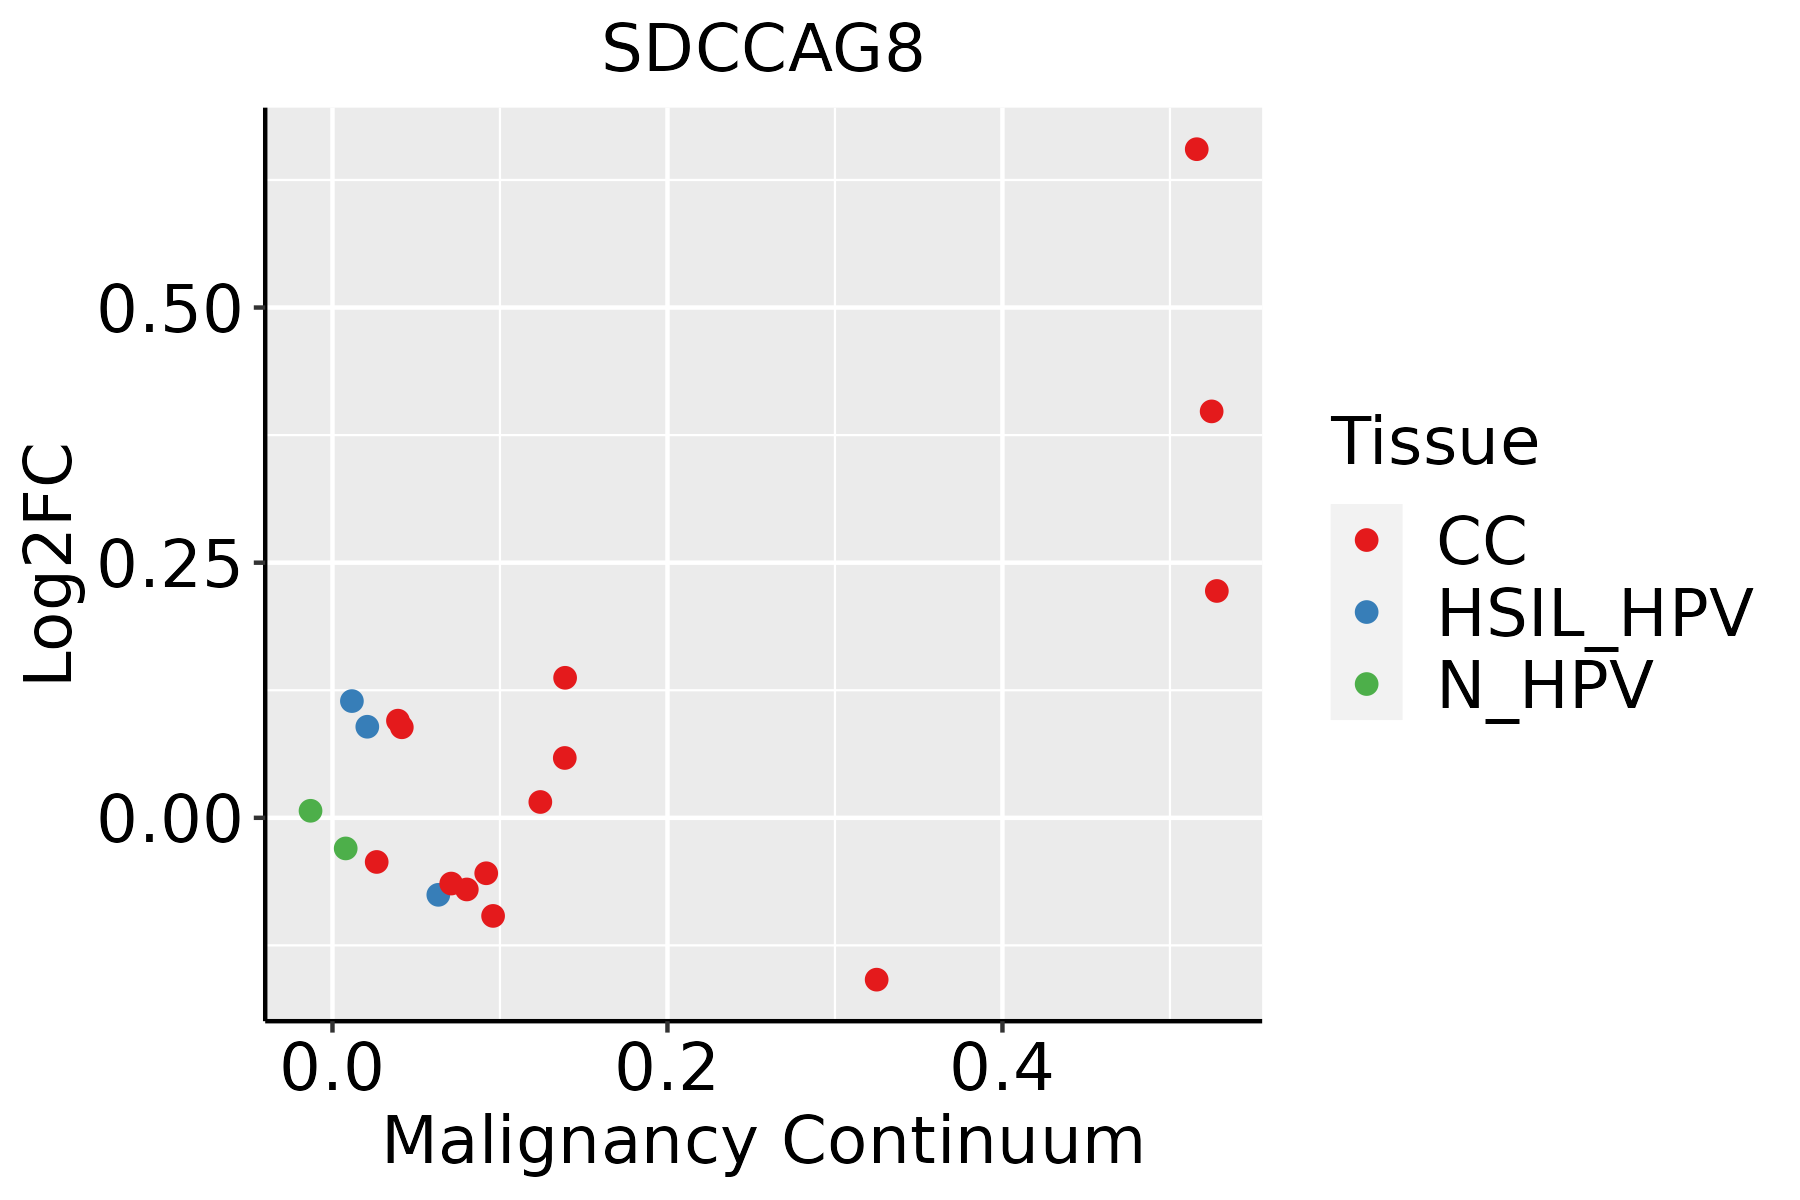 | CC: Cervix cancer |
| HSIL_HPV: HPV-infected high-grade squamous intraepithelial lesions |
| N_HPV: HPV-infected normal cervix |
| Esophagus |  | ESCC: Esophageal squamous cell carcinoma |
| HGIN: High-grade intraepithelial neoplasias |
| LGIN: Low-grade intraepithelial neoplasias |
| Liver | 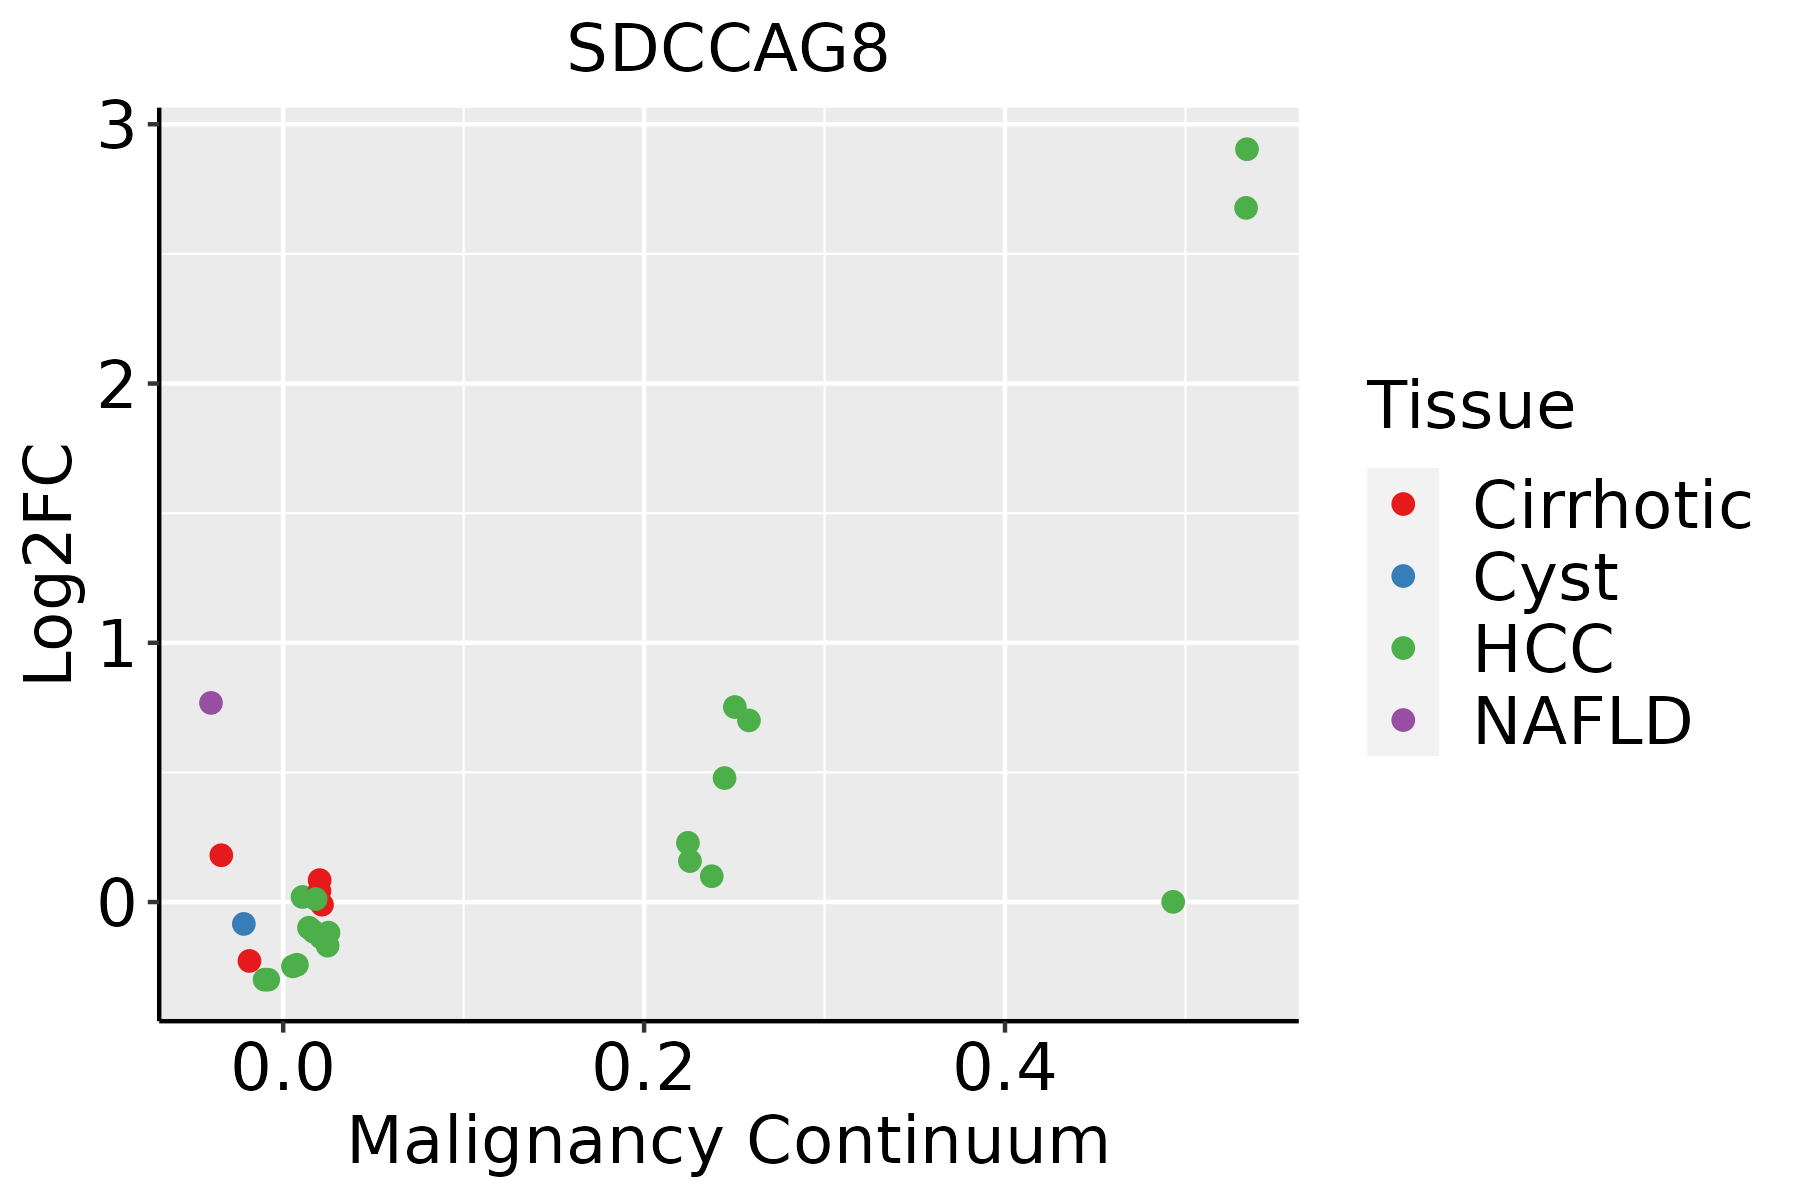 | HCC: Hepatocellular carcinoma |
| NAFLD: Non-alcoholic fatty liver disease |
| Lung | 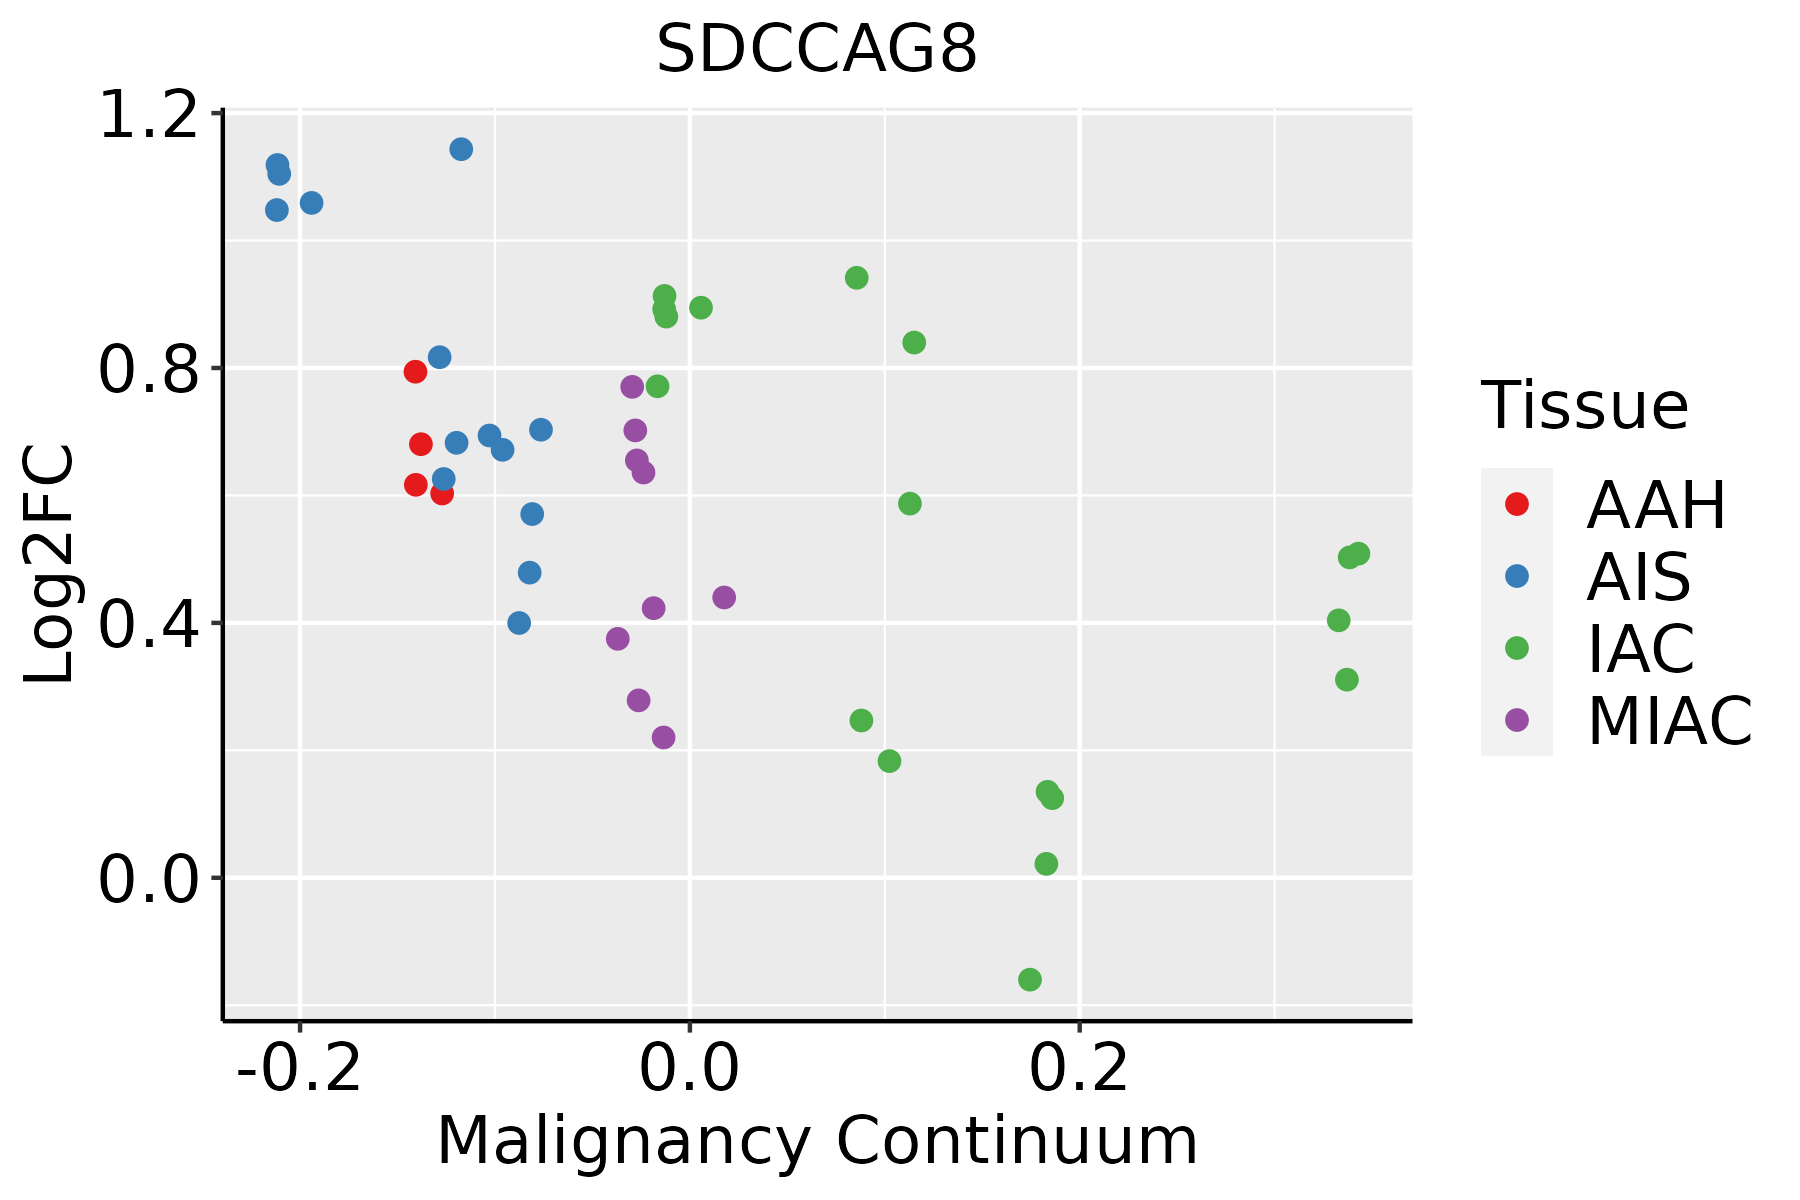 | AAH: Atypical adenomatous hyperplasia |
| AIS: Adenocarcinoma in situ |
| IAC: Invasive lung adenocarcinoma |
| MIA: Minimally invasive adenocarcinoma |
| Oral Cavity | 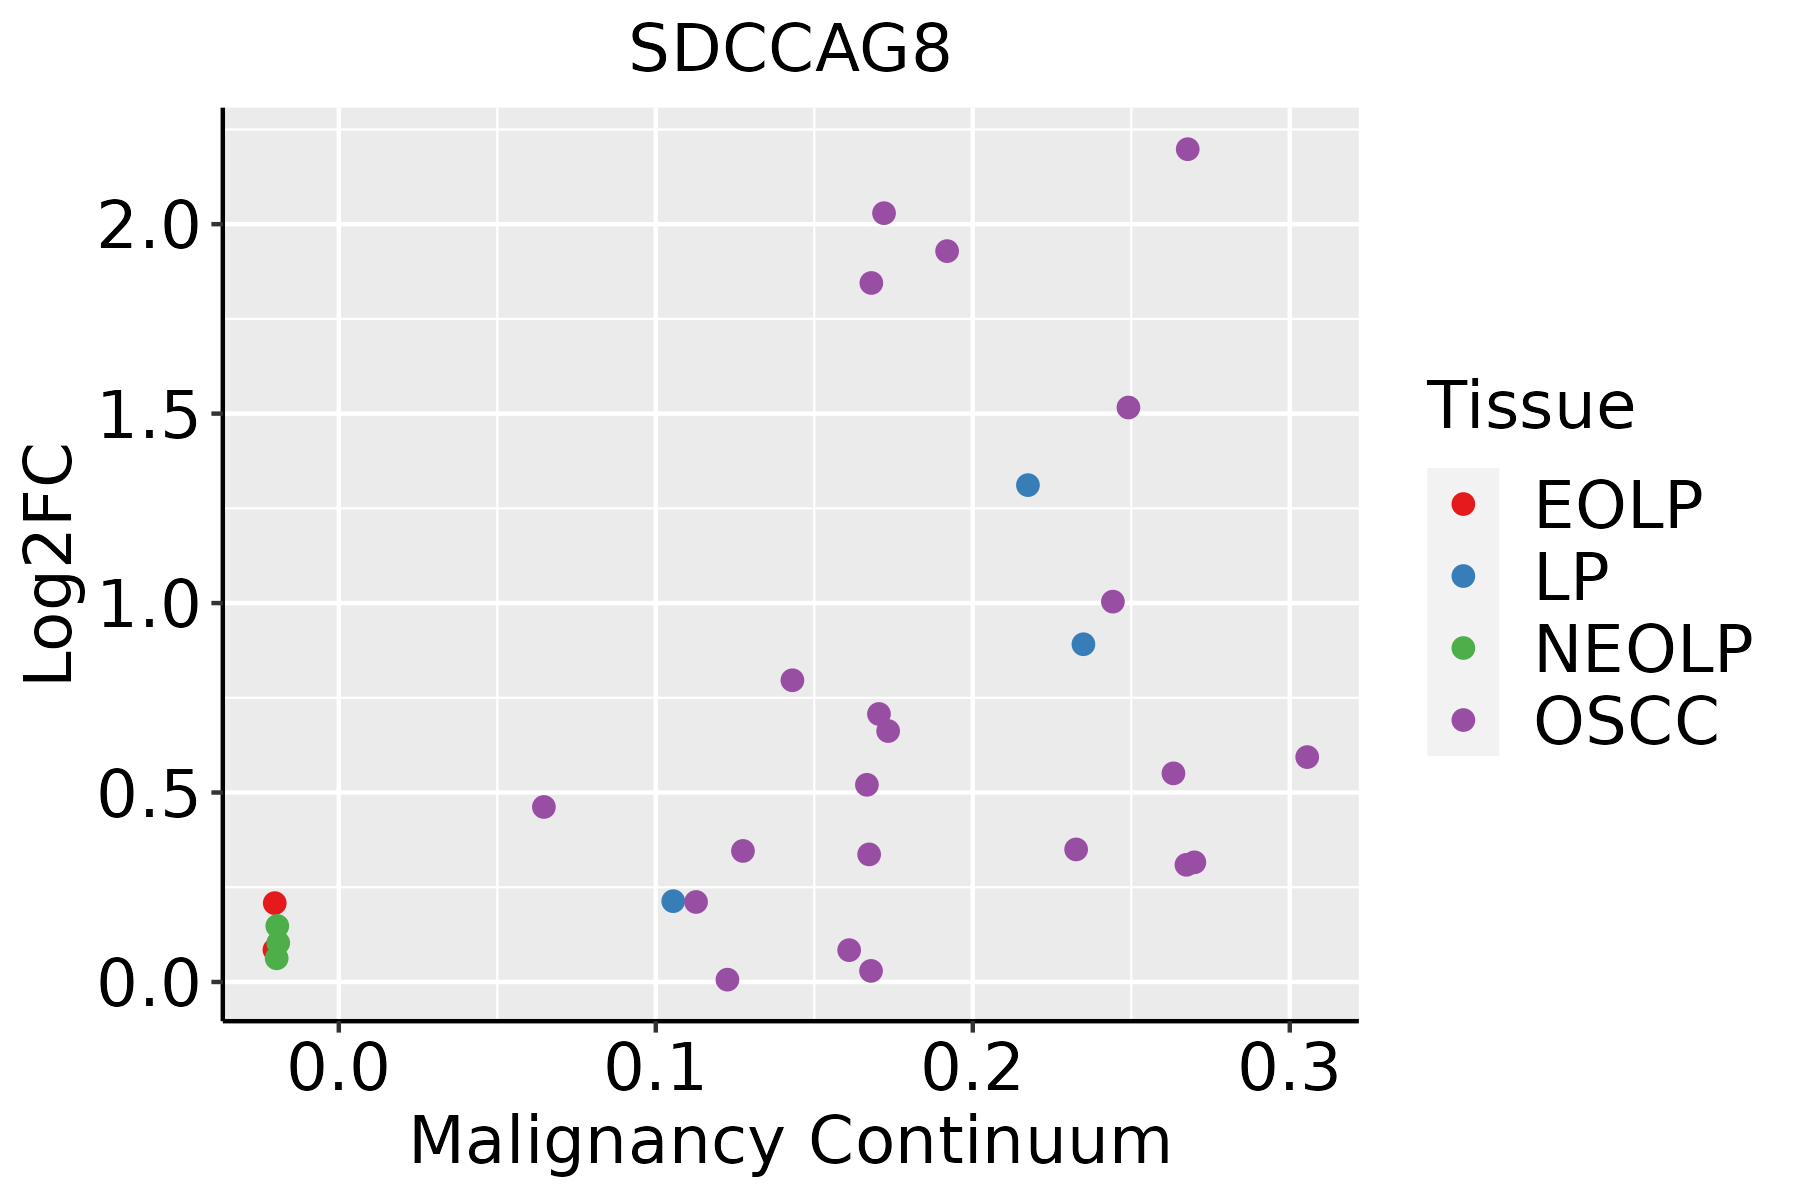 | EOLP: Erosive Oral lichen planus |
| LP: leukoplakia |
| NEOLP: Non-erosive oral lichen planus |
| OSCC: Oral squamous cell carcinoma |
| Skin | 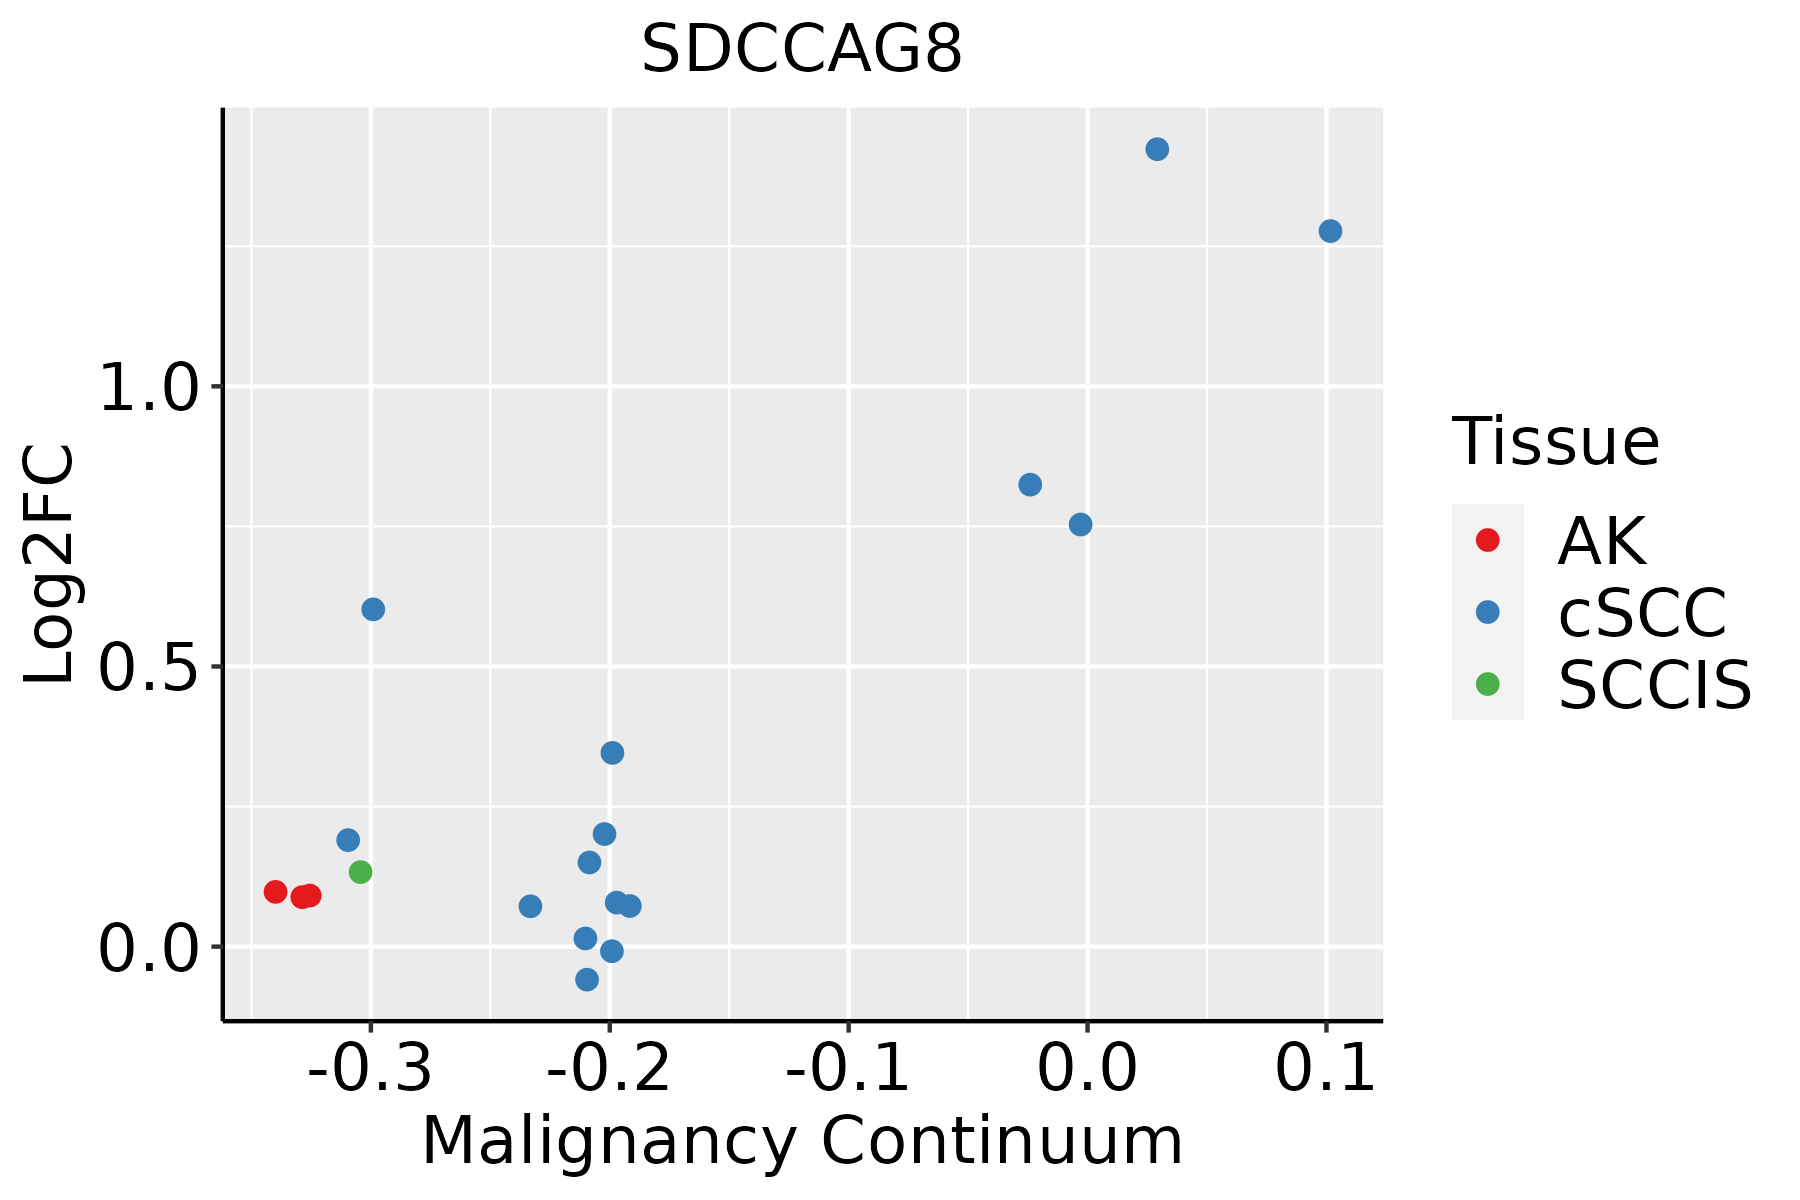 | AK: Actinic keratosis |
| cSCC: Cutaneous squamous cell carcinoma |
| SCCIS:squamous cell carcinoma in situ |
| Thyroid | 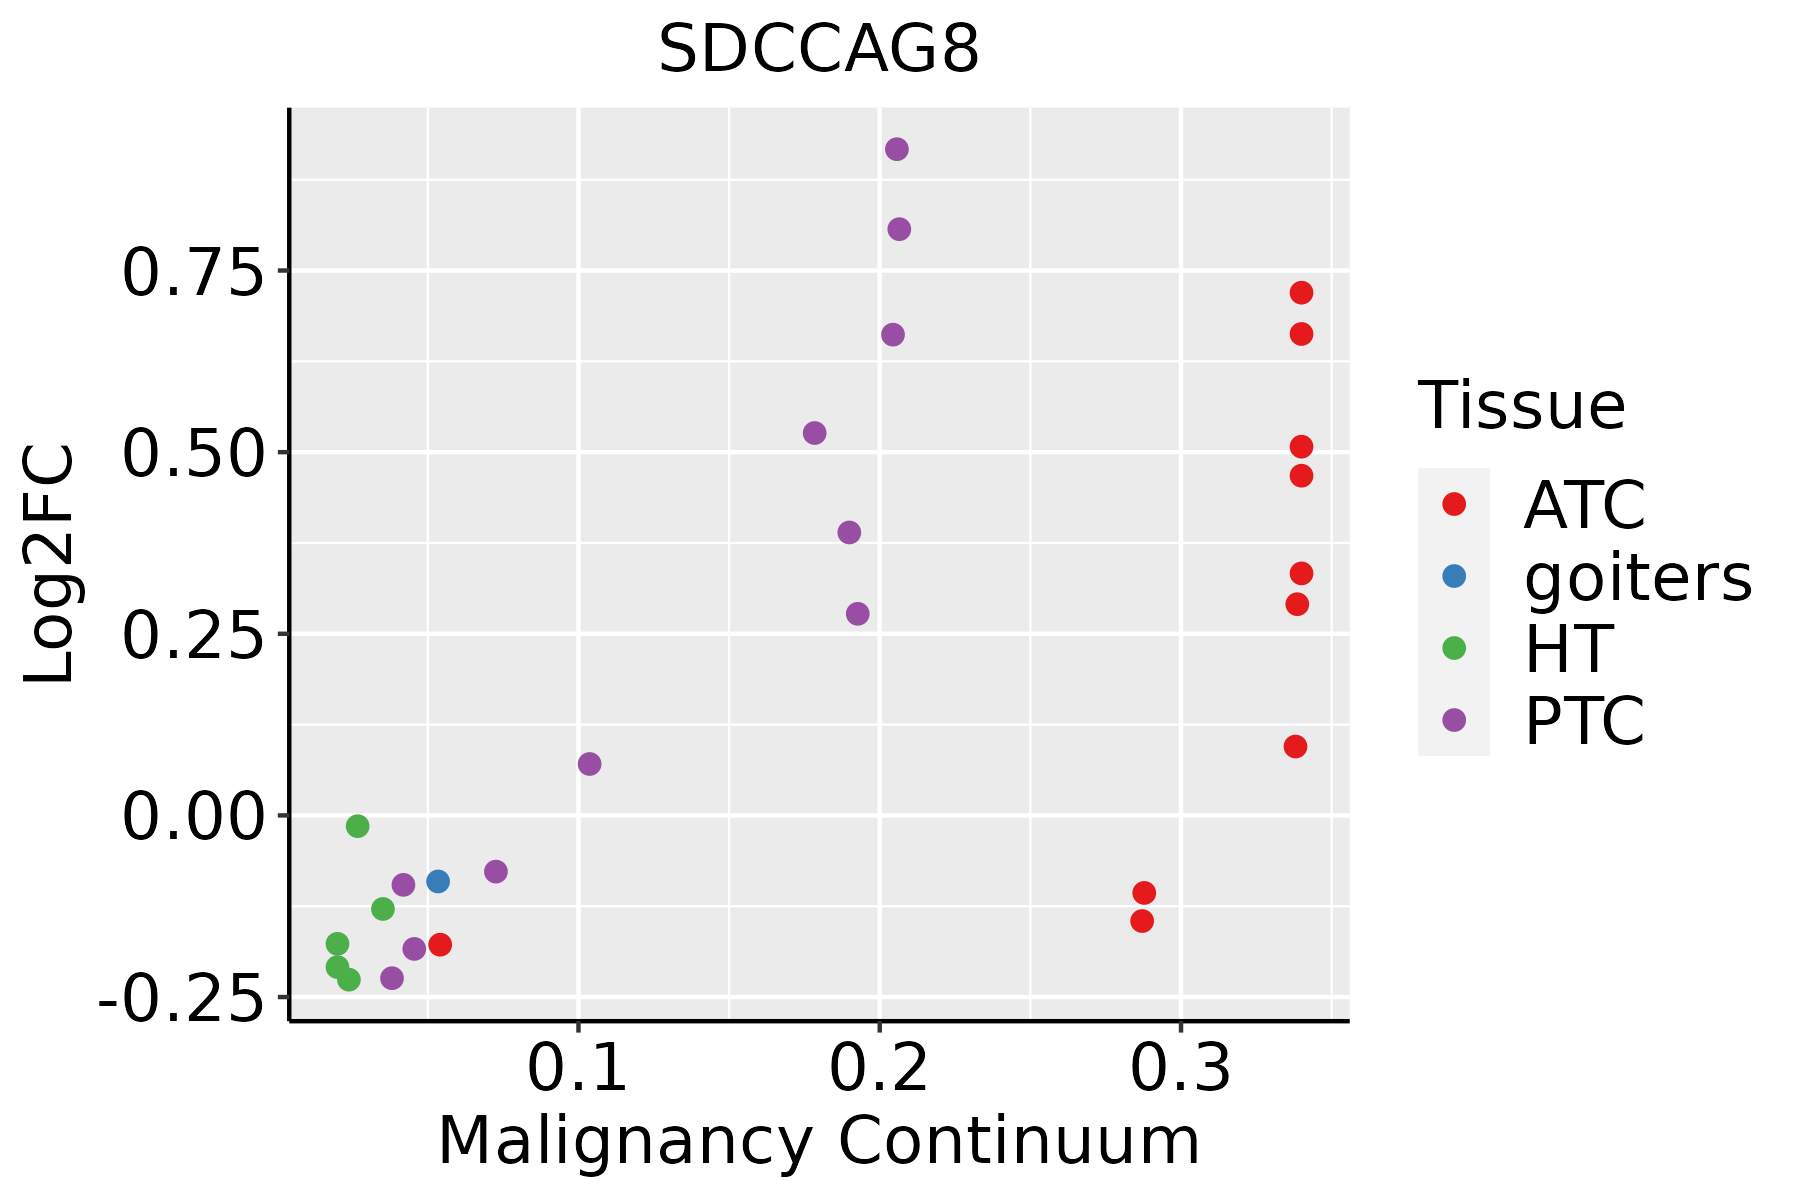 | ATC: Anaplastic thyroid cancer |
| HT: Hashimoto's thyroiditis |
| PTC: Papillary thyroid cancer |
| GO ID | Tissue | Disease Stage | Description | Gene Ratio | Bg Ratio | pvalue | p.adjust | Count |
| GO:00071639 | Cervix | CC | establishment or maintenance of cell polarity | 63/2311 | 218/18723 | 4.25e-11 | 8.76e-09 | 63 |
| GO:00300108 | Cervix | CC | establishment of cell polarity | 42/2311 | 143/18723 | 4.30e-08 | 2.62e-06 | 42 |
| GO:19021153 | Cervix | CC | regulation of organelle assembly | 40/2311 | 186/18723 | 2.92e-04 | 3.15e-03 | 40 |
| GO:01200328 | Cervix | CC | regulation of plasma membrane bounded cell projection assembly | 38/2311 | 186/18723 | 1.14e-03 | 9.35e-03 | 38 |
| GO:00604917 | Cervix | CC | regulation of cell projection assembly | 38/2311 | 188/18723 | 1.40e-03 | 1.10e-02 | 38 |
| GO:00351487 | Cervix | CC | tube formation | 31/2311 | 148/18723 | 2.07e-03 | 1.51e-02 | 31 |
| GO:19021156 | Esophagus | HGIN | regulation of organelle assembly | 46/2587 | 186/18723 | 4.63e-05 | 1.12e-03 | 46 |
| GO:006049117 | Esophagus | HGIN | regulation of cell projection assembly | 39/2587 | 188/18723 | 5.61e-03 | 4.57e-02 | 39 |
| GO:000716320 | Esophagus | ESCC | establishment or maintenance of cell polarity | 143/8552 | 218/18723 | 2.05e-09 | 4.65e-08 | 143 |
| GO:003001018 | Esophagus | ESCC | establishment of cell polarity | 96/8552 | 143/18723 | 1.69e-07 | 2.67e-06 | 96 |
| GO:003514815 | Esophagus | ESCC | tube formation | 96/8552 | 148/18723 | 1.86e-06 | 2.16e-05 | 96 |
| GO:190211514 | Esophagus | ESCC | regulation of organelle assembly | 116/8552 | 186/18723 | 3.15e-06 | 3.53e-05 | 116 |
| GO:00070982 | Esophagus | ESCC | centrosome cycle | 85/8552 | 130/18723 | 4.41e-06 | 4.69e-05 | 85 |
| GO:00310233 | Esophagus | ESCC | microtubule organizing center organization | 92/8552 | 143/18723 | 5.04e-06 | 5.31e-05 | 92 |
| GO:006049118 | Esophagus | ESCC | regulation of cell projection assembly | 110/8552 | 188/18723 | 2.60e-04 | 1.58e-03 | 110 |
| GO:012003218 | Esophagus | ESCC | regulation of plasma membrane bounded cell projection assembly | 108/8552 | 186/18723 | 4.37e-04 | 2.46e-03 | 108 |
| GO:00071636 | Liver | NAFLD | establishment or maintenance of cell polarity | 46/1882 | 218/18723 | 8.80e-07 | 4.60e-05 | 46 |
| GO:00300106 | Liver | NAFLD | establishment of cell polarity | 34/1882 | 143/18723 | 1.41e-06 | 6.56e-05 | 34 |
| GO:000716312 | Liver | Cirrhotic | establishment or maintenance of cell polarity | 82/4634 | 218/18723 | 1.55e-05 | 2.11e-04 | 82 |
| GO:1902115 | Liver | Cirrhotic | regulation of organelle assembly | 66/4634 | 186/18723 | 6.66e-04 | 5.04e-03 | 66 |
| Hugo Symbol | Variant Class | Variant Classification | dbSNP RS | HGVSc | HGVSp | HGVSp Short | SWISSPROT | BIOTYPE | SIFT | PolyPhen | Tumor Sample Barcode | Tissue | Histology | Sex | Age | Stage | Therapy Types | Drugs | Outcome |
| SDCCAG8 | SNV | Missense_Mutation | | c.1480G>C | p.Glu494Gln | p.E494Q | Q86SQ7 | protein_coding | tolerated(0.09) | possibly_damaging(0.521) | TCGA-A8-A09G-01 | Breast | breast invasive carcinoma | Female | >=65 | III/IV | Unknown | Unknown | SD |
| SDCCAG8 | SNV | Missense_Mutation | | c.1126G>C | p.Glu376Gln | p.E376Q | Q86SQ7 | protein_coding | deleterious(0) | probably_damaging(0.948) | TCGA-AC-A23H-01 | Breast | breast invasive carcinoma | Female | >=65 | I/II | Unknown | Unknown | PD |
| SDCCAG8 | SNV | Missense_Mutation | | c.1696N>A | p.Glu566Lys | p.E566K | Q86SQ7 | protein_coding | deleterious(0.03) | probably_damaging(0.997) | TCGA-C8-A12T-01 | Breast | breast invasive carcinoma | Female | <65 | I/II | Unknown | Unknown | SD |
| SDCCAG8 | SNV | Missense_Mutation | | c.431C>G | p.Ser144Cys | p.S144C | Q86SQ7 | protein_coding | tolerated(0.07) | benign(0.024) | TCGA-C8-A1HM-01 | Breast | breast invasive carcinoma | Female | >=65 | I/II | Chemotherapy | doxorubicin | CR |
| SDCCAG8 | SNV | Missense_Mutation | novel | c.35N>G | p.Glu12Gly | p.E12G | Q86SQ7 | protein_coding | deleterious(0) | possibly_damaging(0.747) | TCGA-D8-A1X9-01 | Breast | breast invasive carcinoma | Female | >=65 | I/II | Chemotherapy | adriamycin+cyclophosphamide | SD |
| SDCCAG8 | insertion | In_Frame_Ins | novel | c.48_49insACCGCAACCAACAAGGAC | p.Gln16_Tyr17insThrAlaThrAsnLysAsp | p.Q16_Y17insTATNKD | Q86SQ7 | protein_coding | | | TCGA-A8-A07G-01 | Breast | breast invasive carcinoma | Female | >=65 | I/II | Chemotherapy | 5-fluorouracil | CR |
| SDCCAG8 | deletion | In_Frame_Del | | c.1225_1230delNNNNNN | p.Ile410_Leu411del | p.I410_L411del | Q86SQ7 | protein_coding | | | TCGA-A8-A09A-01 | Breast | breast invasive carcinoma | Female | <65 | I/II | Hormone Therapy | tamoxiphen | SD |
| SDCCAG8 | deletion | Frame_Shift_Del | novel | c.1647delT | p.Phe549LeufsTer19 | p.F549Lfs*19 | Q86SQ7 | protein_coding | | | TCGA-EW-A2FV-01 | Breast | breast invasive carcinoma | Female | <65 | III/IV | Chemotherapy | docetaxel | SD |
| SDCCAG8 | SNV | Missense_Mutation | novel | c.1279A>G | p.Lys427Glu | p.K427E | Q86SQ7 | protein_coding | deleterious(0) | benign(0.085) | TCGA-2W-A8YY-01 | Cervix | cervical & endocervical cancer | Female | <65 | I/II | Chemotherapy | cisplatin | CR |
| SDCCAG8 | SNV | Missense_Mutation | rs756420930 | c.1722G>A | p.Met574Ile | p.M574I | Q86SQ7 | protein_coding | deleterious(0.01) | probably_damaging(0.986) | TCGA-DG-A2KK-01 | Cervix | cervical & endocervical cancer | Female | <65 | III/IV | Chemotherapy | cisplatin | SD |


