
|
|||||
|
 | |
| |
| |
| |
| |
| |
|
Gene: SDCCAG3 |
Gene summary for SDCCAG3 |
| Gene information | Species | Human | Gene symbol | SDCCAG3 | Gene ID | 10807 |
| Gene name | endosome associated trafficking regulator 1 | |
| Gene Alias | NY-CO-3 | |
| Cytomap | 9q34.3 | |
| Gene Type | protein-coding | GO ID | GO:0000910 | UniProtAcc | Q96C92 |
Top |
Malignant transformation analysis |
| Identification of the aberrant gene expression in precancerous and cancerous lesions by comparing the gene expression of stem-like cells in diseased tissues with normal stem cells |
| Entrez ID | Symbol | Replicates | Species | Organ | Tissue | Adj P-value | Log2FC | Malignancy |
| 10807 | SDCCAG3 | HCC1_Meng | Human | Liver | HCC | 3.87e-24 | 8.40e-02 | 0.0246 |
| 10807 | SDCCAG3 | HCC2_Meng | Human | Liver | HCC | 7.77e-11 | 1.15e-01 | 0.0107 |
| 10807 | SDCCAG3 | HCC1 | Human | Liver | HCC | 3.26e-05 | 2.32e+00 | 0.5336 |
| 10807 | SDCCAG3 | HCC2 | Human | Liver | HCC | 3.66e-09 | 2.16e+00 | 0.5341 |
| 10807 | SDCCAG3 | Pt14.a | Human | Liver | HCC | 2.63e-04 | 2.80e-01 | 0.0169 |
| 10807 | SDCCAG3 | C04 | Human | Oral cavity | OSCC | 1.40e-11 | 5.48e-01 | 0.2633 |
| 10807 | SDCCAG3 | C21 | Human | Oral cavity | OSCC | 1.15e-23 | 6.90e-01 | 0.2678 |
| 10807 | SDCCAG3 | C30 | Human | Oral cavity | OSCC | 1.83e-50 | 1.86e+00 | 0.3055 |
| 10807 | SDCCAG3 | C43 | Human | Oral cavity | OSCC | 8.45e-05 | 2.14e-01 | 0.1704 |
| 10807 | SDCCAG3 | C51 | Human | Oral cavity | OSCC | 1.74e-09 | 5.68e-01 | 0.2674 |
| 10807 | SDCCAG3 | C57 | Human | Oral cavity | OSCC | 2.91e-03 | 2.01e-01 | 0.1679 |
| 10807 | SDCCAG3 | C06 | Human | Oral cavity | OSCC | 5.38e-08 | 9.02e-01 | 0.2699 |
| 10807 | SDCCAG3 | C08 | Human | Oral cavity | OSCC | 3.17e-18 | 4.80e-01 | 0.1919 |
| 10807 | SDCCAG3 | SYSMH1 | Human | Oral cavity | OSCC | 5.58e-17 | 4.31e-01 | 0.1127 |
| 10807 | SDCCAG3 | SYSMH2 | Human | Oral cavity | OSCC | 7.99e-14 | 5.00e-01 | 0.2326 |
| 10807 | SDCCAG3 | SYSMH3 | Human | Oral cavity | OSCC | 5.29e-19 | 6.08e-01 | 0.2442 |
| 10807 | SDCCAG3 | SYSMH5 | Human | Oral cavity | OSCC | 2.74e-04 | 1.56e-01 | 0.0647 |
| Page: 1 |
| Tissue | Expression Dynamics | Abbreviation |
| Liver | 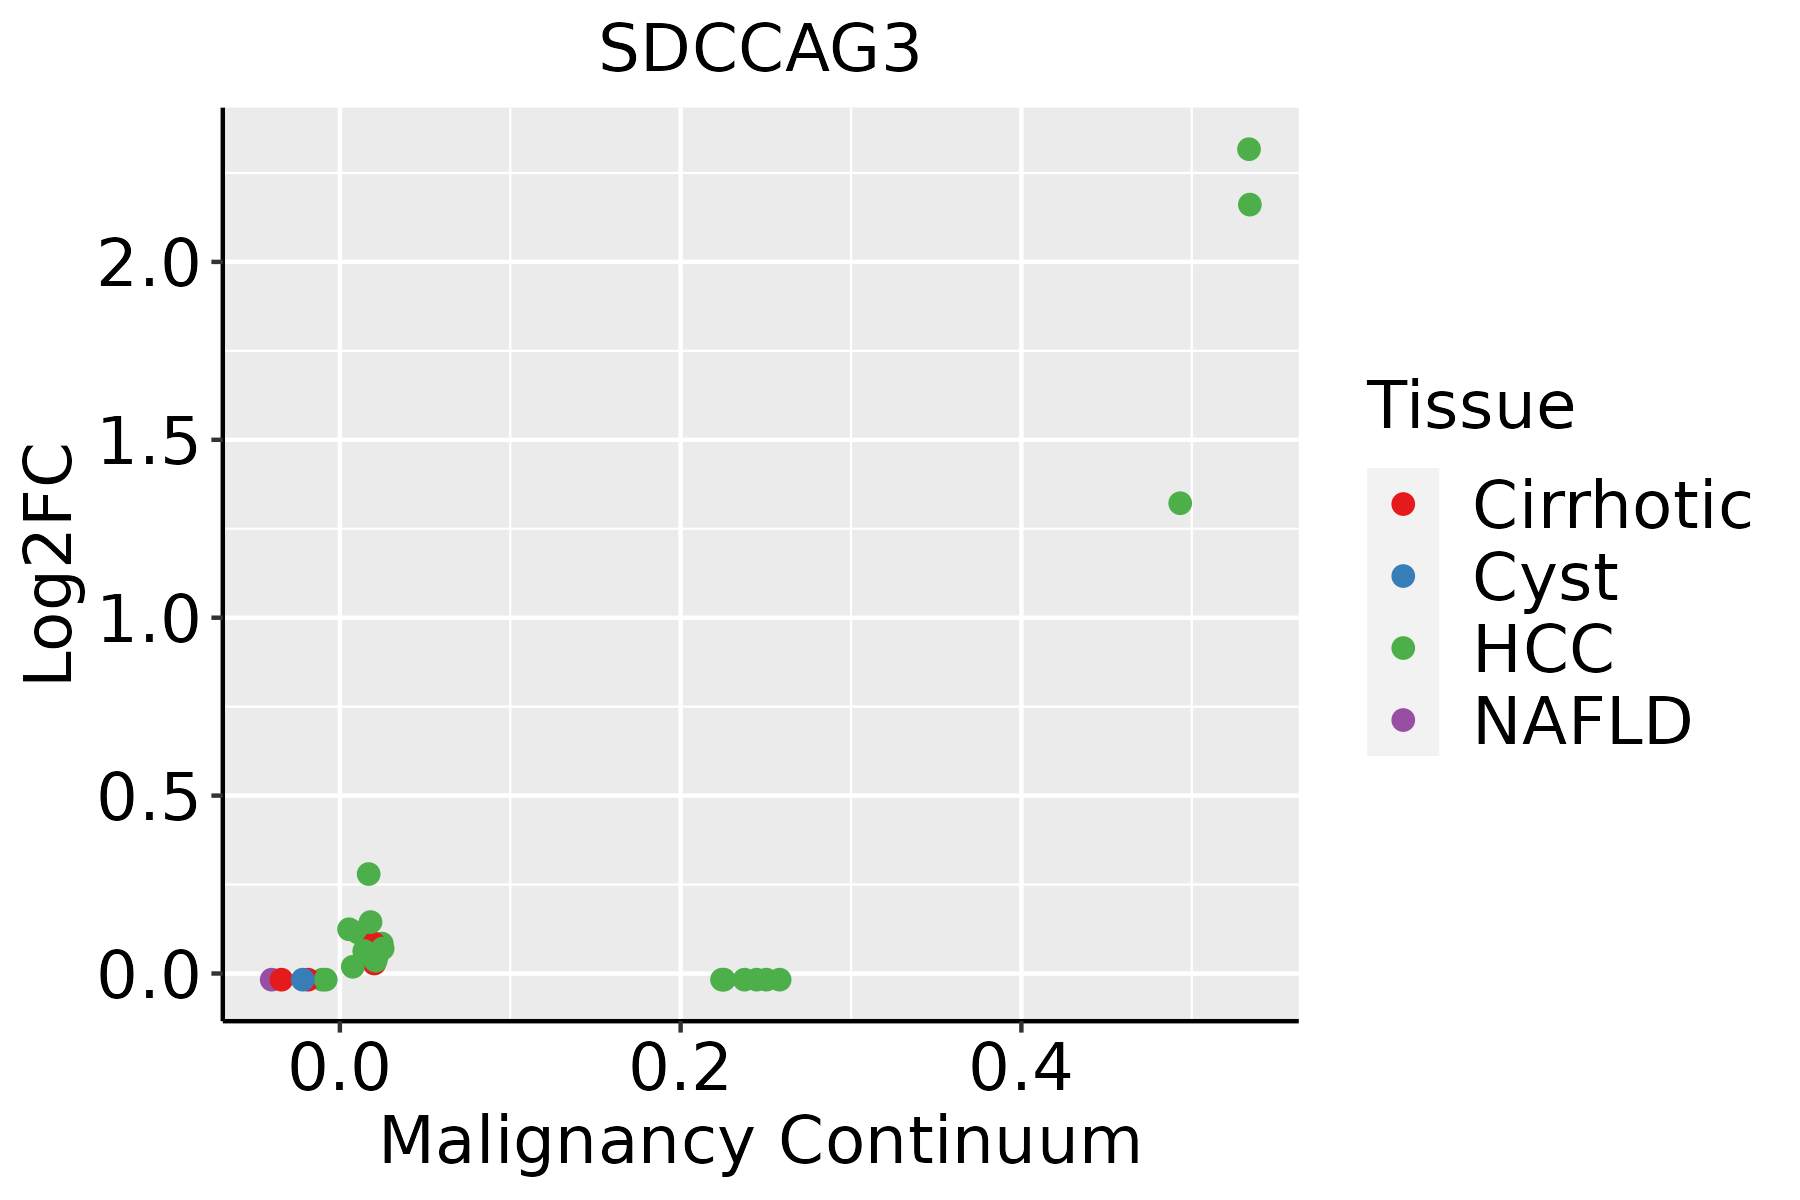 | HCC: Hepatocellular carcinoma |
| NAFLD: Non-alcoholic fatty liver disease | ||
| Oral Cavity |  | EOLP: Erosive Oral lichen planus |
| LP: leukoplakia | ||
| NEOLP: Non-erosive oral lichen planus | ||
| OSCC: Oral squamous cell carcinoma |
| ∗log2FC in expression of this searched gene in stem-like cells from each diseased tissue sample relative to stem-like cells in normal samples in each tissue plotted against the malignancy continuum. Samples are colored based on if they are from different disease stage. |
Top |
Malignant transformation related pathway analysis |
| Find out the enriched GO biological processes and KEGG pathways involved in transition from healthy to precancer to cancer |
| Tissue | Disease Stage | Enriched GO biological Processes |
| Colorectum | AD |  |
| Colorectum | SER |  |
| Colorectum | MSS |  |
| Colorectum | MSI-H |  |
| Colorectum | FAP |  |
| ∗Top 15 enriched GO BP terms are showed in the bar plot of each disease state in each tissue. Each row represents a significant GO biological process which is colored according to the -log10(p.adjust). |
| Page: 1 2 3 4 5 6 7 8 9 |
| GO ID | Tissue | Disease Stage | Description | Gene Ratio | Bg Ratio | pvalue | p.adjust | Count |
| Page: 1 |
| Pathway ID | Tissue | Disease Stage | Description | Gene Ratio | Bg Ratio | pvalue | p.adjust | qvalue | Count |
| Page: 1 |
Top |
Cell-cell communication analysis |
| Identification of potential cell-cell interactions between two cell types and their ligand-receptor pairs for different disease states |
| Ligand | Receptor | LRpair | Pathway | Tissue | Disease Stage |
| Page: 1 |
Top |
Single-cell gene regulatory network inference analysis |
| Find out the significant the regulons (TFs) and the target genes of each regulon across cell types for different disease states |
| TF | Cell Type | Tissue | Disease Stage | Target Gene | RSS | Regulon Activity |
| ∗The dot plots of a searched regulon are shown for all cell subpopulations in each disease state of each tissue based on the regulon specific score inferred using pySCENIC and by calculating the average expression. |
| Page: 1 |
Top |
Somatic mutation of malignant transformation related genes |
| Annotation of somatic variants for genes involved in malignant transformation |
| Hugo Symbol | Variant Class | Variant Classification | dbSNP RS | HGVSc | HGVSp | HGVSp Short | SWISSPROT | BIOTYPE | SIFT | PolyPhen | Tumor Sample Barcode | Tissue | Histology | Sex | Age | Stage | Therapy Types | Drugs | Outcome |
| SDCCAG3 | SNV | Missense_Mutation | c.728N>T | p.Ser243Phe | p.S243F | Q96C92 | protein_coding | deleterious(0) | probably_damaging(0.982) | TCGA-AC-A23H-01 | Breast | breast invasive carcinoma | Female | >=65 | I/II | Unknown | Unknown | PD | |
| SDCCAG3 | SNV | Missense_Mutation | novel | c.1288N>T | p.Asp430Tyr | p.D430Y | Q96C92 | protein_coding | deleterious(0) | possibly_damaging(0.807) | TCGA-AN-A046-01 | Breast | breast invasive carcinoma | Female | >=65 | I/II | Unknown | Unknown | SD |
| SDCCAG3 | SNV | Missense_Mutation | novel | c.971T>A | p.Val324Asp | p.V324D | Q96C92 | protein_coding | deleterious(0) | probably_damaging(0.973) | TCGA-AN-A0AK-01 | Breast | breast invasive carcinoma | Female | >=65 | I/II | Unknown | Unknown | SD |
| SDCCAG3 | SNV | Missense_Mutation | c.797N>G | p.Thr266Arg | p.T266R | Q96C92 | protein_coding | deleterious(0) | possibly_damaging(0.868) | TCGA-AR-A1AJ-01 | Breast | breast invasive carcinoma | Female | >=65 | I/II | Unknown | Unknown | SD | |
| SDCCAG3 | SNV | Missense_Mutation | rs371939772 | c.748N>A | p.Ala250Thr | p.A250T | Q96C92 | protein_coding | tolerated(0.74) | benign(0.001) | TCGA-2W-A8YY-01 | Cervix | cervical & endocervical cancer | Female | <65 | I/II | Chemotherapy | cisplatin | CR |
| SDCCAG3 | SNV | Missense_Mutation | c.692N>T | p.Ala231Val | p.A231V | Q96C92 | protein_coding | tolerated(0.06) | benign(0.176) | TCGA-EA-A410-01 | Cervix | cervical & endocervical cancer | Female | <65 | I/II | Unknown | Unknown | SD | |
| SDCCAG3 | SNV | Missense_Mutation | c.317N>G | p.Ala106Gly | p.A106G | Q96C92 | protein_coding | deleterious(0.01) | possibly_damaging(0.705) | TCGA-EK-A2PM-01 | Cervix | cervical & endocervical cancer | Female | >=65 | I/II | Unknown | Unknown | SD | |
| SDCCAG3 | SNV | Missense_Mutation | novel | c.214G>T | p.Asp72Tyr | p.D72Y | Q96C92 | protein_coding | deleterious_low_confidence(0.01) | possibly_damaging(0.663) | TCGA-AA-A010-01 | Colorectum | colon adenocarcinoma | Female | <65 | I/II | Chemotherapy | folinic | CR |
| SDCCAG3 | SNV | Missense_Mutation | c.686N>T | p.Ser229Leu | p.S229L | Q96C92 | protein_coding | tolerated(0.14) | benign(0) | TCGA-AA-A01X-01 | Colorectum | colon adenocarcinoma | Female | >=65 | III/IV | Unknown | Unknown | PD | |
| SDCCAG3 | SNV | Missense_Mutation | c.686C>T | p.Ser229Leu | p.S229L | Q96C92 | protein_coding | tolerated(0.14) | benign(0) | TCGA-AA-A022-01 | Colorectum | colon adenocarcinoma | Female | >=65 | I/II | Unknown | Unknown | SD |
| Page: 1 2 3 4 5 |
Top |
Related drugs of malignant transformation related genes |
| Identification of chemicals and drugs interact with genes involved in malignant transfromation |
| (DGIdb 4.0) |
| Entrez ID | Symbol | Category | Interaction Types | Drug Claim Name | Drug Name | PMIDs |
| Page: 1 |

Copyright 2023-Present -The University of Texas Health Science Center at Houston |