
|
|||||
|
 | |
| |
| |
| |
| |
| |
|
Gene: SDC3 |
Gene summary for SDC3 |
| Gene information | Species | Human | Gene symbol | SDC3 | Gene ID | 9672 |
| Gene name | syndecan 3 | |
| Gene Alias | SDCN | |
| Cytomap | 1p35.2 | |
| Gene Type | protein-coding | GO ID | GO:0006928 | UniProtAcc | O75056 |
Top |
Malignant transformation analysis |
| Identification of the aberrant gene expression in precancerous and cancerous lesions by comparing the gene expression of stem-like cells in diseased tissues with normal stem cells |
| Entrez ID | Symbol | Replicates | Species | Organ | Tissue | Adj P-value | Log2FC | Malignancy |
| 9672 | SDC3 | P2T-E | Human | Esophagus | ESCC | 4.85e-05 | 8.44e-02 | 0.1177 |
| 9672 | SDC3 | P4T-E | Human | Esophagus | ESCC | 6.60e-04 | 9.10e-02 | 0.1323 |
| 9672 | SDC3 | P10T-E | Human | Esophagus | ESCC | 3.74e-05 | 7.38e-02 | 0.116 |
| 9672 | SDC3 | P11T-E | Human | Esophagus | ESCC | 1.16e-05 | 3.58e-01 | 0.1426 |
| 9672 | SDC3 | P12T-E | Human | Esophagus | ESCC | 6.85e-09 | 9.43e-02 | 0.1122 |
| 9672 | SDC3 | P15T-E | Human | Esophagus | ESCC | 5.46e-05 | 9.14e-02 | 0.1149 |
| 9672 | SDC3 | P16T-E | Human | Esophagus | ESCC | 3.92e-03 | 4.33e-02 | 0.1153 |
| 9672 | SDC3 | P19T-E | Human | Esophagus | ESCC | 4.67e-08 | 9.09e-01 | 0.1662 |
| 9672 | SDC3 | P21T-E | Human | Esophagus | ESCC | 1.53e-07 | 1.17e-01 | 0.1617 |
| 9672 | SDC3 | P28T-E | Human | Esophagus | ESCC | 1.15e-04 | 1.39e-01 | 0.1149 |
| 9672 | SDC3 | P31T-E | Human | Esophagus | ESCC | 9.07e-11 | 8.17e-02 | 0.1251 |
| 9672 | SDC3 | P32T-E | Human | Esophagus | ESCC | 2.12e-04 | 1.34e-01 | 0.1666 |
| 9672 | SDC3 | P37T-E | Human | Esophagus | ESCC | 1.96e-12 | 2.85e-01 | 0.1371 |
| 9672 | SDC3 | P42T-E | Human | Esophagus | ESCC | 8.68e-05 | 1.46e-01 | 0.1175 |
| 9672 | SDC3 | P48T-E | Human | Esophagus | ESCC | 1.40e-03 | 4.77e-02 | 0.0959 |
| 9672 | SDC3 | P52T-E | Human | Esophagus | ESCC | 3.11e-03 | 1.06e-01 | 0.1555 |
| 9672 | SDC3 | P57T-E | Human | Esophagus | ESCC | 6.47e-06 | 9.13e-02 | 0.0926 |
| 9672 | SDC3 | P61T-E | Human | Esophagus | ESCC | 2.29e-08 | 2.28e-01 | 0.099 |
| 9672 | SDC3 | P62T-E | Human | Esophagus | ESCC | 3.54e-02 | 2.23e-02 | 0.1302 |
| 9672 | SDC3 | P65T-E | Human | Esophagus | ESCC | 1.38e-03 | 4.31e-02 | 0.0978 |
| Page: 1 2 3 |
| Tissue | Expression Dynamics | Abbreviation |
| Esophagus | 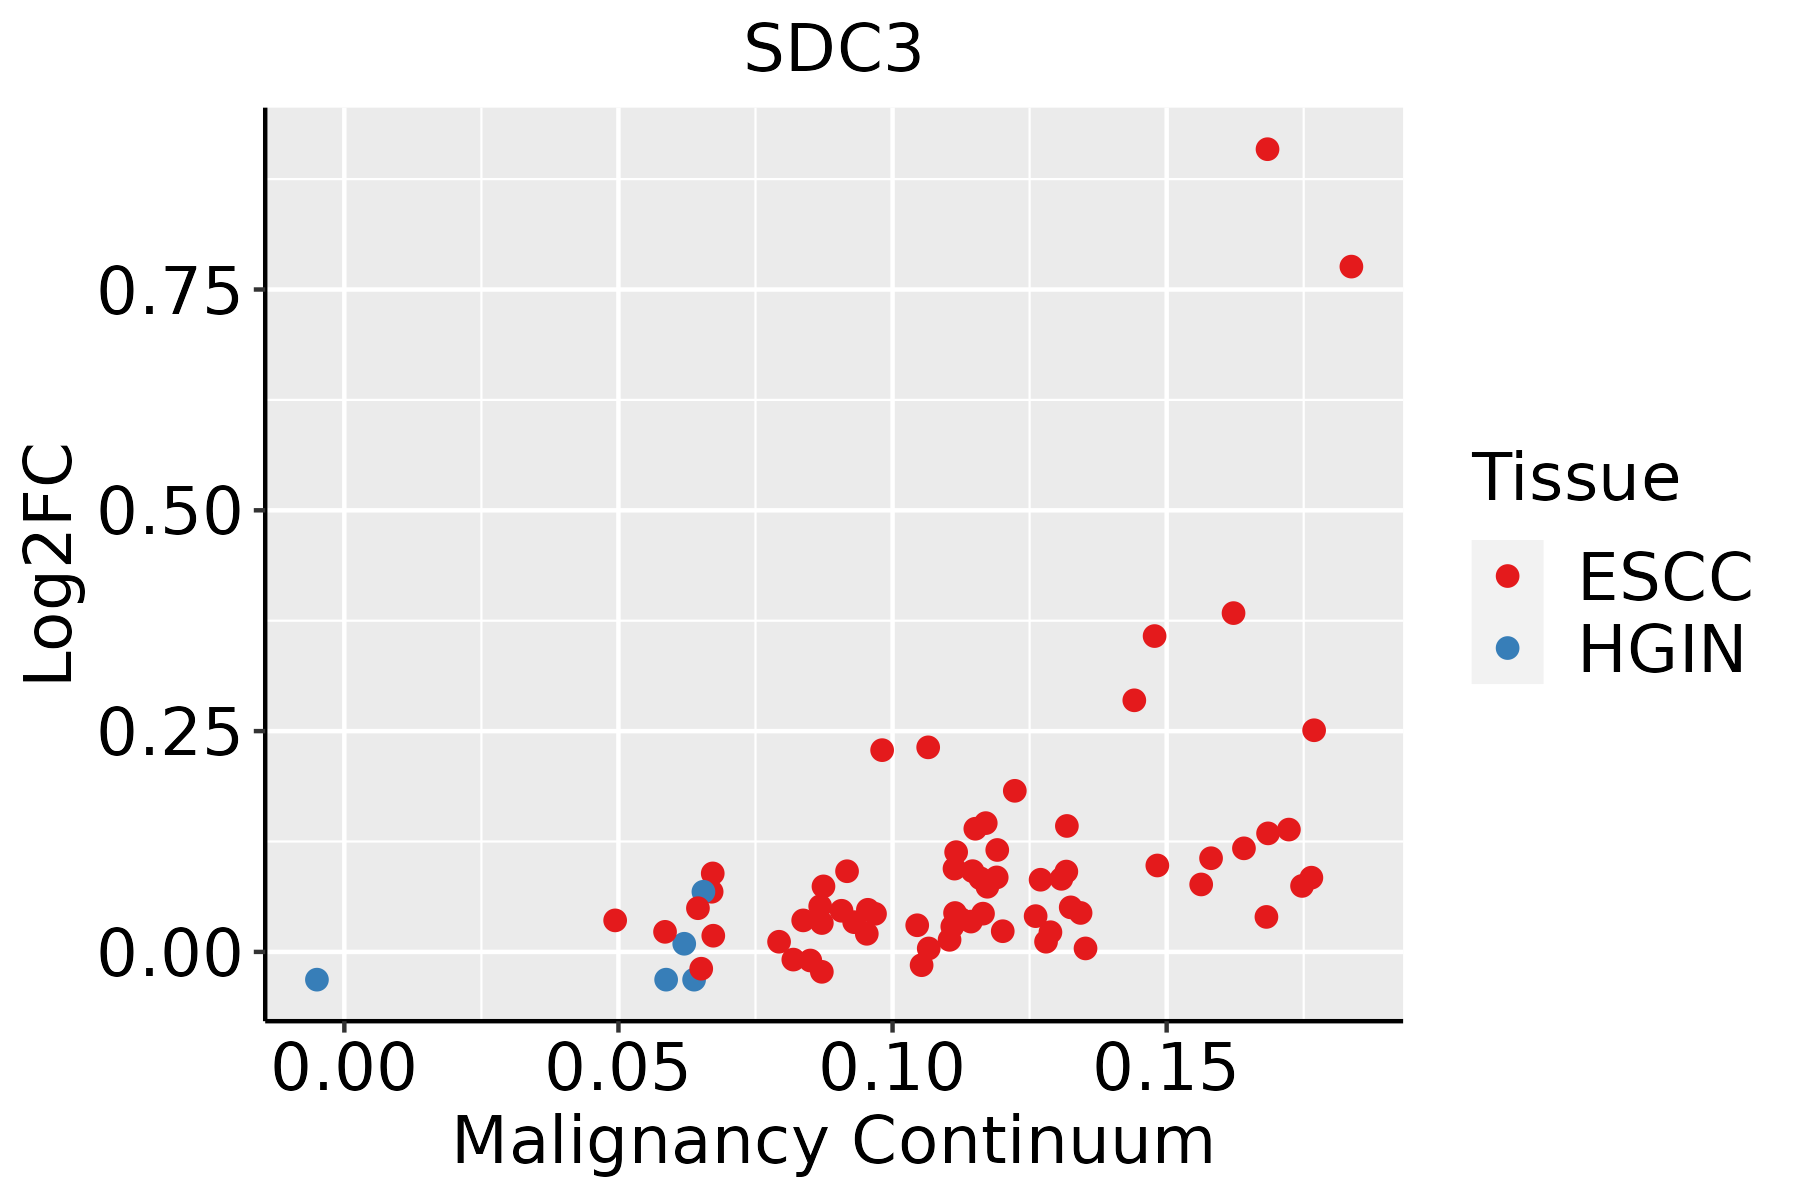 | ESCC: Esophageal squamous cell carcinoma |
| HGIN: High-grade intraepithelial neoplasias | ||
| LGIN: Low-grade intraepithelial neoplasias | ||
| Liver | 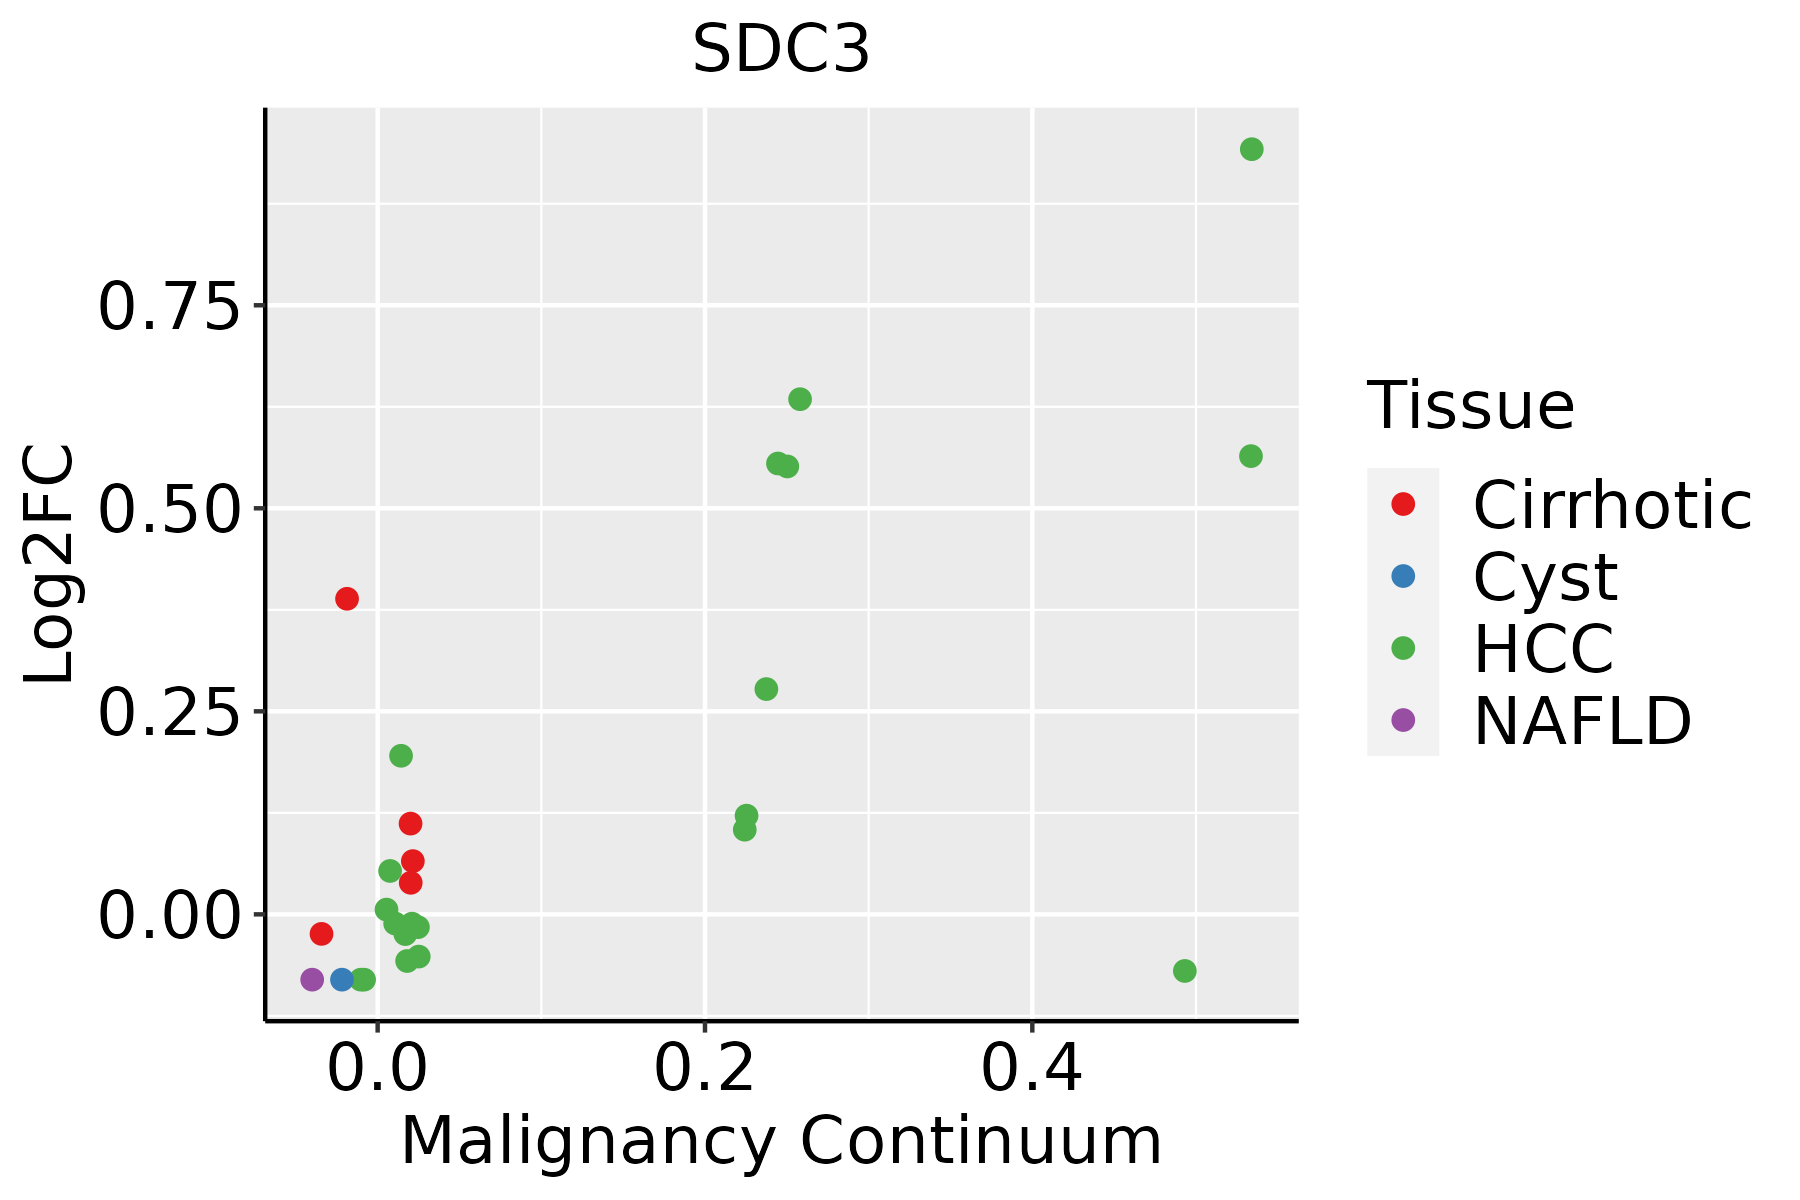 | HCC: Hepatocellular carcinoma |
| NAFLD: Non-alcoholic fatty liver disease | ||
| Oral Cavity |  | EOLP: Erosive Oral lichen planus |
| LP: leukoplakia | ||
| NEOLP: Non-erosive oral lichen planus | ||
| OSCC: Oral squamous cell carcinoma | ||
| Thyroid | 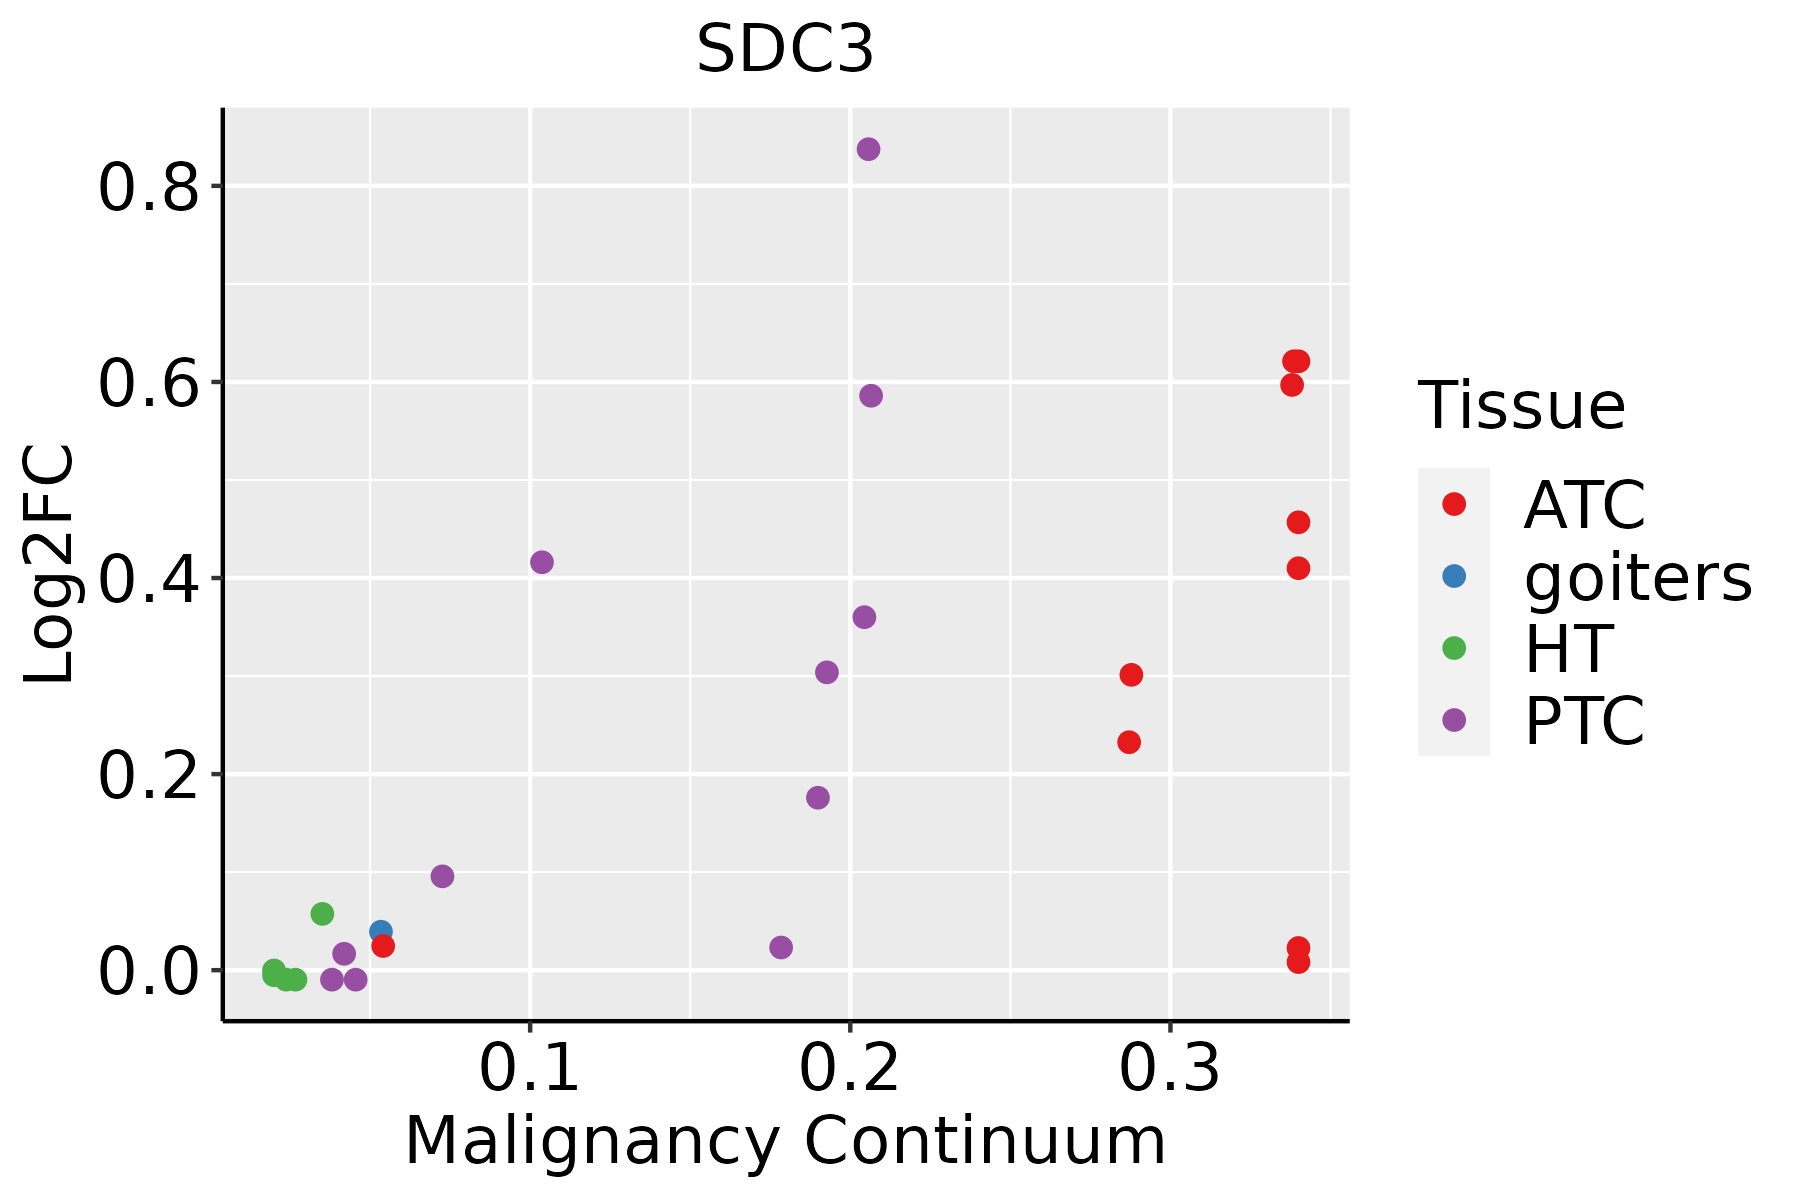 | ATC: Anaplastic thyroid cancer |
| HT: Hashimoto's thyroiditis | ||
| PTC: Papillary thyroid cancer |
| ∗log2FC in expression of this searched gene in stem-like cells from each diseased tissue sample relative to stem-like cells in normal samples in each tissue plotted against the malignancy continuum. Samples are colored based on if they are from different disease stage. |
Top |
Malignant transformation related pathway analysis |
| Find out the enriched GO biological processes and KEGG pathways involved in transition from healthy to precancer to cancer |
| Tissue | Disease Stage | Enriched GO biological Processes |
| Colorectum | AD |  |
| Colorectum | SER |  |
| Colorectum | MSS |  |
| Colorectum | MSI-H |  |
| Colorectum | FAP |  |
| ∗Top 15 enriched GO BP terms are showed in the bar plot of each disease state in each tissue. Each row represents a significant GO biological process which is colored according to the -log10(p.adjust). |
| Page: 1 2 3 4 5 6 7 8 9 |
| GO ID | Tissue | Disease Stage | Description | Gene Ratio | Bg Ratio | pvalue | p.adjust | Count |
| Page: 1 |
| Pathway ID | Tissue | Disease Stage | Description | Gene Ratio | Bg Ratio | pvalue | p.adjust | qvalue | Count |
| Page: 1 |
Top |
Cell-cell communication analysis |
| Identification of potential cell-cell interactions between two cell types and their ligand-receptor pairs for different disease states |
| Ligand | Receptor | LRpair | Pathway | Tissue | Disease Stage |
| PTN | SDC3 | PTN_SDC3 | PTN | Breast | DCIS |
| ANGPTL4 | SDC3 | ANGPTL4_SDC3 | ANGPTL | Breast | DCIS |
| ANGPTL4 | SDC3 | ANGPTL4_SDC3 | ANGPTL | Breast | IDC |
| PTN | SDC3 | PTN_SDC3 | PTN | Cervix | CC |
| ANGPTL4 | SDC3 | ANGPTL4_SDC3 | ANGPTL | Cervix | CC |
| PTN | SDC3 | PTN_SDC3 | PTN | Cervix | Precancer |
| PTN | SDC3 | PTN_SDC3 | PTN | Endometrium | Healthy |
| PTN | SDC3 | PTN_SDC3 | PTN | Esophagus | ESCC |
| ANGPTL4 | SDC3 | ANGPTL4_SDC3 | ANGPTL | Esophagus | ESCC |
| PTN | SDC3 | PTN_SDC3 | PTN | HNSCC | OSCC |
| ANGPTL4 | SDC3 | ANGPTL4_SDC3 | ANGPTL | HNSCC | OSCC |
| ANGPTL4 | SDC3 | ANGPTL4_SDC3 | ANGPTL | HNSCC | Precancer |
| PTN | SDC3 | PTN_SDC3 | PTN | HNSCC | Precancer |
| PTN | SDC3 | PTN_SDC3 | PTN | Liver | HCC |
| ANGPTL4 | SDC3 | ANGPTL4_SDC3 | ANGPTL | Liver | HCC |
| ANGPTL4 | SDC3 | ANGPTL4_SDC3 | ANGPTL | Liver | Healthy |
| PTN | SDC3 | PTN_SDC3 | PTN | Liver | Healthy |
| ANGPTL4 | SDC3 | ANGPTL4_SDC3 | ANGPTL | Liver | Precancer |
| PTN | SDC3 | PTN_SDC3 | PTN | Liver | Precancer |
| PTN | SDC3 | PTN_SDC3 | PTN | Lung | AAH |
| Page: 1 |
Top |
Single-cell gene regulatory network inference analysis |
| Find out the significant the regulons (TFs) and the target genes of each regulon across cell types for different disease states |
| TF | Cell Type | Tissue | Disease Stage | Target Gene | RSS | Regulon Activity |
| ∗The dot plots of a searched regulon are shown for all cell subpopulations in each disease state of each tissue based on the regulon specific score inferred using pySCENIC and by calculating the average expression. |
| Page: 1 |
Top |
Somatic mutation of malignant transformation related genes |
| Annotation of somatic variants for genes involved in malignant transformation |
| Hugo Symbol | Variant Class | Variant Classification | dbSNP RS | HGVSc | HGVSp | HGVSp Short | SWISSPROT | BIOTYPE | SIFT | PolyPhen | Tumor Sample Barcode | Tissue | Histology | Sex | Age | Stage | Therapy Types | Drugs | Outcome |
| SDC3 | SNV | Missense_Mutation | novel | c.1076G>A | p.Gly359Asp | p.G359D | O75056 | protein_coding | tolerated(0.3) | benign(0.044) | TCGA-AC-A3W5-01 | Breast | breast invasive carcinoma | Female | >=65 | I/II | Chemotherapy | docetaxel | CR |
| SDC3 | deletion | Frame_Shift_Del | novel | c.789delC | p.Thr264ProfsTer35 | p.T264Pfs*35 | O75056 | protein_coding | TCGA-EW-A2FV-01 | Breast | breast invasive carcinoma | Female | <65 | III/IV | Chemotherapy | docetaxel | SD | ||
| SDC3 | SNV | Missense_Mutation | rs556133593 | c.317C>T | p.Ala106Val | p.A106V | O75056 | protein_coding | tolerated(0.12) | benign(0.109) | TCGA-2W-A8YY-01 | Cervix | cervical & endocervical cancer | Female | <65 | I/II | Chemotherapy | cisplatin | CR |
| SDC3 | SNV | Missense_Mutation | rs556133593 | c.317C>T | p.Ala106Val | p.A106V | O75056 | protein_coding | tolerated(0.12) | benign(0.109) | TCGA-A6-2686-01 | Colorectum | colon adenocarcinoma | Female | >=65 | I/II | Unknown | Unknown | SD |
| SDC3 | SNV | Missense_Mutation | rs780253075 | c.662C>T | p.Thr221Met | p.T221M | O75056 | protein_coding | deleterious(0.03) | possibly_damaging(0.873) | TCGA-AA-3864-01 | Colorectum | colon adenocarcinoma | Male | >=65 | I/II | Unknown | Unknown | SD |
| SDC3 | SNV | Missense_Mutation | rs201140173 | c.272C>T | p.Ser91Leu | p.S91L | O75056 | protein_coding | tolerated(0.08) | possibly_damaging(0.87) | TCGA-AA-A00N-01 | Colorectum | colon adenocarcinoma | Male | >=65 | I/II | Unknown | Unknown | PD |
| SDC3 | SNV | Missense_Mutation | rs549486633 | c.251N>T | p.Ser84Leu | p.S84L | O75056 | protein_coding | deleterious(0) | probably_damaging(0.998) | TCGA-AA-A010-01 | Colorectum | colon adenocarcinoma | Female | <65 | I/II | Chemotherapy | folinic | CR |
| SDC3 | SNV | Missense_Mutation | c.430N>A | p.Val144Met | p.V144M | O75056 | protein_coding | tolerated(0.19) | benign(0.003) | TCGA-AD-6888-01 | Colorectum | colon adenocarcinoma | Male | >=65 | III/IV | Unknown | Unknown | PD | |
| SDC3 | SNV | Missense_Mutation | c.1007N>C | p.Val336Ala | p.V336A | O75056 | protein_coding | deleterious(0.02) | benign(0.285) | TCGA-CK-5916-01 | Colorectum | colon adenocarcinoma | Female | >=65 | I/II | Unknown | Unknown | PD | |
| SDC3 | SNV | Missense_Mutation | rs756527724 | c.1019N>T | p.Ala340Val | p.A340V | O75056 | protein_coding | tolerated_low_confidence(0.2) | benign(0.003) | TCGA-F4-6703-01 | Colorectum | colon adenocarcinoma | Male | <65 | I/II | Unknown | Unknown | SD |
| Page: 1 2 3 |
Top |
Related drugs of malignant transformation related genes |
| Identification of chemicals and drugs interact with genes involved in malignant transfromation |
| (DGIdb 4.0) |
| Entrez ID | Symbol | Category | Interaction Types | Drug Claim Name | Drug Name | PMIDs |
| Page: 1 |

Copyright 2023-Present -The University of Texas Health Science Center at Houston |