
|
|||||
|
 | |
| |
| |
| |
| |
| |
|
Gene: SDC2 |
Gene summary for SDC2 |
| Gene information | Species | Human | Gene symbol | SDC2 | Gene ID | 6383 |
| Gene name | syndecan 2 | |
| Gene Alias | CD362 | |
| Cytomap | 8q22.1 | |
| Gene Type | protein-coding | GO ID | GO:0000902 | UniProtAcc | A0A024R9D1 |
Top |
Malignant transformation analysis |
| Identification of the aberrant gene expression in precancerous and cancerous lesions by comparing the gene expression of stem-like cells in diseased tissues with normal stem cells |
| Entrez ID | Symbol | Replicates | Species | Organ | Tissue | Adj P-value | Log2FC | Malignancy |
| 6383 | SDC2 | GSM4909281 | Human | Breast | IDC | 8.25e-55 | 9.48e-01 | 0.21 |
| 6383 | SDC2 | GSM4909282 | Human | Breast | IDC | 4.15e-04 | 1.79e-01 | -0.0288 |
| 6383 | SDC2 | GSM4909285 | Human | Breast | IDC | 5.05e-04 | 1.34e-01 | 0.21 |
| 6383 | SDC2 | GSM4909295 | Human | Breast | IDC | 3.30e-06 | 4.16e-01 | 0.0898 |
| 6383 | SDC2 | GSM4909299 | Human | Breast | IDC | 7.12e-13 | 4.31e-01 | 0.035 |
| 6383 | SDC2 | GSM4909305 | Human | Breast | IDC | 2.71e-08 | 3.94e-01 | 0.0436 |
| 6383 | SDC2 | GSM4909313 | Human | Breast | IDC | 4.74e-02 | 2.44e-01 | 0.0391 |
| 6383 | SDC2 | DCIS2 | Human | Breast | DCIS | 6.89e-48 | 2.91e-01 | 0.0085 |
| 6383 | SDC2 | AEH-subject1 | Human | Endometrium | AEH | 2.01e-14 | -4.25e-01 | -0.3059 |
| 6383 | SDC2 | AEH-subject2 | Human | Endometrium | AEH | 3.48e-18 | -5.08e-01 | -0.2525 |
| 6383 | SDC2 | AEH-subject3 | Human | Endometrium | AEH | 3.18e-23 | -5.11e-01 | -0.2576 |
| 6383 | SDC2 | AEH-subject4 | Human | Endometrium | AEH | 4.47e-09 | -2.99e-01 | -0.2657 |
| 6383 | SDC2 | AEH-subject5 | Human | Endometrium | AEH | 6.94e-10 | -3.34e-01 | -0.2953 |
| 6383 | SDC2 | EEC-subject1 | Human | Endometrium | EEC | 2.09e-21 | -5.23e-01 | -0.2682 |
| 6383 | SDC2 | EEC-subject2 | Human | Endometrium | EEC | 7.51e-24 | -5.08e-01 | -0.2607 |
| 6383 | SDC2 | EEC-subject3 | Human | Endometrium | EEC | 1.38e-46 | -5.92e-01 | -0.2525 |
| 6383 | SDC2 | EEC-subject4 | Human | Endometrium | EEC | 5.32e-12 | -4.02e-01 | -0.2571 |
| 6383 | SDC2 | EEC-subject5 | Human | Endometrium | EEC | 3.95e-29 | -5.94e-01 | -0.249 |
| 6383 | SDC2 | GSM5276934 | Human | Endometrium | EEC | 5.17e-11 | -2.71e-01 | -0.0913 |
| 6383 | SDC2 | GSM5276935 | Human | Endometrium | EEC | 1.81e-05 | -3.00e-01 | -0.123 |
| Page: 1 2 3 4 5 6 |
| Tissue | Expression Dynamics | Abbreviation |
| Breast | 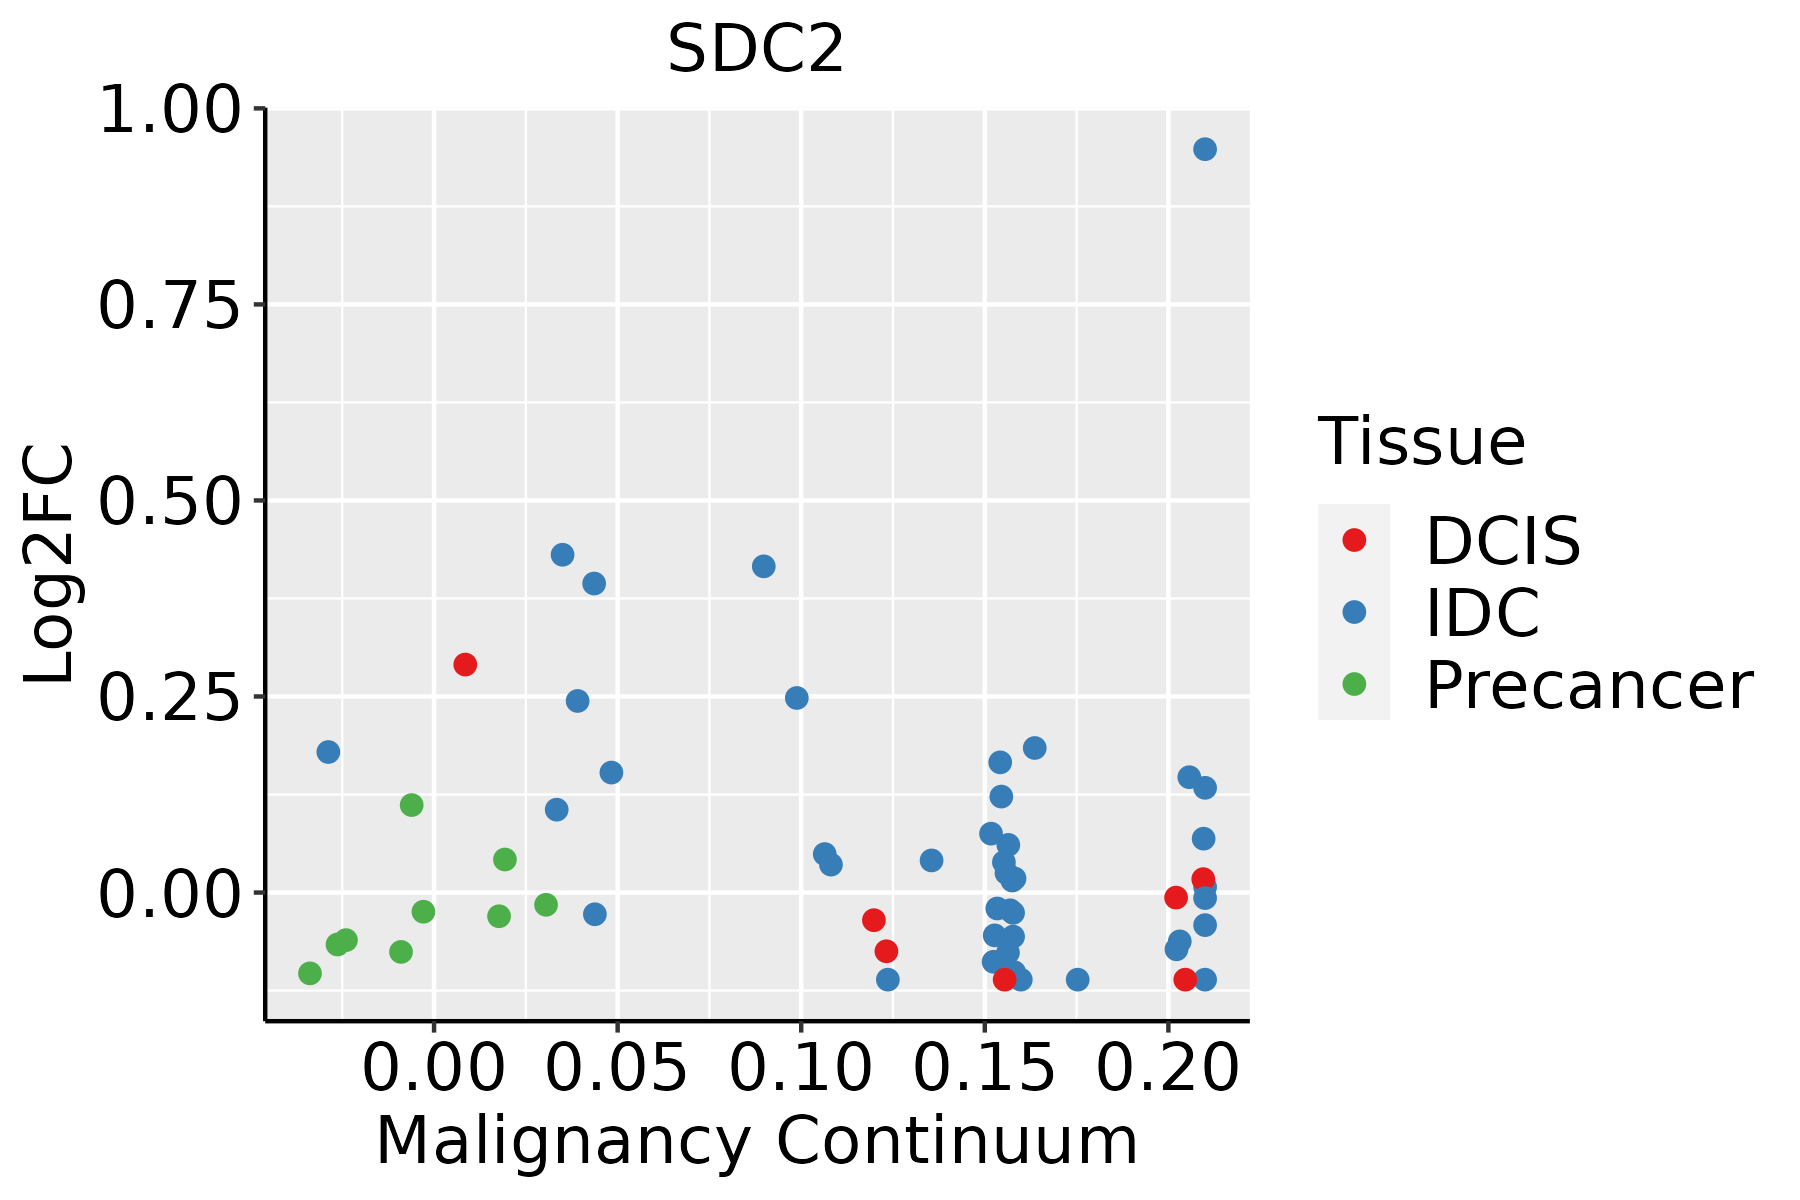 | IDC: Invasive ductal carcinoma |
| DCIS: Ductal carcinoma in situ | ||
| Precancer(BRCA1-mut): Precancerous lesion from BRCA1 mutation carriers | ||
| Endometrium |  | AEH: Atypical endometrial hyperplasia |
| EEC: Endometrioid Cancer | ||
| Esophagus | 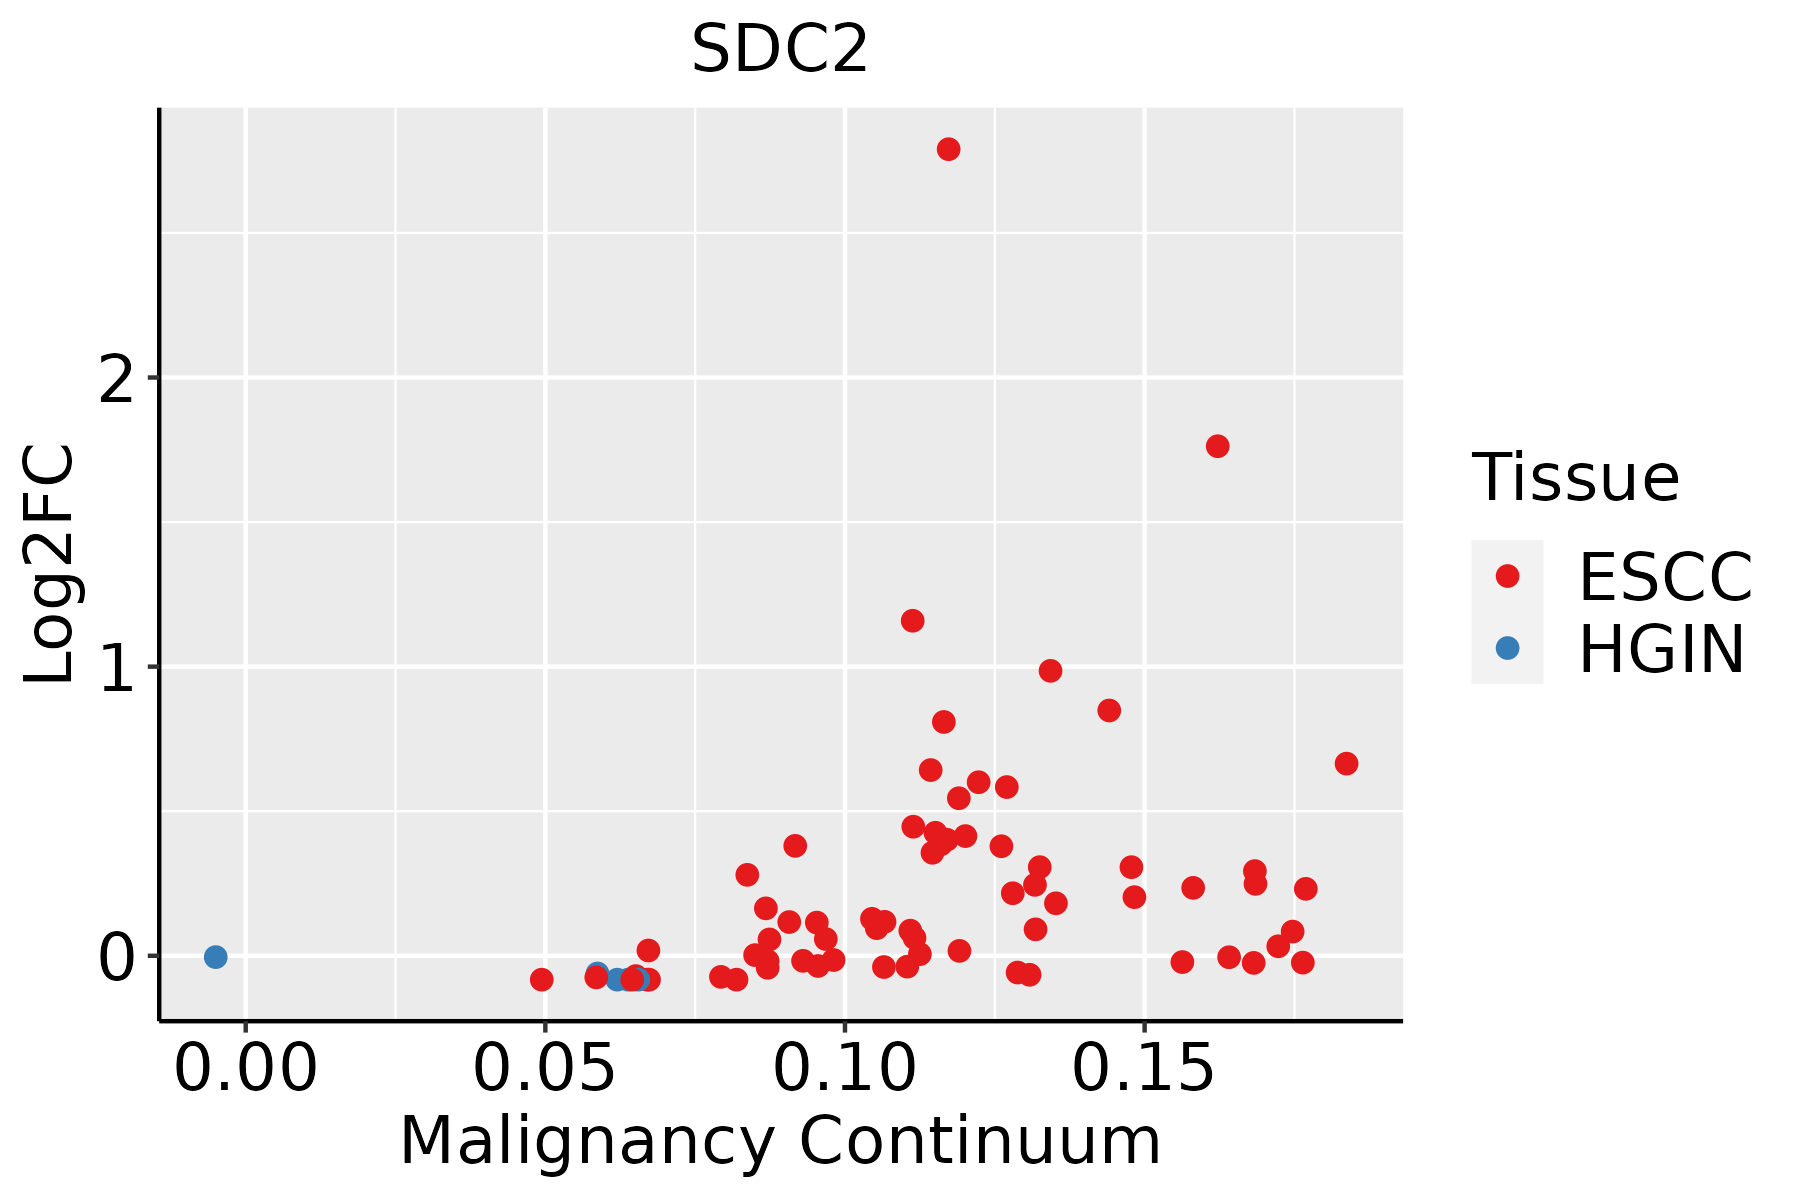 | ESCC: Esophageal squamous cell carcinoma |
| HGIN: High-grade intraepithelial neoplasias | ||
| LGIN: Low-grade intraepithelial neoplasias | ||
| Liver | 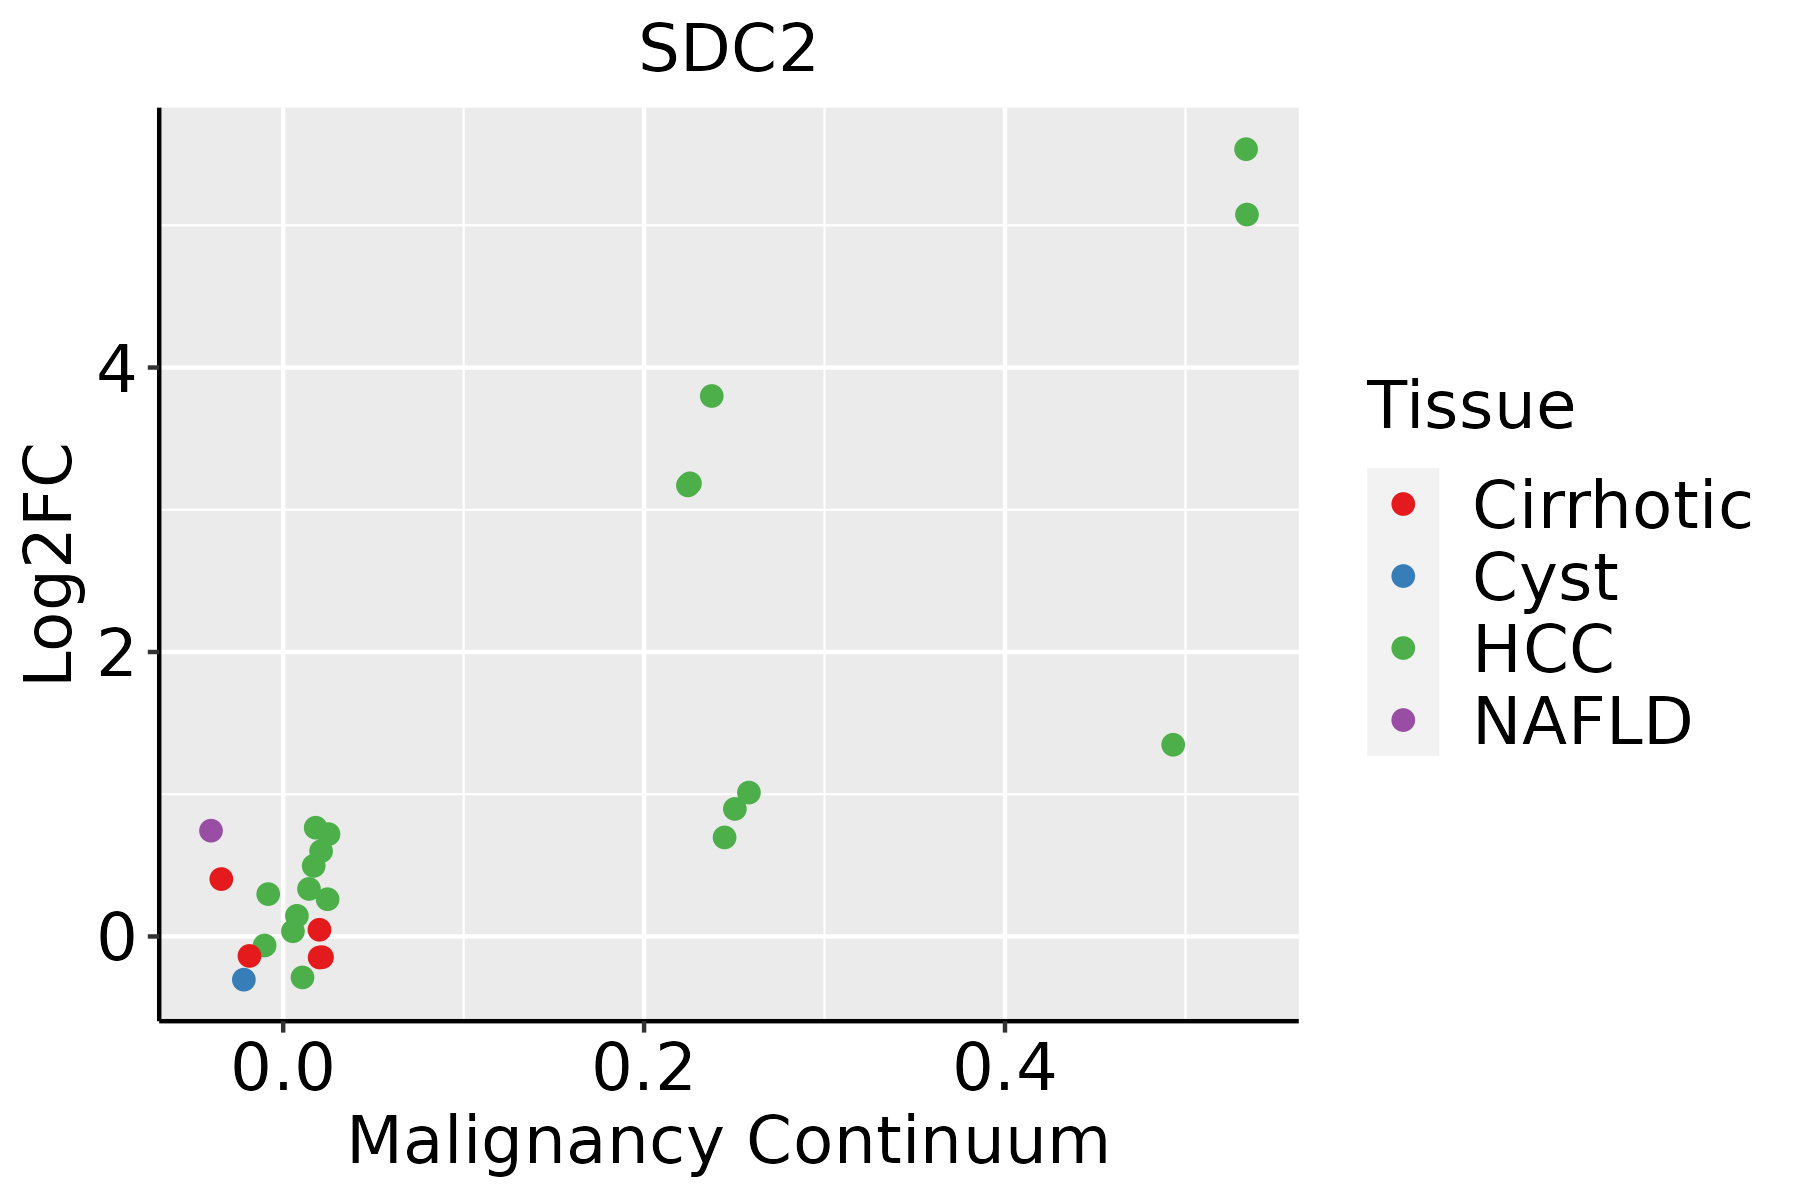 | HCC: Hepatocellular carcinoma |
| NAFLD: Non-alcoholic fatty liver disease | ||
| Oral Cavity | 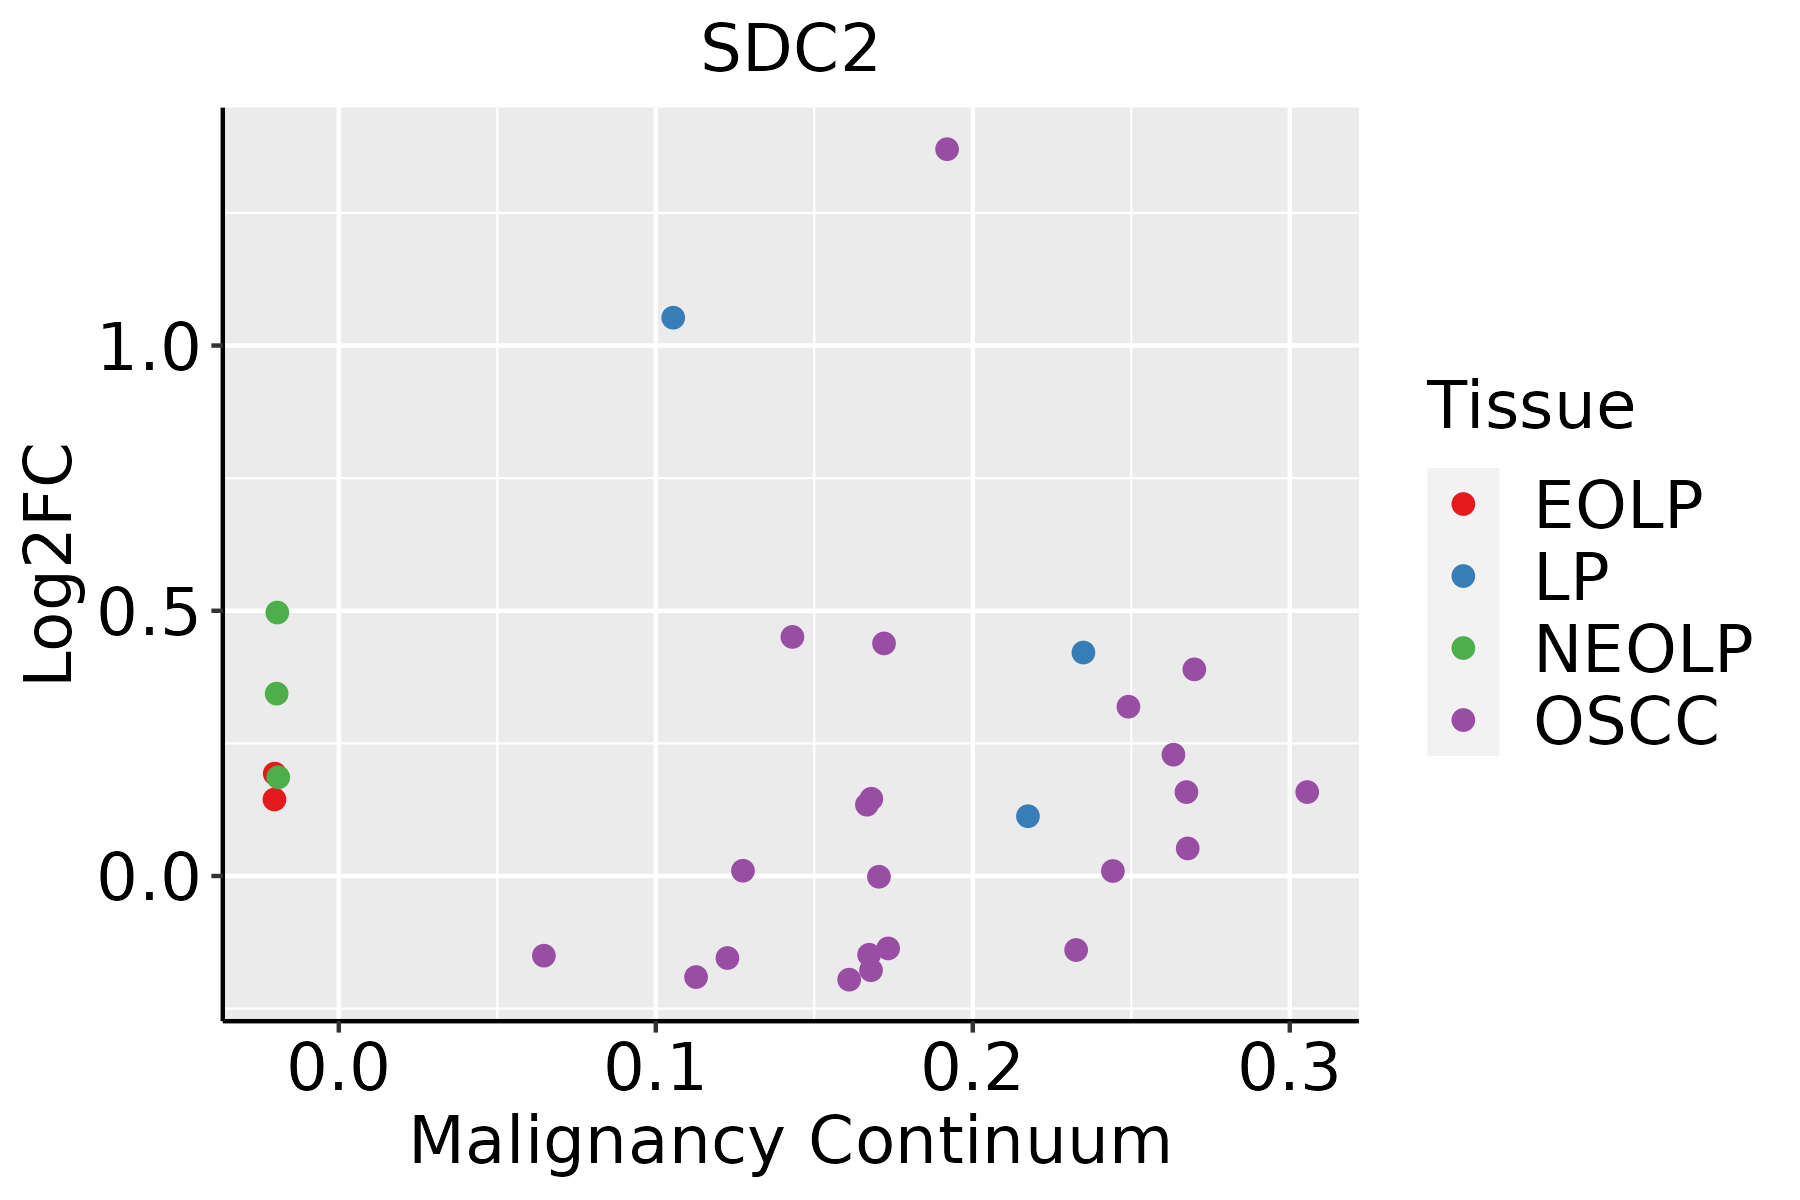 | EOLP: Erosive Oral lichen planus |
| LP: leukoplakia | ||
| NEOLP: Non-erosive oral lichen planus | ||
| OSCC: Oral squamous cell carcinoma | ||
| Prostate | 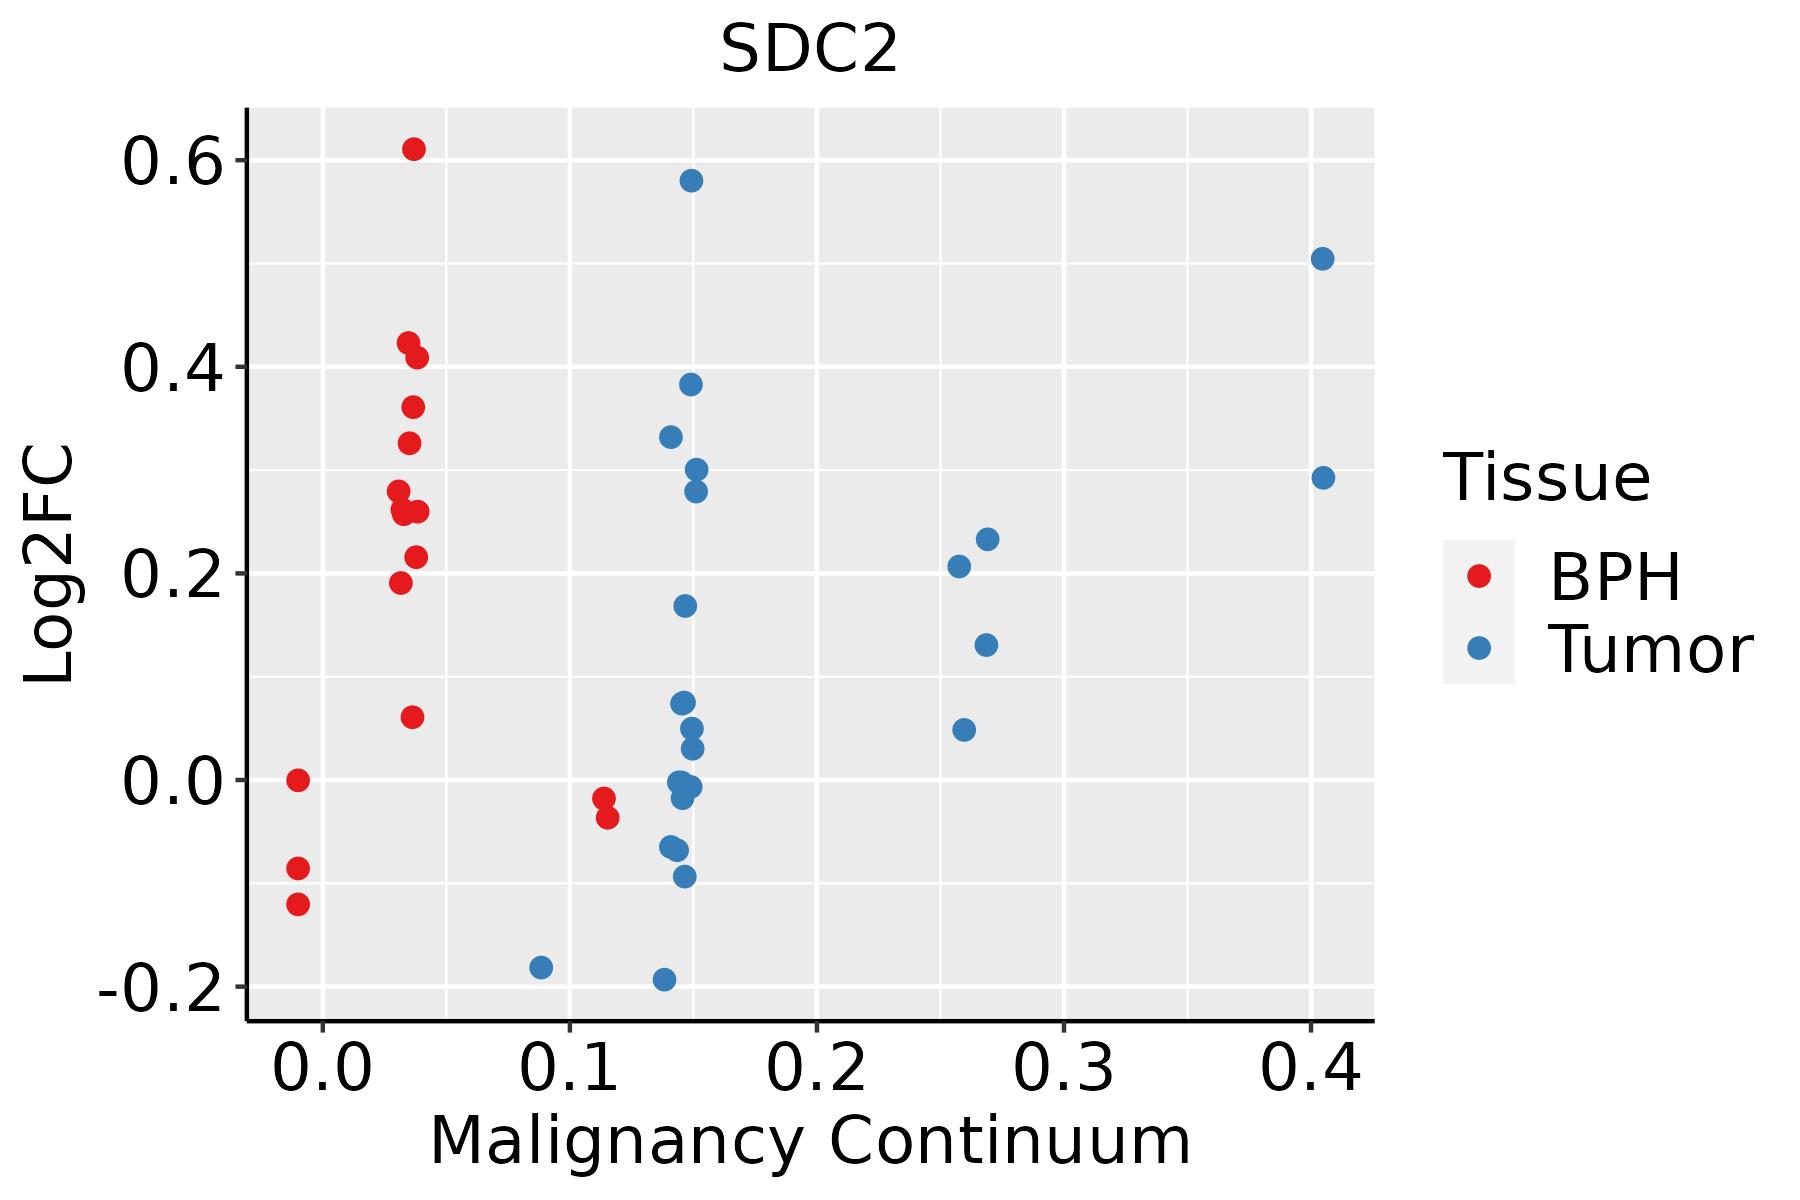 | BPH: Benign Prostatic Hyperplasia |
| Skin | 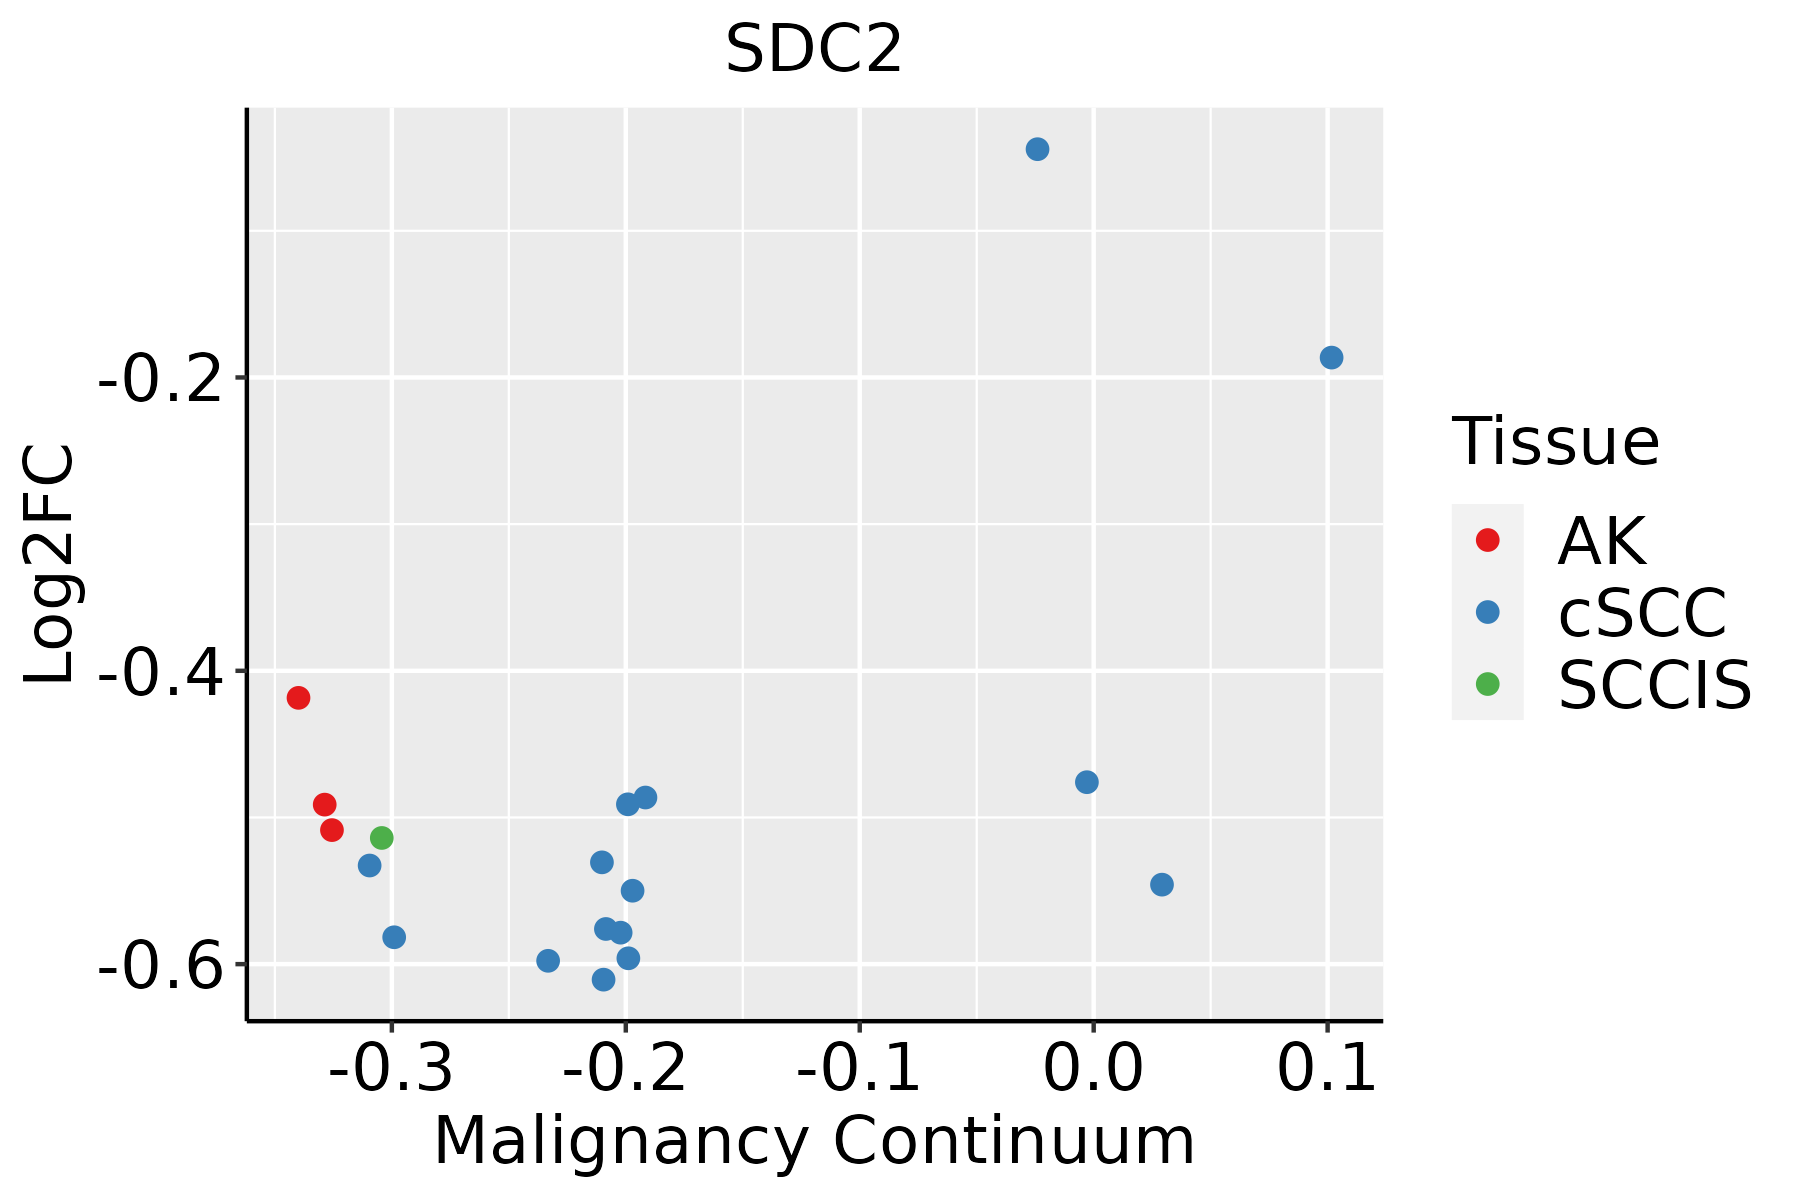 | AK: Actinic keratosis |
| cSCC: Cutaneous squamous cell carcinoma | ||
| SCCIS:squamous cell carcinoma in situ | ||
| Thyroid | 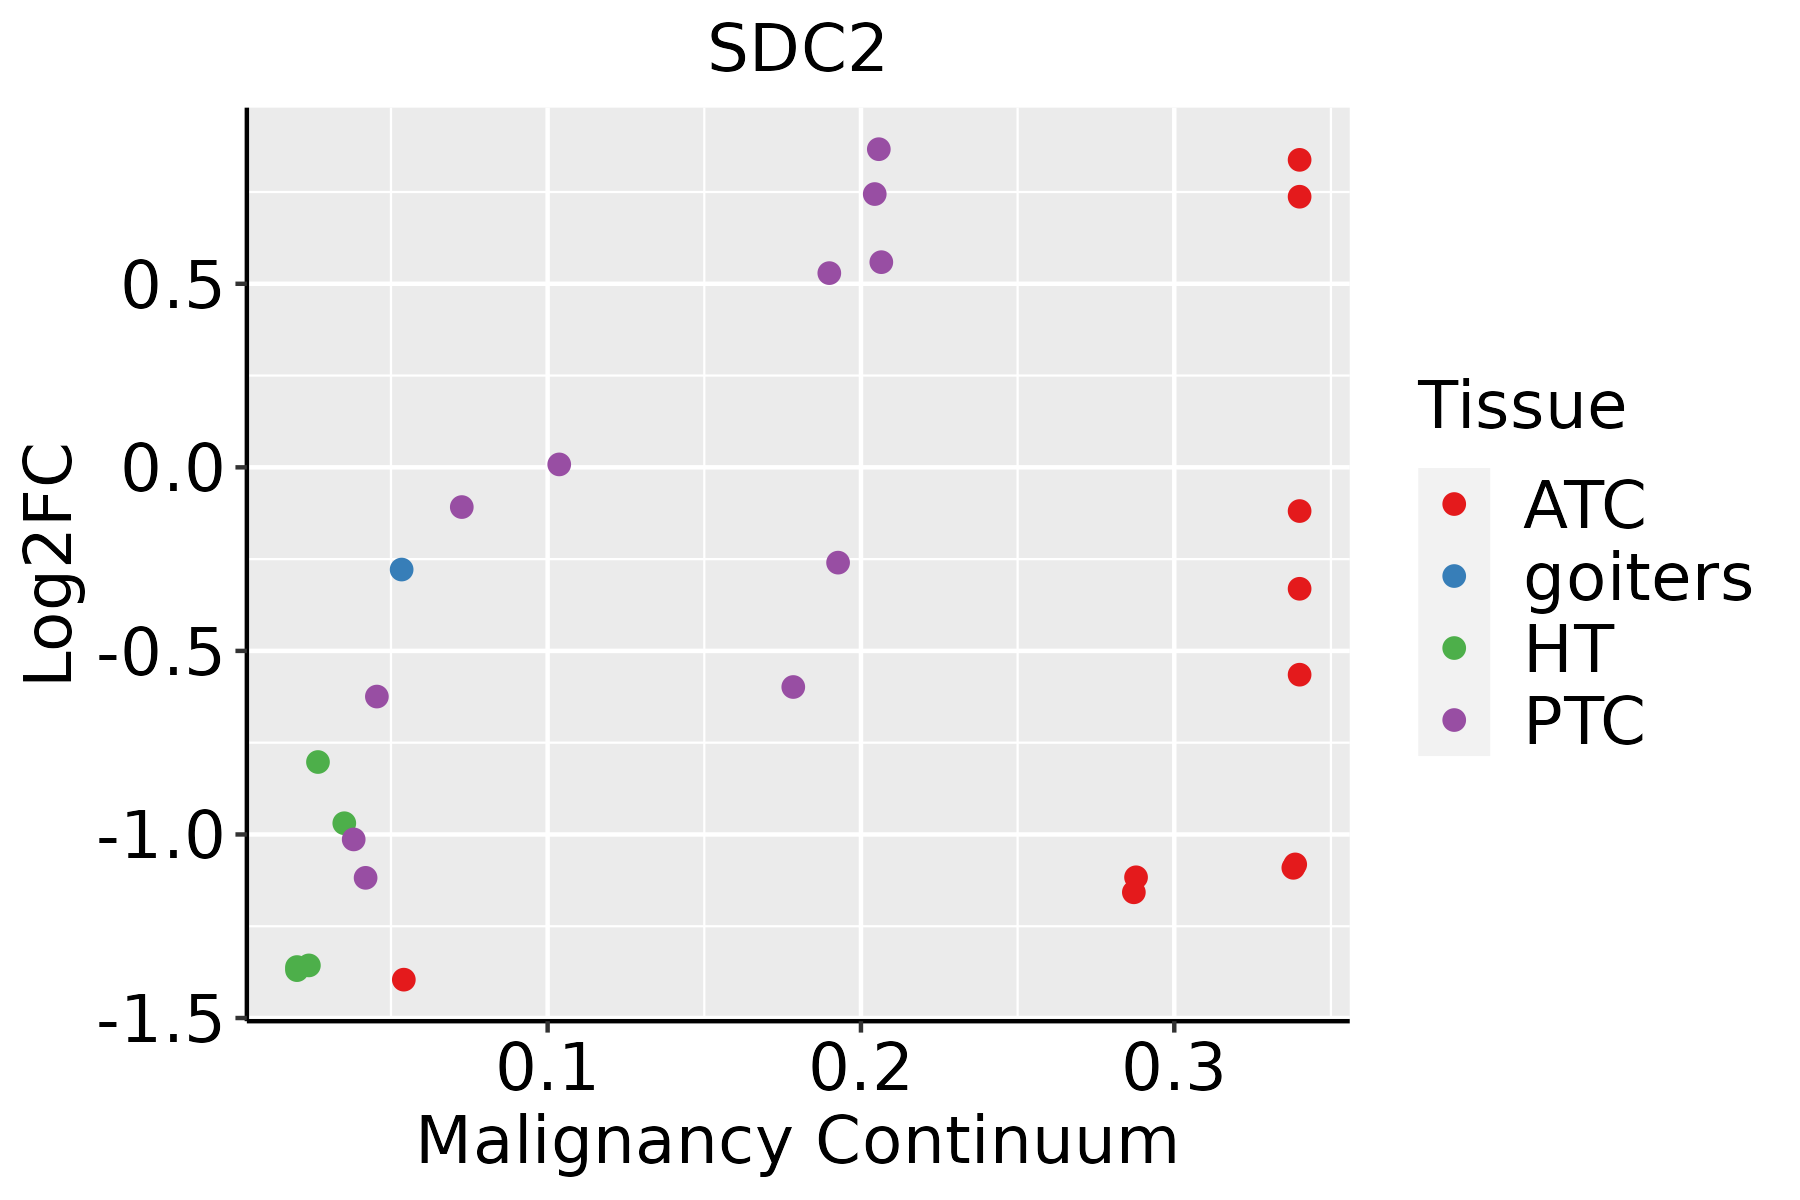 | ATC: Anaplastic thyroid cancer |
| HT: Hashimoto's thyroiditis | ||
| PTC: Papillary thyroid cancer |
| ∗log2FC in expression of this searched gene in stem-like cells from each diseased tissue sample relative to stem-like cells in normal samples in each tissue plotted against the malignancy continuum. Samples are colored based on if they are from different disease stage. |
Top |
Malignant transformation related pathway analysis |
| Find out the enriched GO biological processes and KEGG pathways involved in transition from healthy to precancer to cancer |
| Tissue | Disease Stage | Enriched GO biological Processes |
| Colorectum | AD |  |
| Colorectum | SER |  |
| Colorectum | MSS |  |
| Colorectum | MSI-H |  |
| Colorectum | FAP |  |
| ∗Top 15 enriched GO BP terms are showed in the bar plot of each disease state in each tissue. Each row represents a significant GO biological process which is colored according to the -log10(p.adjust). |
| Page: 1 2 3 4 5 6 7 8 9 |
| GO ID | Tissue | Disease Stage | Description | Gene Ratio | Bg Ratio | pvalue | p.adjust | Count |
| GO:00109758 | Endometrium | AEH | regulation of neuron projection development | 75/2100 | 445/18723 | 2.01e-04 | 2.54e-03 | 75 |
| GO:00163588 | Endometrium | AEH | dendrite development | 46/2100 | 243/18723 | 2.56e-04 | 3.03e-03 | 46 |
| GO:001097513 | Endometrium | EEC | regulation of neuron projection development | 79/2168 | 445/18723 | 6.80e-05 | 1.01e-03 | 79 |
| GO:001635813 | Endometrium | EEC | dendrite development | 44/2168 | 243/18723 | 1.72e-03 | 1.34e-02 | 44 |
| GO:001097516 | Esophagus | ESCC | regulation of neuron projection development | 240/8552 | 445/18723 | 2.48e-04 | 1.53e-03 | 240 |
| GO:001635816 | Esophagus | ESCC | dendrite development | 130/8552 | 243/18723 | 8.33e-03 | 2.95e-02 | 130 |
| GO:00163585 | Liver | NAFLD | dendrite development | 43/1882 | 243/18723 | 1.70e-04 | 3.07e-03 | 43 |
| GO:00488133 | Liver | NAFLD | dendrite morphogenesis | 29/1882 | 146/18723 | 2.63e-04 | 4.26e-03 | 29 |
| GO:00109755 | Liver | NAFLD | regulation of neuron projection development | 64/1882 | 445/18723 | 2.12e-03 | 2.08e-02 | 64 |
| GO:001097511 | Liver | HCC | regulation of neuron projection development | 220/7958 | 445/18723 | 1.68e-03 | 8.78e-03 | 220 |
| GO:001635811 | Liver | HCC | dendrite development | 121/7958 | 243/18723 | 1.26e-02 | 4.56e-02 | 121 |
| GO:001097510 | Oral cavity | OSCC | regulation of neuron projection development | 210/7305 | 445/18723 | 2.35e-04 | 1.52e-03 | 210 |
| GO:001635810 | Oral cavity | OSCC | dendrite development | 113/7305 | 243/18723 | 1.00e-02 | 3.49e-02 | 113 |
| GO:001635822 | Oral cavity | NEOLP | dendrite development | 55/2005 | 243/18723 | 5.38e-08 | 2.16e-06 | 55 |
| GO:004881313 | Oral cavity | NEOLP | dendrite morphogenesis | 34/2005 | 146/18723 | 9.34e-06 | 1.79e-04 | 34 |
| GO:001097521 | Oral cavity | NEOLP | regulation of neuron projection development | 77/2005 | 445/18723 | 1.44e-05 | 2.53e-04 | 77 |
| GO:00109759 | Prostate | BPH | regulation of neuron projection development | 118/3107 | 445/18723 | 5.85e-08 | 1.57e-06 | 118 |
| GO:00163589 | Prostate | BPH | dendrite development | 71/3107 | 243/18723 | 5.73e-07 | 1.14e-05 | 71 |
| GO:00488136 | Prostate | BPH | dendrite morphogenesis | 45/3107 | 146/18723 | 1.46e-05 | 1.88e-04 | 45 |
| GO:0048814 | Prostate | BPH | regulation of dendrite morphogenesis | 20/3107 | 67/18723 | 4.93e-03 | 2.33e-02 | 20 |
| Page: 1 2 3 |
| Pathway ID | Tissue | Disease Stage | Description | Gene Ratio | Bg Ratio | pvalue | p.adjust | qvalue | Count |
| hsa0541824 | Breast | IDC | Fluid shear stress and atherosclerosis | 34/867 | 139/8465 | 9.41e-07 | 1.61e-05 | 1.20e-05 | 34 |
| hsa0520523 | Breast | IDC | Proteoglycans in cancer | 42/867 | 205/8465 | 7.69e-06 | 9.99e-05 | 7.48e-05 | 42 |
| hsa0541834 | Breast | IDC | Fluid shear stress and atherosclerosis | 34/867 | 139/8465 | 9.41e-07 | 1.61e-05 | 1.20e-05 | 34 |
| hsa0520533 | Breast | IDC | Proteoglycans in cancer | 42/867 | 205/8465 | 7.69e-06 | 9.99e-05 | 7.48e-05 | 42 |
| hsa0541826 | Endometrium | AEH | Fluid shear stress and atherosclerosis | 43/1197 | 139/8465 | 2.47e-07 | 3.49e-06 | 2.55e-06 | 43 |
| hsa0520518 | Endometrium | AEH | Proteoglycans in cancer | 53/1197 | 205/8465 | 5.43e-06 | 6.53e-05 | 4.78e-05 | 53 |
| hsa05418112 | Endometrium | AEH | Fluid shear stress and atherosclerosis | 43/1197 | 139/8465 | 2.47e-07 | 3.49e-06 | 2.55e-06 | 43 |
| hsa0520519 | Endometrium | AEH | Proteoglycans in cancer | 53/1197 | 205/8465 | 5.43e-06 | 6.53e-05 | 4.78e-05 | 53 |
| hsa0541827 | Endometrium | EEC | Fluid shear stress and atherosclerosis | 45/1237 | 139/8465 | 7.76e-08 | 1.22e-06 | 9.07e-07 | 45 |
| hsa0520524 | Endometrium | EEC | Proteoglycans in cancer | 52/1237 | 205/8465 | 3.01e-05 | 3.19e-04 | 2.38e-04 | 52 |
| hsa0541836 | Endometrium | EEC | Fluid shear stress and atherosclerosis | 45/1237 | 139/8465 | 7.76e-08 | 1.22e-06 | 9.07e-07 | 45 |
| hsa0520534 | Endometrium | EEC | Proteoglycans in cancer | 52/1237 | 205/8465 | 3.01e-05 | 3.19e-04 | 2.38e-04 | 52 |
| hsa05418211 | Esophagus | ESCC | Fluid shear stress and atherosclerosis | 109/4205 | 139/8465 | 2.00e-12 | 3.72e-11 | 1.90e-11 | 109 |
| hsa0520529 | Esophagus | ESCC | Proteoglycans in cancer | 138/4205 | 205/8465 | 1.79e-07 | 1.40e-06 | 7.15e-07 | 138 |
| hsa05418310 | Esophagus | ESCC | Fluid shear stress and atherosclerosis | 109/4205 | 139/8465 | 2.00e-12 | 3.72e-11 | 1.90e-11 | 109 |
| hsa0520537 | Esophagus | ESCC | Proteoglycans in cancer | 138/4205 | 205/8465 | 1.79e-07 | 1.40e-06 | 7.15e-07 | 138 |
| hsa0541814 | Liver | NAFLD | Fluid shear stress and atherosclerosis | 30/1043 | 139/8465 | 1.37e-03 | 1.71e-02 | 1.38e-02 | 30 |
| hsa0541815 | Liver | NAFLD | Fluid shear stress and atherosclerosis | 30/1043 | 139/8465 | 1.37e-03 | 1.71e-02 | 1.38e-02 | 30 |
| hsa0541822 | Liver | Cirrhotic | Fluid shear stress and atherosclerosis | 62/2530 | 139/8465 | 1.53e-04 | 1.06e-03 | 6.54e-04 | 62 |
| hsa0520510 | Liver | Cirrhotic | Proteoglycans in cancer | 85/2530 | 205/8465 | 2.37e-04 | 1.58e-03 | 9.75e-04 | 85 |
| Page: 1 2 |
Top |
Cell-cell communication analysis |
| Identification of potential cell-cell interactions between two cell types and their ligand-receptor pairs for different disease states |
| Ligand | Receptor | LRpair | Pathway | Tissue | Disease Stage |
| ANGPTL4 | SDC2 | ANGPTL4_SDC2 | ANGPTL | Breast | ADJ |
| MDK | SDC2 | MDK_SDC2 | MK | Breast | ADJ |
| MDK | SDC2 | MDK_SDC2 | MK | Breast | DCIS |
| PTN | SDC2 | PTN_SDC2 | PTN | Breast | DCIS |
| ANGPTL4 | SDC2 | ANGPTL4_SDC2 | ANGPTL | Breast | DCIS |
| MDK | SDC2 | MDK_SDC2 | MK | Breast | Healthy |
| ANGPTL4 | SDC2 | ANGPTL4_SDC2 | ANGPTL | Breast | Healthy |
| PTN | SDC2 | PTN_SDC2 | PTN | Breast | Healthy |
| MDK | SDC2 | MDK_SDC2 | MK | Breast | IDC |
| ANGPTL4 | SDC2 | ANGPTL4_SDC2 | ANGPTL | Breast | IDC |
| ANGPTL4 | SDC2 | ANGPTL4_SDC2 | ANGPTL | Breast | Precancer |
| MDK | SDC2 | MDK_SDC2 | MK | Breast | Precancer |
| MDK | SDC2 | MDK_SDC2 | MK | Cervix | ADJ |
| PTN | SDC2 | PTN_SDC2 | PTN | Cervix | ADJ |
| MDK | SDC2 | MDK_SDC2 | MK | Cervix | CC |
| PTN | SDC2 | PTN_SDC2 | PTN | Cervix | CC |
| ANGPTL4 | SDC2 | ANGPTL4_SDC2 | ANGPTL | Cervix | CC |
| MDK | SDC2 | MDK_SDC2 | MK | Cervix | Healthy |
| MDK | SDC2 | MDK_SDC2 | MK | Cervix | Precancer |
| PTN | SDC2 | PTN_SDC2 | PTN | Cervix | Precancer |
| Page: 1 |
Top |
Single-cell gene regulatory network inference analysis |
| Find out the significant the regulons (TFs) and the target genes of each regulon across cell types for different disease states |
| TF | Cell Type | Tissue | Disease Stage | Target Gene | RSS | Regulon Activity |
| ∗The dot plots of a searched regulon are shown for all cell subpopulations in each disease state of each tissue based on the regulon specific score inferred using pySCENIC and by calculating the average expression. |
| Page: 1 |
Top |
Somatic mutation of malignant transformation related genes |
| Annotation of somatic variants for genes involved in malignant transformation |
| Hugo Symbol | Variant Class | Variant Classification | dbSNP RS | HGVSc | HGVSp | HGVSp Short | SWISSPROT | BIOTYPE | SIFT | PolyPhen | Tumor Sample Barcode | Tissue | Histology | Sex | Age | Stage | Therapy Types | Drugs | Outcome |
| SDC2 | SNV | Missense_Mutation | rs200028820 | c.373N>A | p.Glu125Lys | p.E125K | P34741 | protein_coding | tolerated(0.83) | benign(0.207) | TCGA-D8-A1XZ-01 | Breast | breast invasive carcinoma | Female | >=65 | III/IV | Hormone Therapy | tamoxiphen+anastrozolum | SD |
| SDC2 | SNV | Missense_Mutation | c.144C>A | p.Asp48Glu | p.D48E | P34741 | protein_coding | tolerated(0.07) | probably_damaging(0.999) | TCGA-E9-A1R7-01 | Breast | breast invasive carcinoma | Female | <65 | I/II | Hormone Therapy | fareston | SD | |
| SDC2 | insertion | Frame_Shift_Ins | novel | c.583_584insATTTCATATT | p.Pro195HisfsTer6 | p.P195Hfs*6 | P34741 | protein_coding | TCGA-AR-A0U0-01 | Breast | breast invasive carcinoma | Female | >=65 | I/II | Unknown | Unknown | SD | ||
| SDC2 | SNV | Missense_Mutation | rs200028820 | c.373N>A | p.Glu125Lys | p.E125K | P34741 | protein_coding | tolerated(0.83) | benign(0.207) | TCGA-AZ-4315-01 | Colorectum | colon adenocarcinoma | Male | <65 | I/II | Unknown | Unknown | SD |
| SDC2 | SNV | Missense_Mutation | c.593A>G | p.Glu198Gly | p.E198G | P34741 | protein_coding | deleterious(0) | probably_damaging(0.998) | TCGA-AZ-5403-01 | Colorectum | colon adenocarcinoma | Male | <65 | I/II | Unknown | Unknown | PD | |
| SDC2 | SNV | Missense_Mutation | novel | c.26N>G | p.Thr9Ser | p.T9S | P34741 | protein_coding | tolerated(0.32) | benign(0.001) | TCGA-CA-6717-01 | Colorectum | colon adenocarcinoma | Male | <65 | I/II | Chemotherapy | oxaliplatin | CR |
| SDC2 | SNV | Missense_Mutation | rs774751152 | c.509N>A | p.Arg170His | p.R170H | P34741 | protein_coding | deleterious(0) | probably_damaging(0.999) | TCGA-D5-6928-01 | Colorectum | colon adenocarcinoma | Male | >=65 | I/II | Unknown | Unknown | SD |
| SDC2 | SNV | Missense_Mutation | c.479N>A | p.Ala160Glu | p.A160E | P34741 | protein_coding | deleterious(0) | probably_damaging(0.999) | TCGA-AF-2690-01 | Colorectum | rectum adenocarcinoma | Female | >=65 | III/IV | Unknown | Unknown | SD | |
| SDC2 | SNV | Missense_Mutation | novel | c.472N>A | p.Leu158Ile | p.L158I | P34741 | protein_coding | deleterious(0) | probably_damaging(0.978) | TCGA-AG-A002-01 | Colorectum | rectum adenocarcinoma | Male | <65 | I/II | Unknown | Unknown | SD |
| SDC2 | SNV | Missense_Mutation | rs774751152 | c.509N>A | p.Arg170His | p.R170H | P34741 | protein_coding | deleterious(0) | probably_damaging(0.999) | TCGA-EI-6514-01 | Colorectum | rectum adenocarcinoma | Female | <65 | I/II | Chemotherapy | 5-fu | SD |
| Page: 1 2 3 |
Top |
Related drugs of malignant transformation related genes |
| Identification of chemicals and drugs interact with genes involved in malignant transfromation |
| (DGIdb 4.0) |
| Entrez ID | Symbol | Category | Interaction Types | Drug Claim Name | Drug Name | PMIDs |
| 6383 | SDC2 | CELL SURFACE, DRUGGABLE GENOME | HEPARAN SULFATE | 8642635 |
| Page: 1 |

Copyright 2023-Present -The University of Texas Health Science Center at Houston |