
|
|||||
|
 | |
| |
| |
| |
| |
| |
|
Gene: SDC1 |
Gene summary for SDC1 |
| Gene information | Species | Human | Gene symbol | SDC1 | Gene ID | 6382 |
| Gene name | syndecan 1 | |
| Gene Alias | CD138 | |
| Cytomap | 2p24.1 | |
| Gene Type | protein-coding | GO ID | GO:0000003 | UniProtAcc | P18827 |
Top |
Malignant transformation analysis |
| Identification of the aberrant gene expression in precancerous and cancerous lesions by comparing the gene expression of stem-like cells in diseased tissues with normal stem cells |
| Entrez ID | Symbol | Replicates | Species | Organ | Tissue | Adj P-value | Log2FC | Malignancy |
| 6382 | SDC1 | GSM4909281 | Human | Breast | IDC | 4.25e-12 | 4.54e-01 | 0.21 |
| 6382 | SDC1 | GSM4909282 | Human | Breast | IDC | 2.37e-02 | 3.09e-01 | -0.0288 |
| 6382 | SDC1 | GSM4909285 | Human | Breast | IDC | 3.23e-29 | 6.20e-01 | 0.21 |
| 6382 | SDC1 | GSM4909289 | Human | Breast | IDC | 6.00e-08 | 6.62e-01 | 0.1064 |
| 6382 | SDC1 | GSM4909290 | Human | Breast | IDC | 2.79e-11 | 3.70e-01 | 0.2096 |
| 6382 | SDC1 | GSM4909291 | Human | Breast | IDC | 6.71e-18 | 5.57e-01 | 0.1753 |
| 6382 | SDC1 | GSM4909296 | Human | Breast | IDC | 2.00e-02 | 2.84e-01 | 0.1524 |
| 6382 | SDC1 | GSM4909297 | Human | Breast | IDC | 8.87e-03 | 1.72e-01 | 0.1517 |
| 6382 | SDC1 | GSM4909302 | Human | Breast | IDC | 1.41e-12 | 4.25e-01 | 0.1545 |
| 6382 | SDC1 | GSM4909304 | Human | Breast | IDC | 2.63e-06 | 3.75e-01 | 0.1636 |
| 6382 | SDC1 | GSM4909305 | Human | Breast | IDC | 2.59e-04 | 2.69e-01 | 0.0436 |
| 6382 | SDC1 | GSM4909311 | Human | Breast | IDC | 1.40e-02 | 3.21e-03 | 0.1534 |
| 6382 | SDC1 | GSM4909313 | Human | Breast | IDC | 9.09e-03 | 2.45e-01 | 0.0391 |
| 6382 | SDC1 | GSM4909317 | Human | Breast | IDC | 6.63e-35 | 7.95e-01 | 0.1355 |
| 6382 | SDC1 | GSM4909319 | Human | Breast | IDC | 6.66e-06 | -5.13e-02 | 0.1563 |
| 6382 | SDC1 | brca2 | Human | Breast | Precancer | 3.80e-08 | 3.21e-01 | -0.024 |
| 6382 | SDC1 | M2 | Human | Breast | IDC | 1.40e-06 | 5.66e-01 | 0.21 |
| 6382 | SDC1 | DCIS2 | Human | Breast | DCIS | 2.09e-50 | 4.40e-01 | 0.0085 |
| 6382 | SDC1 | CA_HPV_1 | Human | Cervix | CC | 8.81e-06 | -2.40e-01 | 0.0264 |
| 6382 | SDC1 | CA_HPV_3 | Human | Cervix | CC | 3.11e-06 | 1.79e-01 | 0.0414 |
| Page: 1 2 3 4 5 6 7 8 9 10 11 |
| Tissue | Expression Dynamics | Abbreviation |
| Breast |  | IDC: Invasive ductal carcinoma |
| DCIS: Ductal carcinoma in situ | ||
| Precancer(BRCA1-mut): Precancerous lesion from BRCA1 mutation carriers | ||
| Cervix | 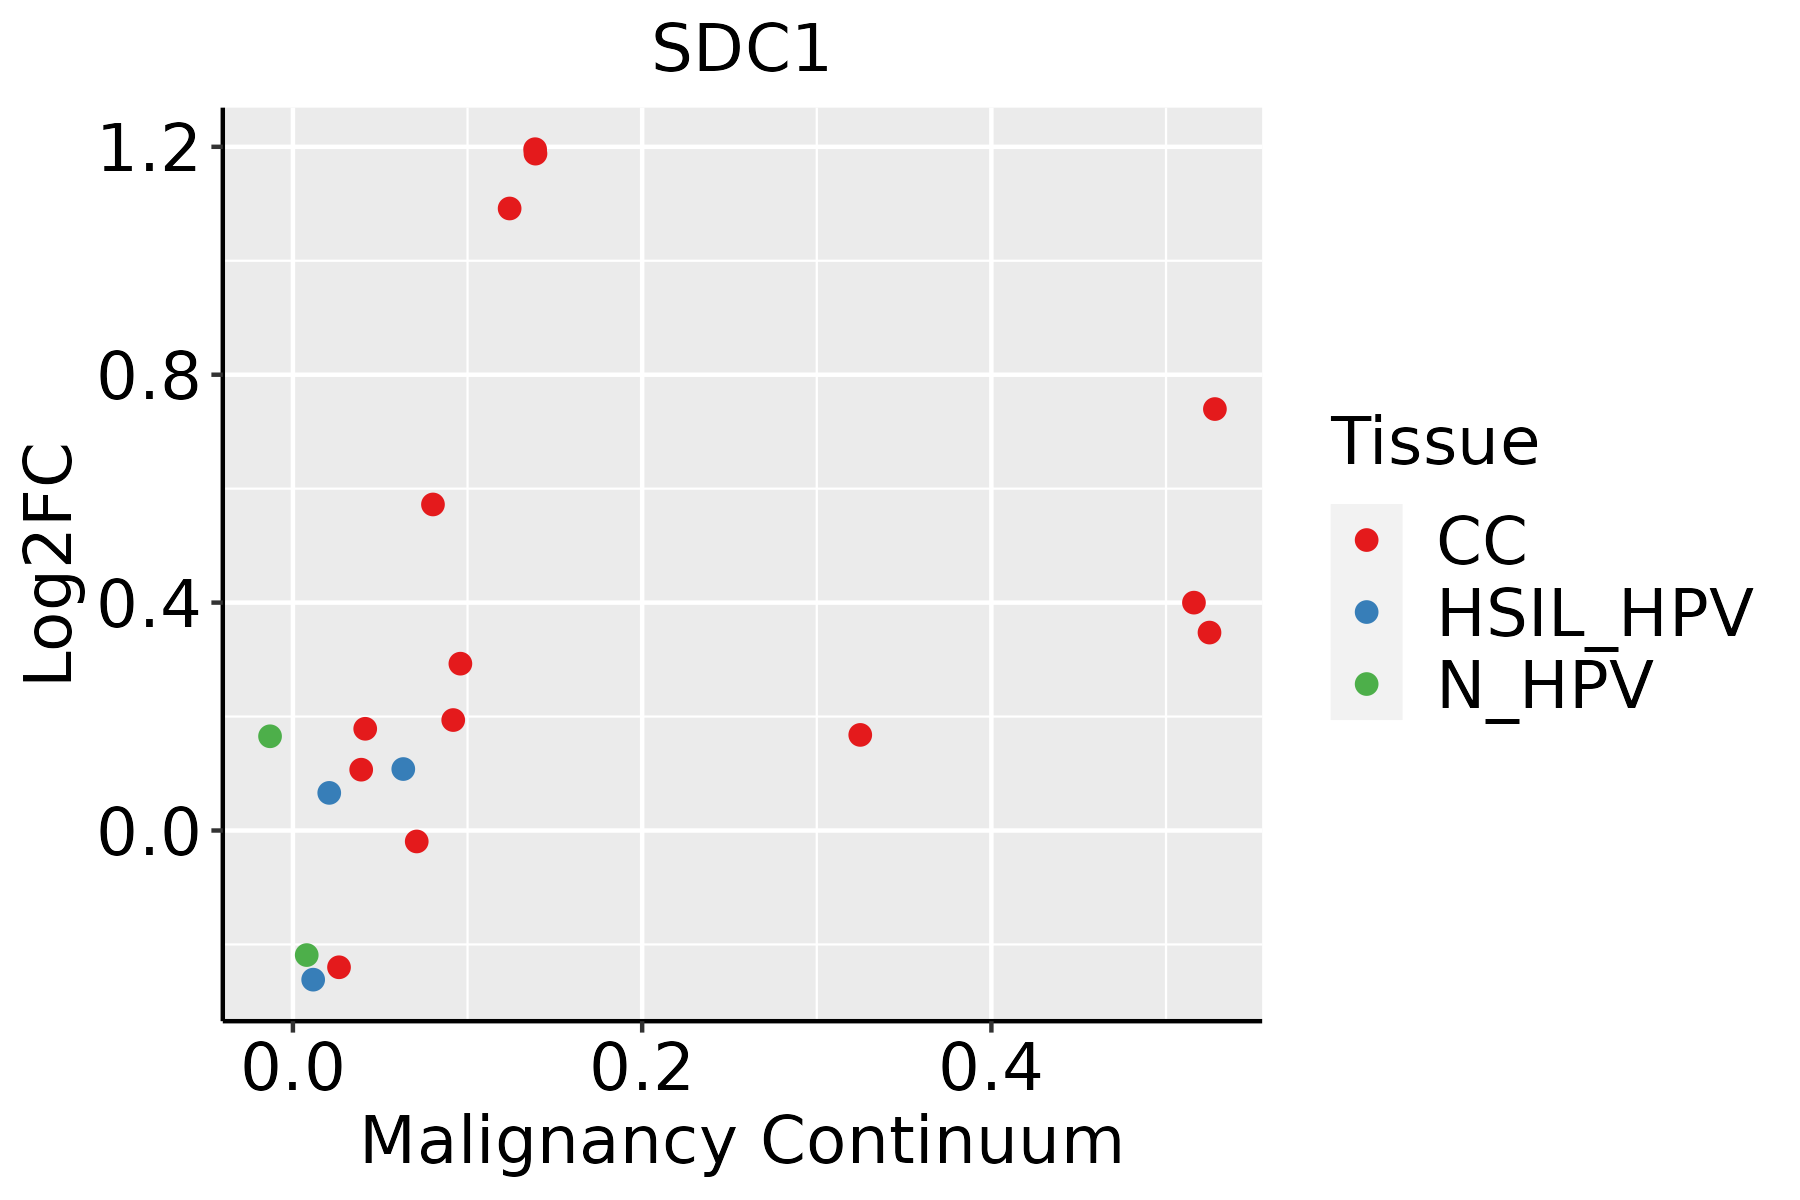 | CC: Cervix cancer |
| HSIL_HPV: HPV-infected high-grade squamous intraepithelial lesions | ||
| N_HPV: HPV-infected normal cervix | ||
| Colorectum (GSE201348) |  | FAP: Familial adenomatous polyposis |
| CRC: Colorectal cancer | ||
| Colorectum (HTA11) |  | AD: Adenomas |
| SER: Sessile serrated lesions | ||
| MSI-H: Microsatellite-high colorectal cancer | ||
| MSS: Microsatellite stable colorectal cancer | ||
| Esophagus | 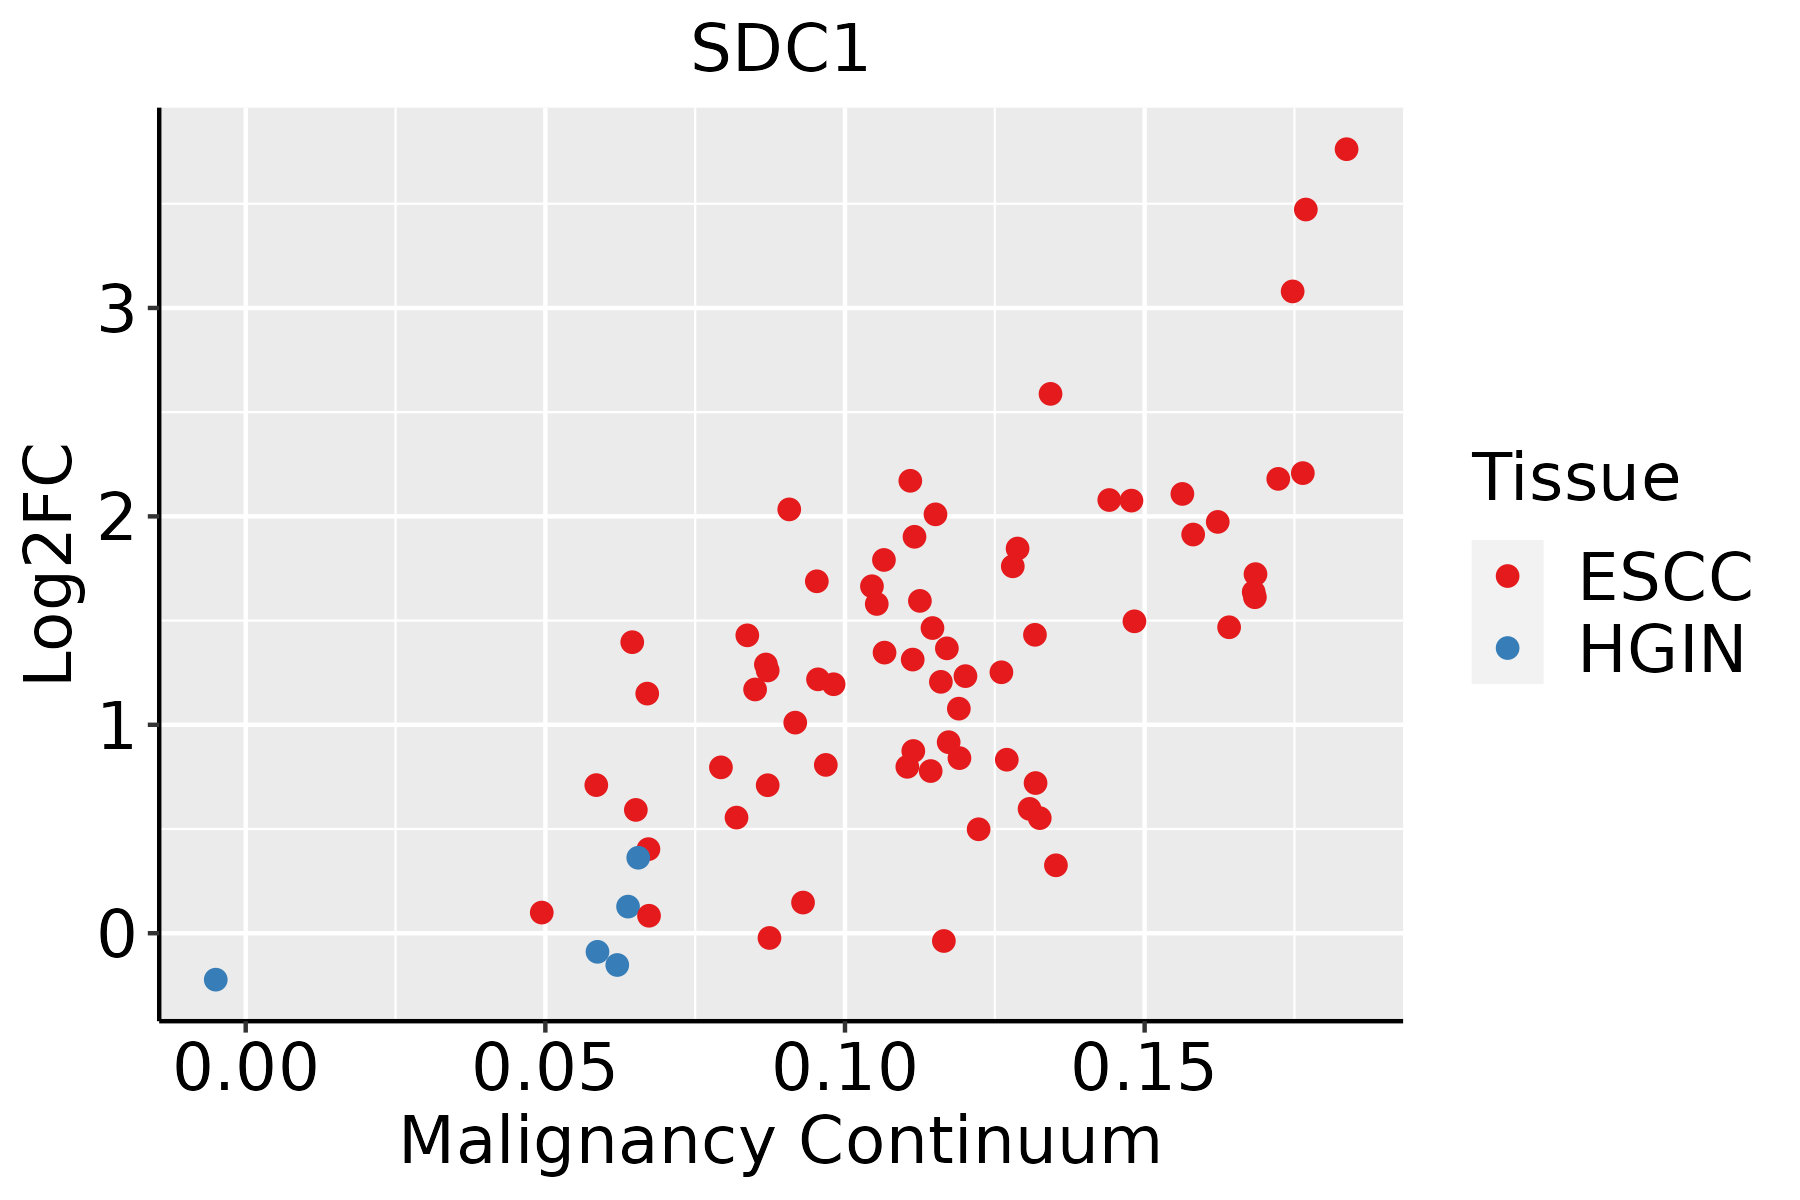 | ESCC: Esophageal squamous cell carcinoma |
| HGIN: High-grade intraepithelial neoplasias | ||
| LGIN: Low-grade intraepithelial neoplasias | ||
| Liver |  | HCC: Hepatocellular carcinoma |
| NAFLD: Non-alcoholic fatty liver disease | ||
| Oral Cavity | 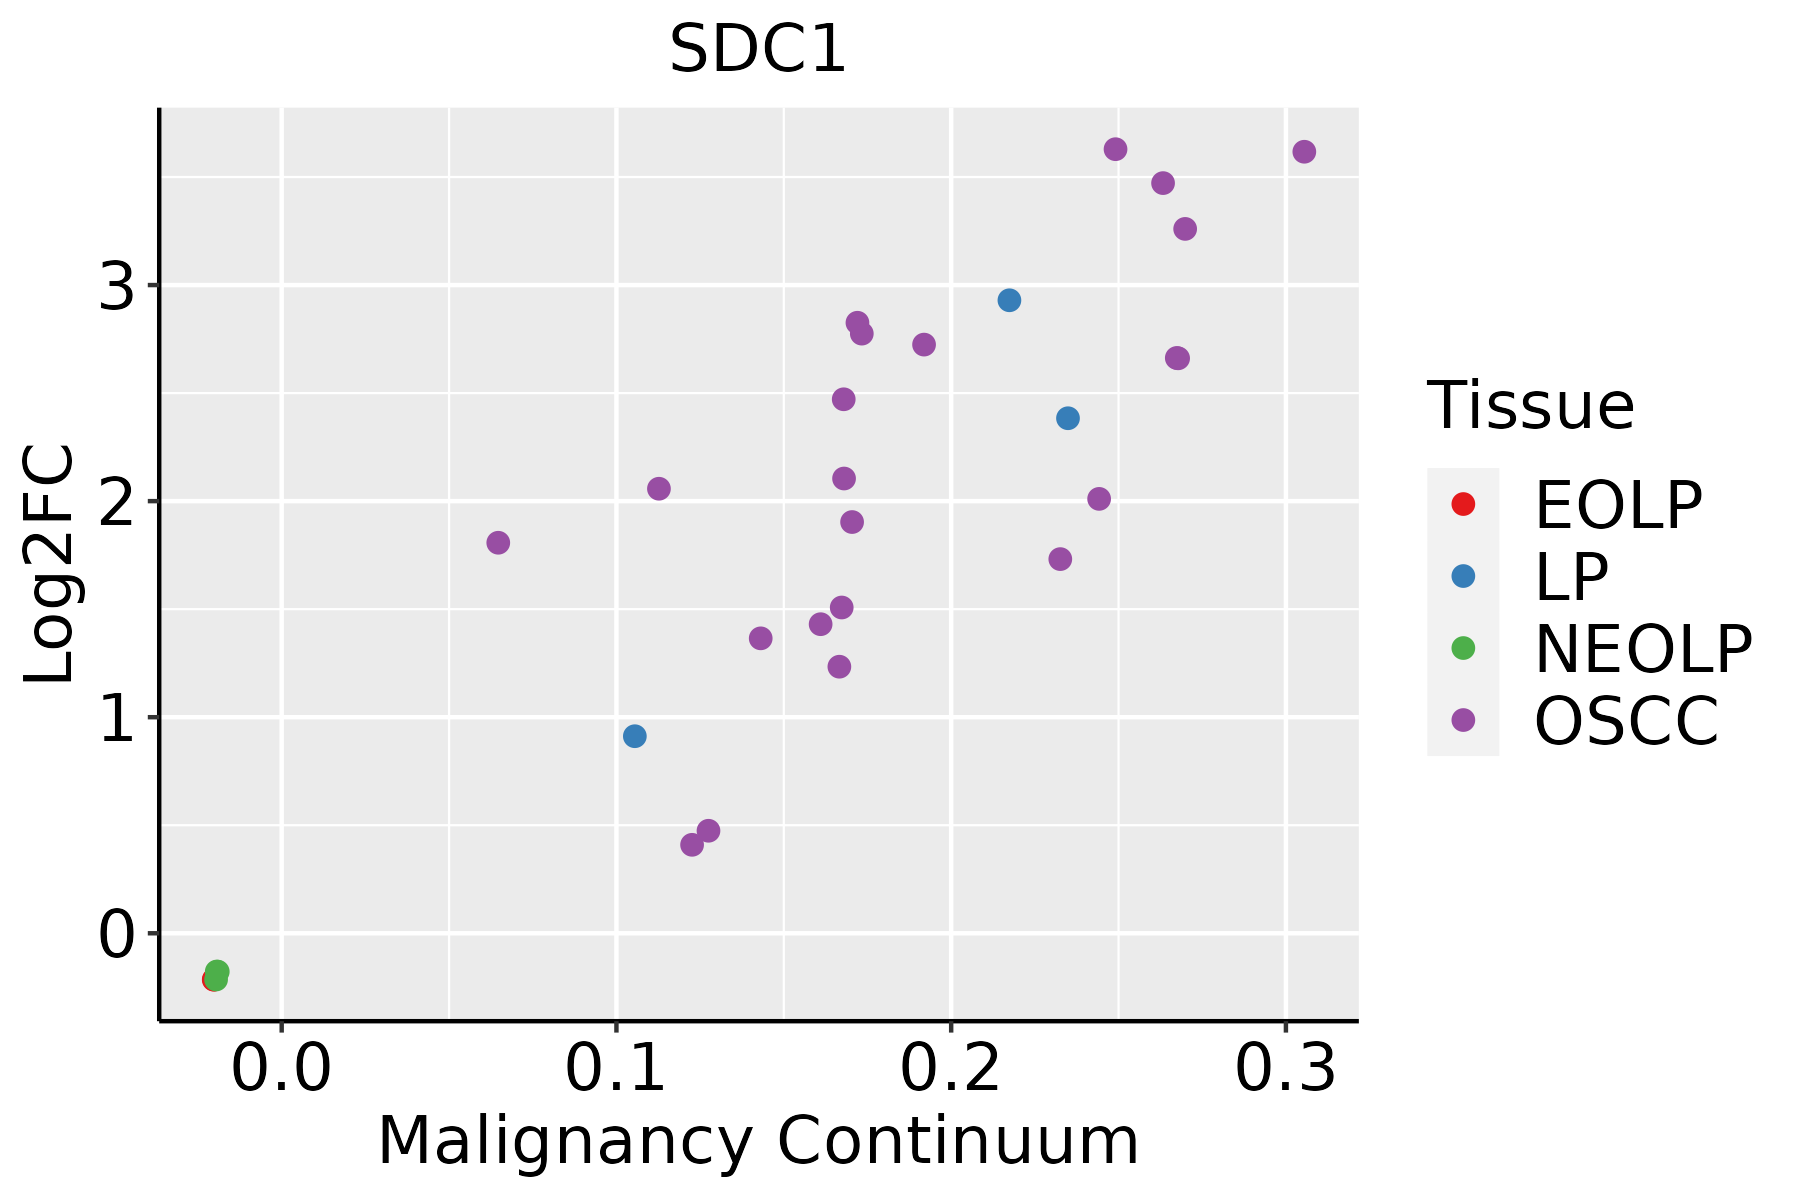 | EOLP: Erosive Oral lichen planus |
| LP: leukoplakia | ||
| NEOLP: Non-erosive oral lichen planus | ||
| OSCC: Oral squamous cell carcinoma | ||
| Prostate | 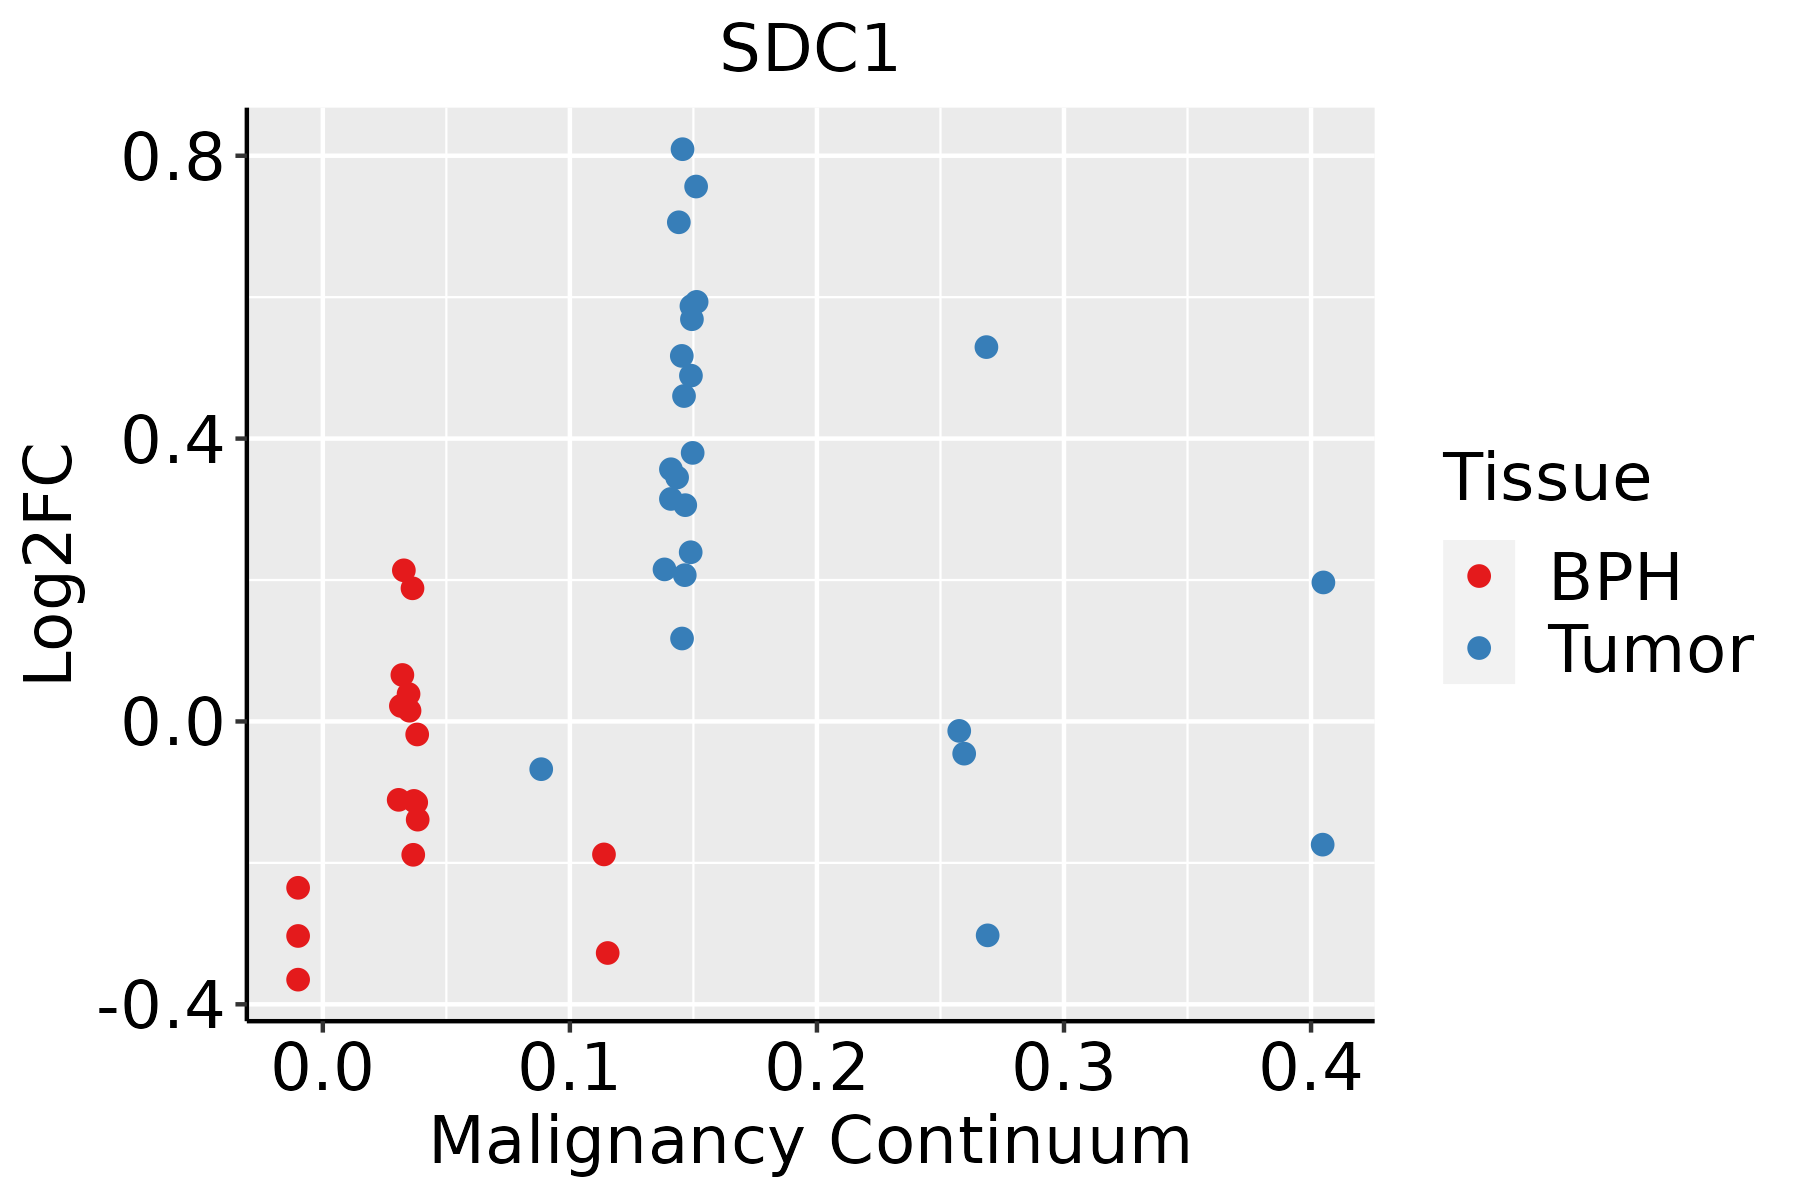 | BPH: Benign Prostatic Hyperplasia |
| Skin |  | AK: Actinic keratosis |
| cSCC: Cutaneous squamous cell carcinoma | ||
| SCCIS:squamous cell carcinoma in situ | ||
| Thyroid | 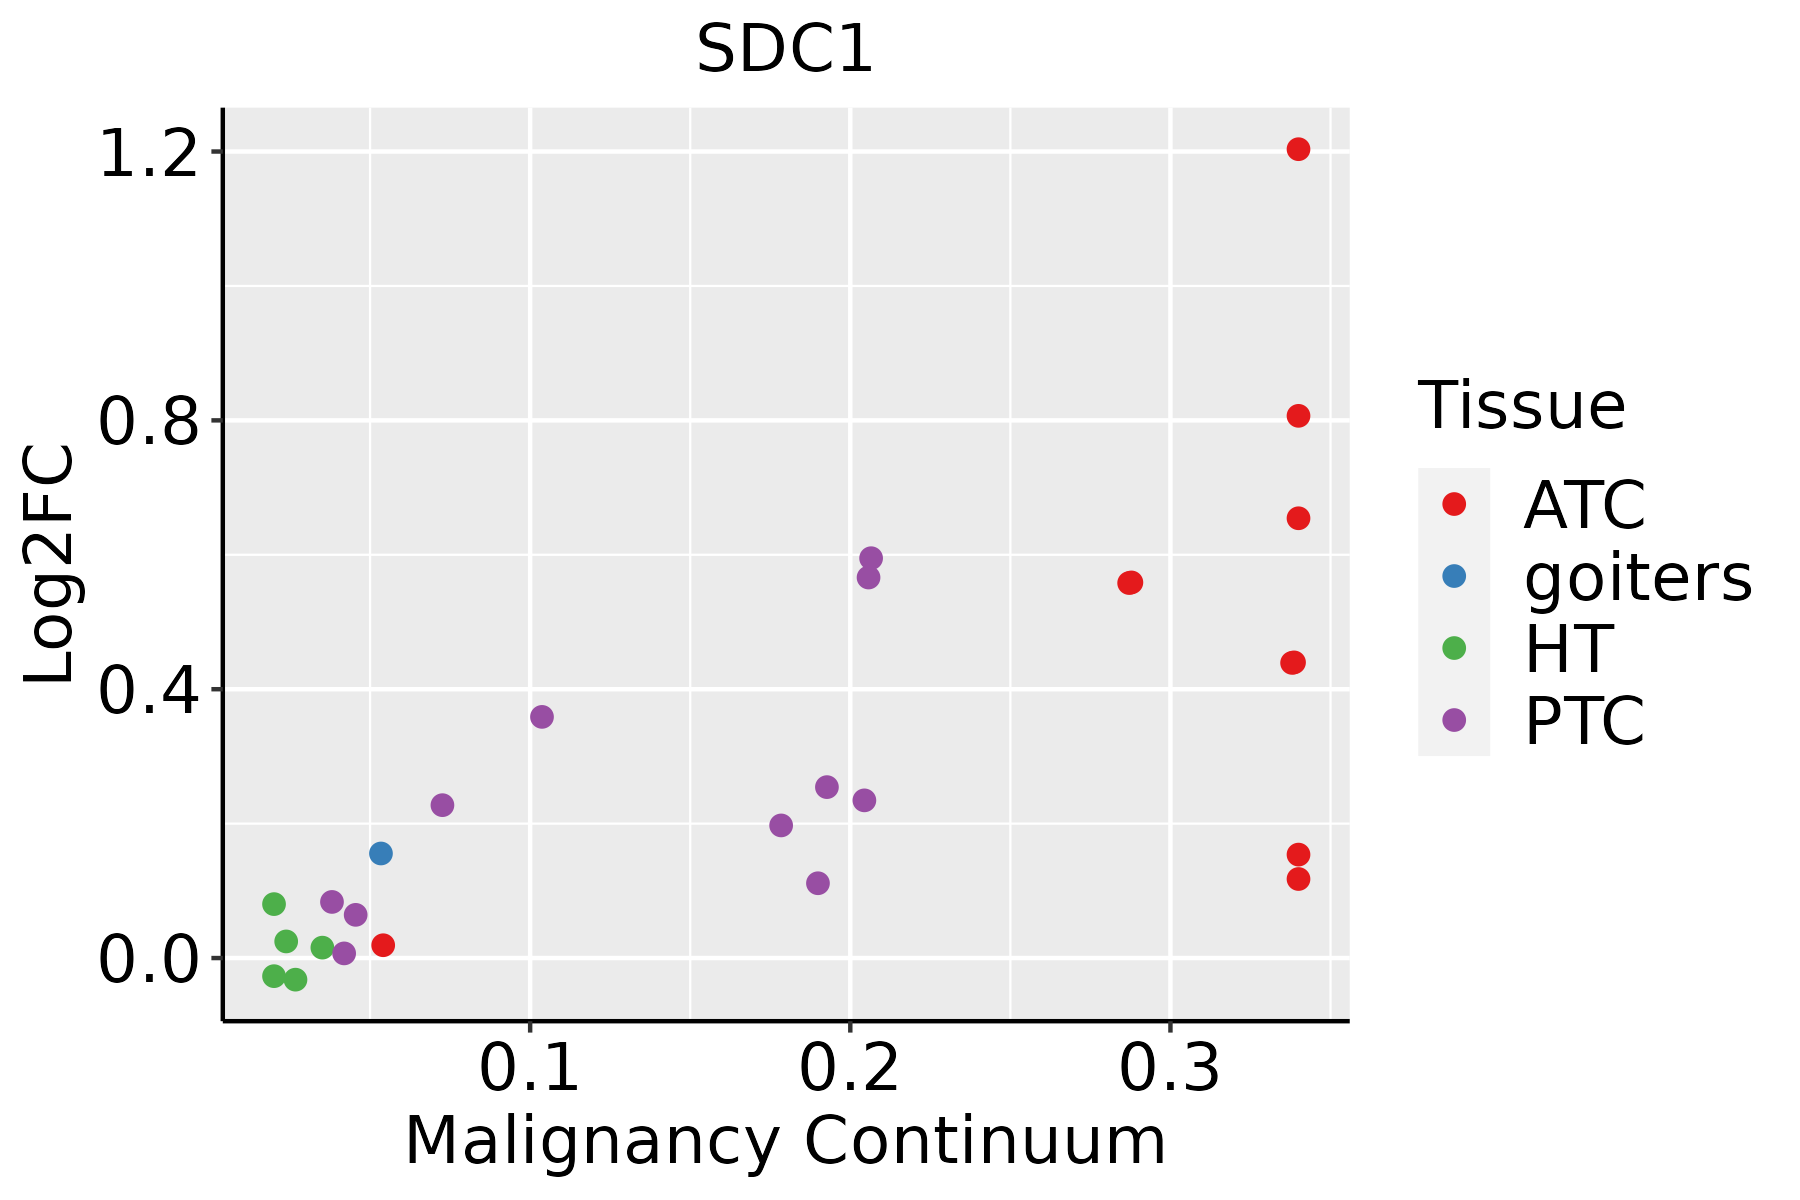 | ATC: Anaplastic thyroid cancer |
| HT: Hashimoto's thyroiditis | ||
| PTC: Papillary thyroid cancer |
| ∗log2FC in expression of this searched gene in stem-like cells from each diseased tissue sample relative to stem-like cells in normal samples in each tissue plotted against the malignancy continuum. Samples are colored based on if they are from different disease stage. |
Top |
Malignant transformation related pathway analysis |
| Find out the enriched GO biological processes and KEGG pathways involved in transition from healthy to precancer to cancer |
| Tissue | Disease Stage | Enriched GO biological Processes |
| Colorectum | AD |  |
| Colorectum | SER |  |
| Colorectum | MSS |  |
| Colorectum | MSI-H |  |
| Colorectum | FAP |  |
| ∗Top 15 enriched GO BP terms are showed in the bar plot of each disease state in each tissue. Each row represents a significant GO biological process which is colored according to the -log10(p.adjust). |
| Page: 1 2 3 4 5 6 7 8 9 |
| GO ID | Tissue | Disease Stage | Description | Gene Ratio | Bg Ratio | pvalue | p.adjust | Count |
| GO:00069799 | Breast | Precancer | response to oxidative stress | 70/1080 | 446/18723 | 1.59e-14 | 4.26e-12 | 70 |
| GO:00485459 | Breast | Precancer | response to steroid hormone | 53/1080 | 339/18723 | 3.07e-11 | 3.66e-09 | 53 |
| GO:00003029 | Breast | Precancer | response to reactive oxygen species | 38/1080 | 222/18723 | 1.47e-09 | 1.23e-07 | 38 |
| GO:00319608 | Breast | Precancer | response to corticosteroid | 30/1080 | 167/18723 | 2.50e-08 | 1.65e-06 | 30 |
| GO:00425429 | Breast | Precancer | response to hydrogen peroxide | 26/1080 | 146/18723 | 2.52e-07 | 1.26e-05 | 26 |
| GO:00513848 | Breast | Precancer | response to glucocorticoid | 26/1080 | 148/18723 | 3.32e-07 | 1.57e-05 | 26 |
| GO:00100389 | Breast | Precancer | response to metal ion | 47/1080 | 373/18723 | 3.88e-07 | 1.79e-05 | 47 |
| GO:00420609 | Breast | Precancer | wound healing | 48/1080 | 422/18723 | 5.48e-06 | 1.63e-04 | 48 |
| GO:00096368 | Breast | Precancer | response to toxic substance | 31/1080 | 262/18723 | 1.18e-04 | 2.12e-03 | 31 |
| GO:00486087 | Breast | Precancer | reproductive structure development | 43/1080 | 424/18723 | 2.36e-04 | 3.56e-03 | 43 |
| GO:00614587 | Breast | Precancer | reproductive system development | 43/1080 | 427/18723 | 2.75e-04 | 4.00e-03 | 43 |
| GO:19035434 | Breast | Precancer | positive regulation of exosomal secretion | 5/1080 | 15/18723 | 1.17e-03 | 1.26e-02 | 5 |
| GO:19035416 | Breast | Precancer | regulation of exosomal secretion | 5/1080 | 17/18723 | 2.19e-03 | 2.06e-02 | 5 |
| GO:00515925 | Breast | Precancer | response to calcium ion | 18/1080 | 149/18723 | 2.37e-03 | 2.19e-02 | 18 |
| GO:00515919 | Breast | Precancer | response to cAMP | 13/1080 | 93/18723 | 2.57e-03 | 2.33e-02 | 13 |
| GO:0046661 | Breast | Precancer | male sex differentiation | 19/1080 | 165/18723 | 3.14e-03 | 2.65e-02 | 19 |
| GO:0008584 | Breast | Precancer | male gonad development | 17/1080 | 141/18723 | 3.15e-03 | 2.65e-02 | 17 |
| GO:0046546 | Breast | Precancer | development of primary male sexual characteristics | 17/1080 | 142/18723 | 3.39e-03 | 2.84e-02 | 17 |
| GO:00466839 | Breast | Precancer | response to organophosphorus | 16/1080 | 131/18723 | 3.60e-03 | 2.98e-02 | 16 |
| GO:00020649 | Breast | Precancer | epithelial cell development | 23/1080 | 220/18723 | 4.28e-03 | 3.35e-02 | 23 |
| Page: 1 2 3 4 5 6 7 8 9 10 11 12 13 14 15 16 17 18 19 20 21 22 23 24 25 26 27 28 29 30 31 32 33 |
| Pathway ID | Tissue | Disease Stage | Description | Gene Ratio | Bg Ratio | pvalue | p.adjust | qvalue | Count |
| hsa0541818 | Breast | Precancer | Fluid shear stress and atherosclerosis | 28/684 | 139/8465 | 4.74e-06 | 6.00e-05 | 4.59e-05 | 28 |
| hsa0520514 | Breast | Precancer | Proteoglycans in cancer | 30/684 | 205/8465 | 1.00e-03 | 7.18e-03 | 5.50e-03 | 30 |
| hsa0541819 | Breast | Precancer | Fluid shear stress and atherosclerosis | 28/684 | 139/8465 | 4.74e-06 | 6.00e-05 | 4.59e-05 | 28 |
| hsa0520515 | Breast | Precancer | Proteoglycans in cancer | 30/684 | 205/8465 | 1.00e-03 | 7.18e-03 | 5.50e-03 | 30 |
| hsa0541824 | Breast | IDC | Fluid shear stress and atherosclerosis | 34/867 | 139/8465 | 9.41e-07 | 1.61e-05 | 1.20e-05 | 34 |
| hsa0520523 | Breast | IDC | Proteoglycans in cancer | 42/867 | 205/8465 | 7.69e-06 | 9.99e-05 | 7.48e-05 | 42 |
| hsa0541834 | Breast | IDC | Fluid shear stress and atherosclerosis | 34/867 | 139/8465 | 9.41e-07 | 1.61e-05 | 1.20e-05 | 34 |
| hsa0520533 | Breast | IDC | Proteoglycans in cancer | 42/867 | 205/8465 | 7.69e-06 | 9.99e-05 | 7.48e-05 | 42 |
| hsa0541844 | Breast | DCIS | Fluid shear stress and atherosclerosis | 34/846 | 139/8465 | 5.31e-07 | 9.03e-06 | 6.65e-06 | 34 |
| hsa0520542 | Breast | DCIS | Proteoglycans in cancer | 39/846 | 205/8465 | 5.36e-05 | 5.58e-04 | 4.11e-04 | 39 |
| hsa0541854 | Breast | DCIS | Fluid shear stress and atherosclerosis | 34/846 | 139/8465 | 5.31e-07 | 9.03e-06 | 6.65e-06 | 34 |
| hsa0520552 | Breast | DCIS | Proteoglycans in cancer | 39/846 | 205/8465 | 5.36e-05 | 5.58e-04 | 4.11e-04 | 39 |
| hsa0541820 | Cervix | CC | Fluid shear stress and atherosclerosis | 50/1267 | 139/8465 | 5.71e-10 | 1.32e-08 | 7.81e-09 | 50 |
| hsa0520516 | Cervix | CC | Proteoglycans in cancer | 60/1267 | 205/8465 | 9.13e-08 | 1.18e-06 | 7.00e-07 | 60 |
| hsa045147 | Cervix | CC | Cell adhesion molecules | 36/1267 | 157/8465 | 4.94e-03 | 1.67e-02 | 9.86e-03 | 36 |
| hsa05418110 | Cervix | CC | Fluid shear stress and atherosclerosis | 50/1267 | 139/8465 | 5.71e-10 | 1.32e-08 | 7.81e-09 | 50 |
| hsa0520517 | Cervix | CC | Proteoglycans in cancer | 60/1267 | 205/8465 | 9.13e-08 | 1.18e-06 | 7.00e-07 | 60 |
| hsa0451412 | Cervix | CC | Cell adhesion molecules | 36/1267 | 157/8465 | 4.94e-03 | 1.67e-02 | 9.86e-03 | 36 |
| hsa0451421 | Cervix | HSIL_HPV | Cell adhesion molecules | 20/459 | 157/8465 | 3.03e-04 | 3.06e-03 | 2.47e-03 | 20 |
| hsa045124 | Cervix | HSIL_HPV | ECM-receptor interaction | 12/459 | 89/8465 | 2.95e-03 | 1.88e-02 | 1.52e-02 | 12 |
| Page: 1 2 3 4 |
Top |
Cell-cell communication analysis |
| Identification of potential cell-cell interactions between two cell types and their ligand-receptor pairs for different disease states |
| Ligand | Receptor | LRpair | Pathway | Tissue | Disease Stage |
| COL1A1 | SDC1 | COL1A1_SDC1 | COLLAGEN | Breast | DCIS |
| COL1A2 | SDC1 | COL1A2_SDC1 | COLLAGEN | Breast | DCIS |
| COL4A1 | SDC1 | COL4A1_SDC1 | COLLAGEN | Breast | DCIS |
| COL4A2 | SDC1 | COL4A2_SDC1 | COLLAGEN | Breast | DCIS |
| COL6A1 | SDC1 | COL6A1_SDC1 | COLLAGEN | Breast | DCIS |
| COL6A2 | SDC1 | COL6A2_SDC1 | COLLAGEN | Breast | DCIS |
| COL6A3 | SDC1 | COL6A3_SDC1 | COLLAGEN | Breast | DCIS |
| MDK | SDC1 | MDK_SDC1 | MK | Breast | DCIS |
| FN1 | SDC1 | FN1_SDC1 | FN1 | Breast | DCIS |
| PTN | SDC1 | PTN_SDC1 | PTN | Breast | DCIS |
| THBS1 | SDC1 | THBS1_SDC1 | THBS | Breast | DCIS |
| THBS2 | SDC1 | THBS2_SDC1 | THBS | Breast | DCIS |
| THBS3 | SDC1 | THBS3_SDC1 | THBS | Breast | DCIS |
| ANGPTL4 | SDC1 | ANGPTL4_SDC1 | ANGPTL | Breast | DCIS |
| TNC | SDC1 | TNC_SDC1 | TENASCIN | Breast | DCIS |
| TNXB | SDC1 | TNXB_SDC1 | TENASCIN | Breast | DCIS |
| COL1A1 | SDC1 | COL1A1_SDC1 | COLLAGEN | Breast | Healthy |
| COL1A2 | SDC1 | COL1A2_SDC1 | COLLAGEN | Breast | Healthy |
| COL4A1 | SDC1 | COL4A1_SDC1 | COLLAGEN | Breast | Healthy |
| COL4A2 | SDC1 | COL4A2_SDC1 | COLLAGEN | Breast | Healthy |
| Page: 1 |
Top |
Single-cell gene regulatory network inference analysis |
| Find out the significant the regulons (TFs) and the target genes of each regulon across cell types for different disease states |
| TF | Cell Type | Tissue | Disease Stage | Target Gene | RSS | Regulon Activity |
| ∗The dot plots of a searched regulon are shown for all cell subpopulations in each disease state of each tissue based on the regulon specific score inferred using pySCENIC and by calculating the average expression. |
| Page: 1 |
Top |
Somatic mutation of malignant transformation related genes |
| Annotation of somatic variants for genes involved in malignant transformation |
| Hugo Symbol | Variant Class | Variant Classification | dbSNP RS | HGVSc | HGVSp | HGVSp Short | SWISSPROT | BIOTYPE | SIFT | PolyPhen | Tumor Sample Barcode | Tissue | Histology | Sex | Age | Stage | Therapy Types | Drugs | Outcome |
| SDC1 | deletion | Frame_Shift_Del | novel | c.644_647delNNNN | p.Thr215ArgfsTer7 | p.T215Rfs*7 | P18827 | protein_coding | TCGA-BH-A0H7-01 | Breast | breast invasive carcinoma | Female | >=65 | III/IV | Chemotherapy | doxorubicin | SD | ||
| SDC1 | SNV | Missense_Mutation | c.491N>G | p.Thr164Ser | p.T164S | P18827 | protein_coding | tolerated(0.39) | possibly_damaging(0.724) | TCGA-C5-A1BQ-01 | Cervix | cervical & endocervical cancer | Female | >=65 | III/IV | Chemotherapy | cisplatin | CR | |
| SDC1 | SNV | Missense_Mutation | novel | c.703N>C | p.Val235Leu | p.V235L | P18827 | protein_coding | tolerated(0.15) | benign(0.05) | TCGA-ZJ-AAXB-01 | Cervix | cervical & endocervical cancer | Female | <65 | I/II | Unknown | Unknown | SD |
| SDC1 | SNV | Missense_Mutation | rs753254745 | c.847N>A | p.Glu283Lys | p.E283K | P18827 | protein_coding | deleterious(0) | probably_damaging(0.999) | TCGA-AZ-4315-01 | Colorectum | colon adenocarcinoma | Male | <65 | I/II | Unknown | Unknown | SD |
| SDC1 | SNV | Missense_Mutation | c.627N>T | p.Gln209His | p.Q209H | P18827 | protein_coding | tolerated(0.05) | possibly_damaging(0.756) | TCGA-AZ-4615-01 | Colorectum | colon adenocarcinoma | Male | >=65 | III/IV | Chemotherapy | xeloda | PD | |
| SDC1 | SNV | Missense_Mutation | novel | c.103N>A | p.Asp35Asn | p.D35N | P18827 | protein_coding | deleterious(0) | probably_damaging(0.99) | TCGA-CK-4951-01 | Colorectum | colon adenocarcinoma | Female | >=65 | I/II | Unknown | Unknown | PD |
| SDC1 | SNV | Missense_Mutation | novel | c.132N>A | p.Phe44Leu | p.F44L | P18827 | protein_coding | deleterious(0) | possibly_damaging(0.856) | TCGA-AG-A002-01 | Colorectum | rectum adenocarcinoma | Male | <65 | I/II | Unknown | Unknown | SD |
| SDC1 | SNV | Missense_Mutation | novel | c.187T>A | p.Ser63Thr | p.S63T | P18827 | protein_coding | tolerated(0.3) | benign(0.187) | TCGA-A5-A1OF-01 | Endometrium | uterine corpus endometrioid carcinoma | Female | <65 | I/II | Unknown | Unknown | SD |
| SDC1 | SNV | Missense_Mutation | novel | c.97G>T | p.Asp33Tyr | p.D33Y | P18827 | protein_coding | deleterious(0) | probably_damaging(0.998) | TCGA-AX-A2HC-01 | Endometrium | uterine corpus endometrioid carcinoma | Female | <65 | III/IV | Chemotherapy | paclitaxel | PD |
| SDC1 | SNV | Missense_Mutation | rs747228317 | c.718N>G | p.Thr240Ala | p.T240A | P18827 | protein_coding | tolerated(0.76) | benign(0.046) | TCGA-B5-A0JY-01 | Endometrium | uterine corpus endometrioid carcinoma | Female | <65 | III/IV | Chemotherapy | doxorubicin | SD |
| Page: 1 2 3 |
Top |
Related drugs of malignant transformation related genes |
| Identification of chemicals and drugs interact with genes involved in malignant transfromation |
| (DGIdb 4.0) |
| Entrez ID | Symbol | Category | Interaction Types | Drug Claim Name | Drug Name | PMIDs |
| 6382 | SDC1 | CELL SURFACE, EXTERNAL SIDE OF PLASMA MEMBRANE, DRUGGABLE GENOME | CAR138 T Cells | |||
| 6382 | SDC1 | CELL SURFACE, EXTERNAL SIDE OF PLASMA MEMBRANE, DRUGGABLE GENOME | CART-138 cells | |||
| 6382 | SDC1 | CELL SURFACE, EXTERNAL SIDE OF PLASMA MEMBRANE, DRUGGABLE GENOME | CD138 CAR T cells | |||
| 6382 | SDC1 | CELL SURFACE, EXTERNAL SIDE OF PLASMA MEMBRANE, DRUGGABLE GENOME | BT-062 | INDATUXIMAB RAVTANSINE | ||
| 6382 | SDC1 | CELL SURFACE, EXTERNAL SIDE OF PLASMA MEMBRANE, DRUGGABLE GENOME | HEPARIN | HEPARIN | 11333985 | |
| 6382 | SDC1 | CELL SURFACE, EXTERNAL SIDE OF PLASMA MEMBRANE, DRUGGABLE GENOME | CAR-T cells targeting CD138 |
| Page: 1 |

Copyright 2023-Present -The University of Texas Health Science Center at Houston |