
|
|||||
|
 | |
| |
| |
| |
| |
| |
|
Gene: SCYL2 |
Gene summary for SCYL2 |
| Gene information | Species | Human | Gene symbol | SCYL2 | Gene ID | 55681 |
| Gene name | SCY1 like pseudokinase 2 | |
| Gene Alias | AMC4 | |
| Cytomap | 12q23.1 | |
| Gene Type | protein-coding | GO ID | GO:0002090 | UniProtAcc | Q6P3W7 |
Top |
Malignant transformation analysis |
| Identification of the aberrant gene expression in precancerous and cancerous lesions by comparing the gene expression of stem-like cells in diseased tissues with normal stem cells |
| Entrez ID | Symbol | Replicates | Species | Organ | Tissue | Adj P-value | Log2FC | Malignancy |
| 55681 | SCYL2 | CCI_2 | Human | Cervix | CC | 6.15e-04 | 8.75e-01 | 0.5249 |
| 55681 | SCYL2 | CCI_3 | Human | Cervix | CC | 6.75e-04 | 5.70e-01 | 0.516 |
| 55681 | SCYL2 | HTA11_3410_2000001011 | Human | Colorectum | AD | 3.21e-10 | -5.12e-01 | 0.0155 |
| 55681 | SCYL2 | HTA11_3361_2000001011 | Human | Colorectum | AD | 2.75e-02 | -4.59e-01 | -0.1207 |
| 55681 | SCYL2 | HTA11_696_2000001011 | Human | Colorectum | AD | 9.48e-04 | -2.79e-01 | -0.1464 |
| 55681 | SCYL2 | HTA11_866_2000001011 | Human | Colorectum | AD | 1.71e-02 | -2.70e-01 | -0.1001 |
| 55681 | SCYL2 | HTA11_1391_2000001011 | Human | Colorectum | AD | 9.61e-04 | -3.36e-01 | -0.059 |
| 55681 | SCYL2 | HTA11_866_3004761011 | Human | Colorectum | AD | 1.06e-07 | -4.97e-01 | 0.096 |
| 55681 | SCYL2 | HTA11_9408_2000001011 | Human | Colorectum | AD | 4.12e-02 | -6.51e-01 | 0.0451 |
| 55681 | SCYL2 | HTA11_10711_2000001011 | Human | Colorectum | AD | 2.08e-02 | -4.58e-01 | 0.0338 |
| 55681 | SCYL2 | HTA11_7696_3000711011 | Human | Colorectum | AD | 3.11e-14 | -4.41e-01 | 0.0674 |
| 55681 | SCYL2 | HTA11_6818_2000001021 | Human | Colorectum | AD | 3.92e-03 | -5.05e-01 | 0.0588 |
| 55681 | SCYL2 | HTA11_99999970781_79442 | Human | Colorectum | MSS | 9.05e-07 | -3.32e-01 | 0.294 |
| 55681 | SCYL2 | HTA11_99999971662_82457 | Human | Colorectum | MSS | 3.52e-06 | -3.79e-01 | 0.3859 |
| 55681 | SCYL2 | HTA11_99999973899_84307 | Human | Colorectum | MSS | 2.92e-02 | -5.10e-01 | 0.2585 |
| 55681 | SCYL2 | HTA11_99999974143_84620 | Human | Colorectum | MSS | 1.41e-18 | -5.30e-01 | 0.3005 |
| 55681 | SCYL2 | F007 | Human | Colorectum | FAP | 3.02e-03 | -3.50e-01 | 0.1176 |
| 55681 | SCYL2 | A002-C-010 | Human | Colorectum | FAP | 7.49e-05 | -2.63e-01 | 0.242 |
| 55681 | SCYL2 | A001-C-207 | Human | Colorectum | FAP | 2.95e-03 | -3.18e-01 | 0.1278 |
| 55681 | SCYL2 | A015-C-203 | Human | Colorectum | FAP | 3.40e-27 | -4.20e-01 | -0.1294 |
| Page: 1 2 3 4 5 6 7 8 |
| Tissue | Expression Dynamics | Abbreviation |
| Cervix | 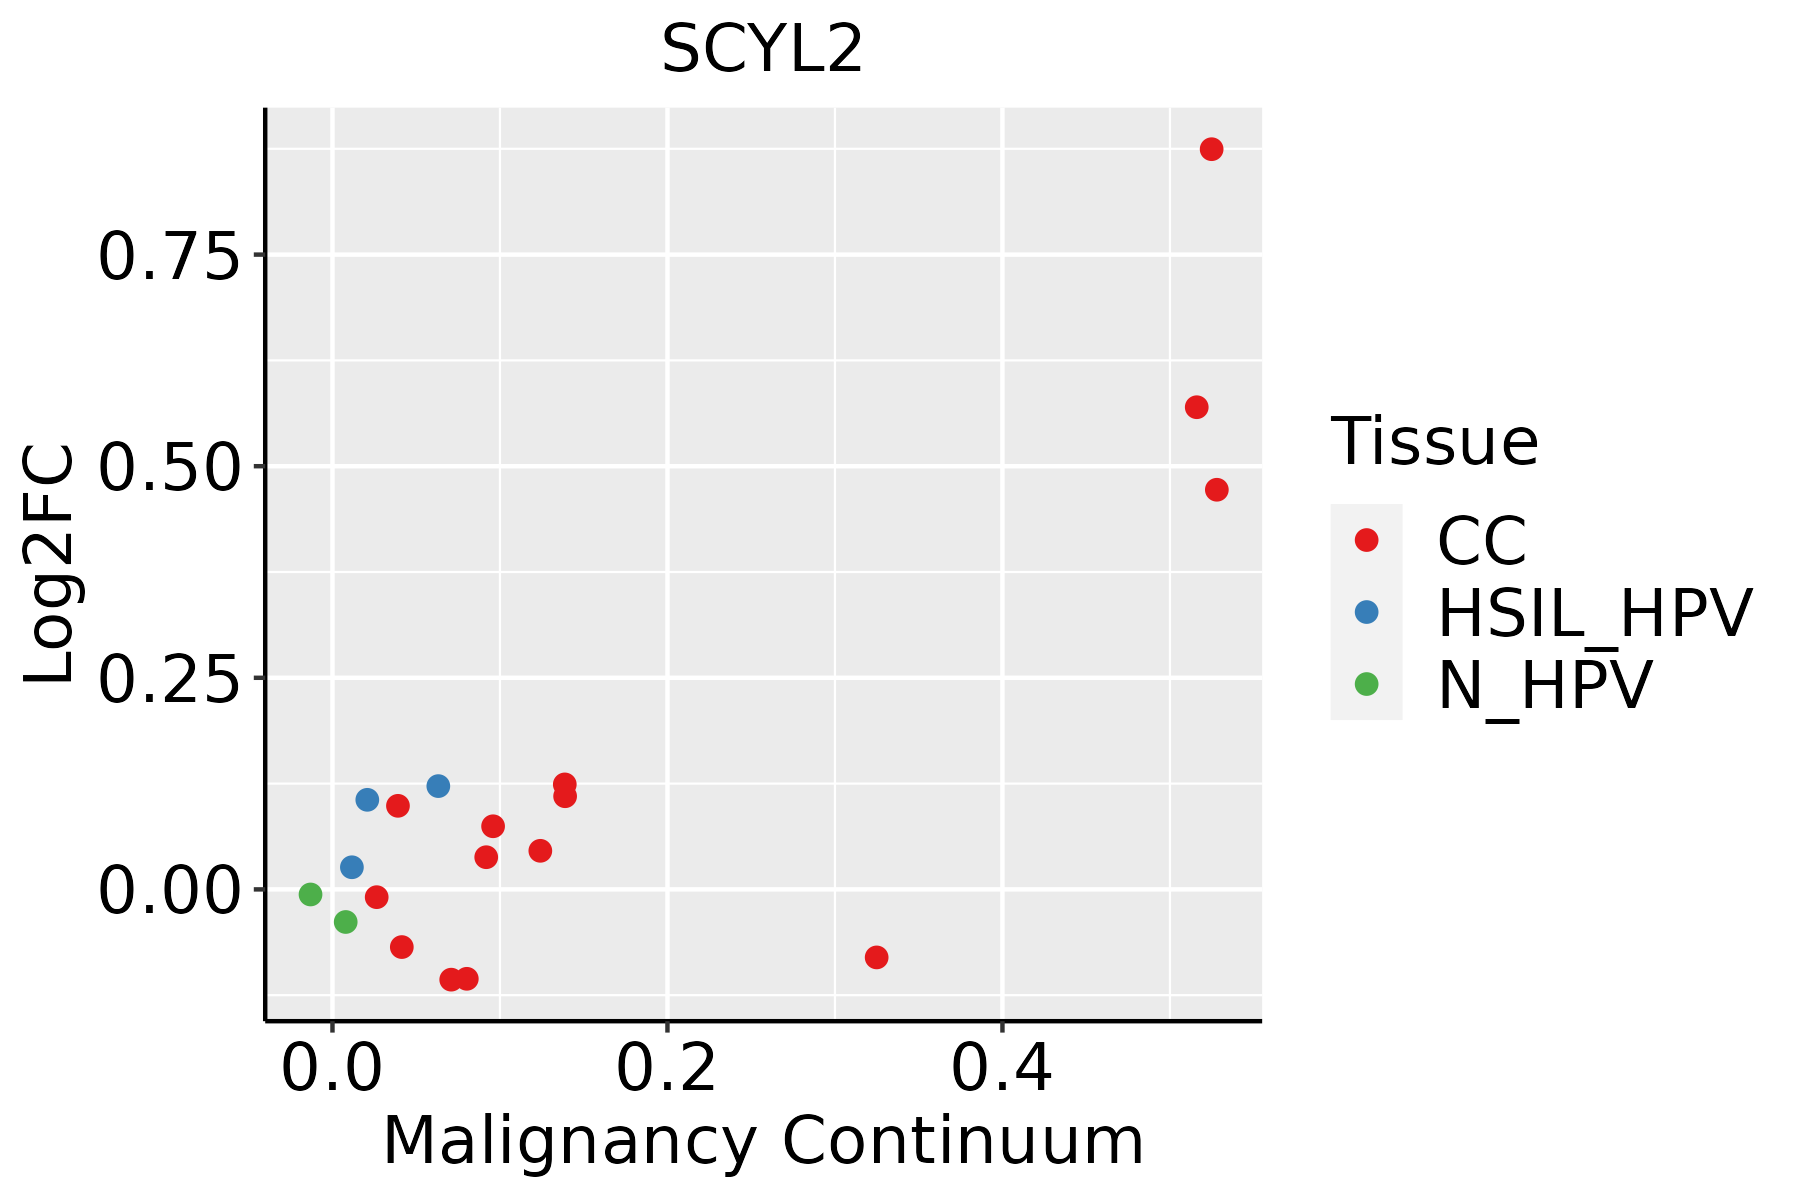 | CC: Cervix cancer |
| HSIL_HPV: HPV-infected high-grade squamous intraepithelial lesions | ||
| N_HPV: HPV-infected normal cervix | ||
| Colorectum (GSE201348) |  | FAP: Familial adenomatous polyposis |
| CRC: Colorectal cancer | ||
| Colorectum (HTA11) |  | AD: Adenomas |
| SER: Sessile serrated lesions | ||
| MSI-H: Microsatellite-high colorectal cancer | ||
| MSS: Microsatellite stable colorectal cancer | ||
| Esophagus | 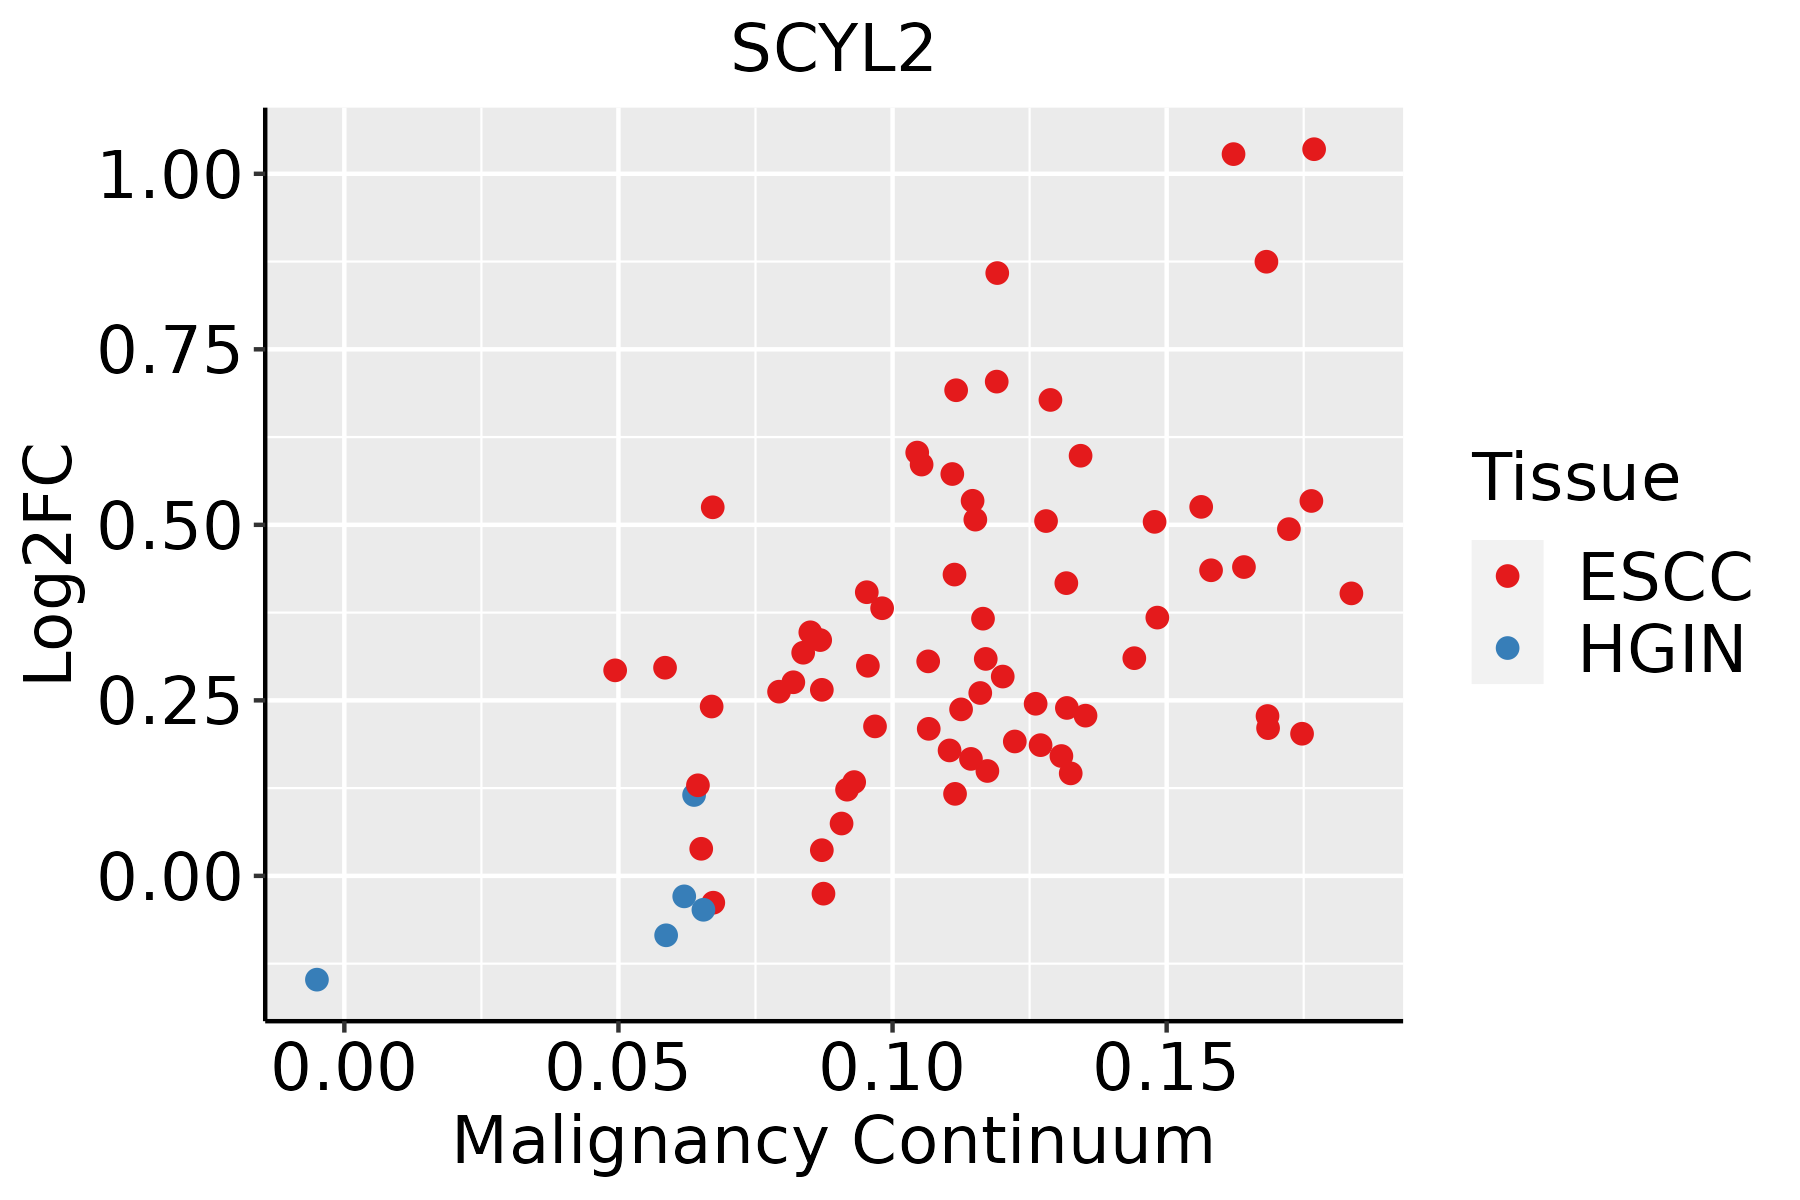 | ESCC: Esophageal squamous cell carcinoma |
| HGIN: High-grade intraepithelial neoplasias | ||
| LGIN: Low-grade intraepithelial neoplasias | ||
| Liver |  | HCC: Hepatocellular carcinoma |
| NAFLD: Non-alcoholic fatty liver disease | ||
| Oral Cavity |  | EOLP: Erosive Oral lichen planus |
| LP: leukoplakia | ||
| NEOLP: Non-erosive oral lichen planus | ||
| OSCC: Oral squamous cell carcinoma | ||
| Skin |  | AK: Actinic keratosis |
| cSCC: Cutaneous squamous cell carcinoma | ||
| SCCIS:squamous cell carcinoma in situ | ||
| Thyroid |  | ATC: Anaplastic thyroid cancer |
| HT: Hashimoto's thyroiditis | ||
| PTC: Papillary thyroid cancer |
| ∗log2FC in expression of this searched gene in stem-like cells from each diseased tissue sample relative to stem-like cells in normal samples in each tissue plotted against the malignancy continuum. Samples are colored based on if they are from different disease stage. |
Top |
Malignant transformation related pathway analysis |
| Find out the enriched GO biological processes and KEGG pathways involved in transition from healthy to precancer to cancer |
| Tissue | Disease Stage | Enriched GO biological Processes |
| Colorectum | AD |  |
| Colorectum | SER |  |
| Colorectum | MSS |  |
| Colorectum | MSI-H |  |
| Colorectum | FAP |  |
| ∗Top 15 enriched GO BP terms are showed in the bar plot of each disease state in each tissue. Each row represents a significant GO biological process which is colored according to the -log10(p.adjust). |
| Page: 1 2 3 4 5 6 7 8 9 |
| GO ID | Tissue | Disease Stage | Description | Gene Ratio | Bg Ratio | pvalue | p.adjust | Count |
| GO:00160557 | Cervix | CC | Wnt signaling pathway | 98/2311 | 444/18723 | 4.82e-09 | 4.65e-07 | 98 |
| GO:01987387 | Cervix | CC | cell-cell signaling by wnt | 98/2311 | 446/18723 | 6.16e-09 | 5.58e-07 | 98 |
| GO:00301117 | Cervix | CC | regulation of Wnt signaling pathway | 76/2311 | 328/18723 | 3.05e-08 | 2.08e-06 | 76 |
| GO:00608287 | Cervix | CC | regulation of canonical Wnt signaling pathway | 58/2311 | 253/18723 | 1.83e-06 | 5.89e-05 | 58 |
| GO:00600707 | Cervix | CC | canonical Wnt signaling pathway | 66/2311 | 303/18723 | 2.47e-06 | 7.35e-05 | 66 |
| GO:00068987 | Cervix | CC | receptor-mediated endocytosis | 53/2311 | 244/18723 | 2.52e-05 | 4.29e-04 | 53 |
| GO:00301008 | Cervix | CC | regulation of endocytosis | 47/2311 | 211/18723 | 3.65e-05 | 5.82e-04 | 47 |
| GO:00458077 | Cervix | CC | positive regulation of endocytosis | 27/2311 | 100/18723 | 5.55e-05 | 8.10e-04 | 27 |
| GO:00725836 | Cervix | CC | clathrin-dependent endocytosis | 16/2311 | 47/18723 | 9.56e-05 | 1.25e-03 | 16 |
| GO:00431127 | Cervix | CC | receptor metabolic process | 37/2311 | 166/18723 | 2.31e-04 | 2.58e-03 | 37 |
| GO:00070347 | Cervix | CC | vacuolar transport | 34/2311 | 157/18723 | 7.03e-04 | 6.40e-03 | 34 |
| GO:00301784 | Cervix | CC | negative regulation of Wnt signaling pathway | 35/2311 | 170/18723 | 1.52e-03 | 1.17e-02 | 35 |
| GO:00900901 | Cervix | CC | negative regulation of canonical Wnt signaling pathway | 29/2311 | 137/18723 | 2.40e-03 | 1.70e-02 | 29 |
| GO:00482597 | Cervix | CC | regulation of receptor-mediated endocytosis | 24/2311 | 110/18723 | 3.62e-03 | 2.31e-02 | 24 |
| GO:00219541 | Cervix | CC | central nervous system neuron development | 19/2311 | 81/18723 | 3.96e-03 | 2.48e-02 | 19 |
| GO:00316236 | Cervix | CC | receptor internalization | 24/2311 | 113/18723 | 5.18e-03 | 3.05e-02 | 24 |
| GO:00309003 | Cervix | CC | forebrain development | 64/2311 | 379/18723 | 5.53e-03 | 3.19e-02 | 64 |
| GO:00070416 | Cervix | CC | lysosomal transport | 24/2311 | 114/18723 | 5.81e-03 | 3.33e-02 | 24 |
| GO:0007034 | Colorectum | AD | vacuolar transport | 60/3918 | 157/18723 | 4.97e-07 | 1.85e-05 | 60 |
| GO:0043112 | Colorectum | AD | receptor metabolic process | 62/3918 | 166/18723 | 8.18e-07 | 2.85e-05 | 62 |
| Page: 1 2 3 4 5 6 7 8 9 10 11 12 13 |
| Pathway ID | Tissue | Disease Stage | Description | Gene Ratio | Bg Ratio | pvalue | p.adjust | qvalue | Count |
| Page: 1 |
Top |
Cell-cell communication analysis |
| Identification of potential cell-cell interactions between two cell types and their ligand-receptor pairs for different disease states |
| Ligand | Receptor | LRpair | Pathway | Tissue | Disease Stage |
| Page: 1 |
Top |
Single-cell gene regulatory network inference analysis |
| Find out the significant the regulons (TFs) and the target genes of each regulon across cell types for different disease states |
| TF | Cell Type | Tissue | Disease Stage | Target Gene | RSS | Regulon Activity |
| ∗The dot plots of a searched regulon are shown for all cell subpopulations in each disease state of each tissue based on the regulon specific score inferred using pySCENIC and by calculating the average expression. |
| Page: 1 |
Top |
Somatic mutation of malignant transformation related genes |
| Annotation of somatic variants for genes involved in malignant transformation |
| Hugo Symbol | Variant Class | Variant Classification | dbSNP RS | HGVSc | HGVSp | HGVSp Short | SWISSPROT | BIOTYPE | SIFT | PolyPhen | Tumor Sample Barcode | Tissue | Histology | Sex | Age | Stage | Therapy Types | Drugs | Outcome |
| SCYL2 | SNV | Missense_Mutation | novel | c.416N>G | p.Pro139Arg | p.P139R | protein_coding | deleterious(0.01) | benign(0.285) | TCGA-A2-A04Q-01 | Breast | breast invasive carcinoma | Female | <65 | I/II | Chemotherapy | adriamycin | SD | |
| SCYL2 | SNV | Missense_Mutation | novel | c.1571N>G | p.Asp524Gly | p.D524G | protein_coding | deleterious(0) | probably_damaging(0.952) | TCGA-A8-A085-01 | Breast | breast invasive carcinoma | Male | <65 | I/II | Hormone Therapy | tamoxiphen | SD | |
| SCYL2 | SNV | Missense_Mutation | c.834N>A | p.Phe278Leu | p.F278L | protein_coding | tolerated(0.09) | benign(0.32) | TCGA-AC-A23H-01 | Breast | breast invasive carcinoma | Female | >=65 | I/II | Unknown | Unknown | PD | ||
| SCYL2 | SNV | Missense_Mutation | rs147018741 | c.1525N>T | p.Arg509Cys | p.R509C | protein_coding | deleterious(0) | benign(0.432) | TCGA-AN-A046-01 | Breast | breast invasive carcinoma | Female | >=65 | I/II | Unknown | Unknown | SD | |
| SCYL2 | SNV | Missense_Mutation | c.2698A>T | p.Met900Leu | p.M900L | protein_coding | tolerated_low_confidence(0.28) | benign(0) | TCGA-B6-A1KN-01 | Breast | breast invasive carcinoma | Female | <65 | III/IV | Unknown | Unknown | SD | ||
| SCYL2 | SNV | Missense_Mutation | novel | c.628N>C | p.Glu210Gln | p.E210Q | protein_coding | tolerated(0.54) | benign(0.025) | TCGA-BH-A0B6-01 | Breast | breast invasive carcinoma | Female | <65 | I/II | Unknown | Unknown | SD | |
| SCYL2 | SNV | Missense_Mutation | novel | c.2525C>T | p.Ser842Phe | p.S842F | protein_coding | deleterious(0) | probably_damaging(0.979) | TCGA-BH-A0H5-01 | Breast | breast invasive carcinoma | Female | <65 | I/II | Chemotherapy | cytoxan | CR | |
| SCYL2 | SNV | Missense_Mutation | c.2022N>C | p.Gln674His | p.Q674H | protein_coding | tolerated(0.13) | benign(0.003) | TCGA-D8-A147-01 | Breast | breast invasive carcinoma | Female | <65 | I/II | Chemotherapy | doxorubicine | SD | ||
| SCYL2 | SNV | Missense_Mutation | c.958C>G | p.Gln320Glu | p.Q320E | protein_coding | tolerated(0.16) | possibly_damaging(0.55) | TCGA-D8-A1JA-01 | Breast | breast invasive carcinoma | Female | <65 | III/IV | Chemotherapy | adriamycin | PD | ||
| SCYL2 | SNV | Missense_Mutation | novel | c.1343A>G | p.Glu448Gly | p.E448G | protein_coding | tolerated(0.06) | benign(0.042) | TCGA-D8-A3Z6-01 | Breast | breast invasive carcinoma | Female | <65 | III/IV | Chemotherapy | cyclophosphane | SD |
| Page: 1 2 3 4 5 6 7 8 9 10 |
Top |
Related drugs of malignant transformation related genes |
| Identification of chemicals and drugs interact with genes involved in malignant transfromation |
| (DGIdb 4.0) |
| Entrez ID | Symbol | Category | Interaction Types | Drug Claim Name | Drug Name | PMIDs |
| Page: 1 |

Copyright 2023-Present -The University of Texas Health Science Center at Houston |