
|
|||||
|
 | |
| |
| |
| |
| |
| |
|
Gene: SCYL1 |
Gene summary for SCYL1 |
| Gene information | Species | Human | Gene symbol | SCYL1 | Gene ID | 57410 |
| Gene name | SCY1 like pseudokinase 1 | |
| Gene Alias | GKLP | |
| Cytomap | 11q13.1 | |
| Gene Type | protein-coding | GO ID | GO:0006464 | UniProtAcc | Q96KG9 |
Top |
Malignant transformation analysis |
| Identification of the aberrant gene expression in precancerous and cancerous lesions by comparing the gene expression of stem-like cells in diseased tissues with normal stem cells |
| Entrez ID | Symbol | Replicates | Species | Organ | Tissue | Adj P-value | Log2FC | Malignancy |
| 57410 | SCYL1 | LZE4T | Human | Esophagus | ESCC | 5.49e-13 | 3.27e-01 | 0.0811 |
| 57410 | SCYL1 | LZE7T | Human | Esophagus | ESCC | 2.23e-05 | 3.48e-01 | 0.0667 |
| 57410 | SCYL1 | LZE8T | Human | Esophagus | ESCC | 2.11e-04 | 2.63e-01 | 0.067 |
| 57410 | SCYL1 | LZE20T | Human | Esophagus | ESCC | 3.06e-19 | 7.56e-01 | 0.0662 |
| 57410 | SCYL1 | LZE22T | Human | Esophagus | ESCC | 5.63e-06 | 4.71e-01 | 0.068 |
| 57410 | SCYL1 | LZE24T | Human | Esophagus | ESCC | 6.74e-29 | 8.74e-01 | 0.0596 |
| 57410 | SCYL1 | LZE21T | Human | Esophagus | ESCC | 2.08e-04 | 3.36e-01 | 0.0655 |
| 57410 | SCYL1 | P1T-E | Human | Esophagus | ESCC | 4.41e-17 | 7.37e-01 | 0.0875 |
| 57410 | SCYL1 | P2T-E | Human | Esophagus | ESCC | 1.26e-25 | 4.91e-01 | 0.1177 |
| 57410 | SCYL1 | P4T-E | Human | Esophagus | ESCC | 1.48e-30 | 6.81e-01 | 0.1323 |
| 57410 | SCYL1 | P5T-E | Human | Esophagus | ESCC | 5.11e-30 | 6.00e-01 | 0.1327 |
| 57410 | SCYL1 | P8T-E | Human | Esophagus | ESCC | 4.67e-35 | 6.90e-01 | 0.0889 |
| 57410 | SCYL1 | P9T-E | Human | Esophagus | ESCC | 1.24e-21 | 4.98e-01 | 0.1131 |
| 57410 | SCYL1 | P10T-E | Human | Esophagus | ESCC | 1.80e-45 | 8.72e-01 | 0.116 |
| 57410 | SCYL1 | P11T-E | Human | Esophagus | ESCC | 4.22e-16 | 8.07e-01 | 0.1426 |
| 57410 | SCYL1 | P12T-E | Human | Esophagus | ESCC | 1.47e-29 | 6.09e-01 | 0.1122 |
| 57410 | SCYL1 | P15T-E | Human | Esophagus | ESCC | 8.92e-28 | 6.23e-01 | 0.1149 |
| 57410 | SCYL1 | P16T-E | Human | Esophagus | ESCC | 2.75e-34 | 6.93e-01 | 0.1153 |
| 57410 | SCYL1 | P17T-E | Human | Esophagus | ESCC | 2.02e-11 | 5.90e-01 | 0.1278 |
| 57410 | SCYL1 | P19T-E | Human | Esophagus | ESCC | 1.21e-16 | 7.43e-01 | 0.1662 |
| Page: 1 2 3 4 5 6 |
| Tissue | Expression Dynamics | Abbreviation |
| Esophagus | 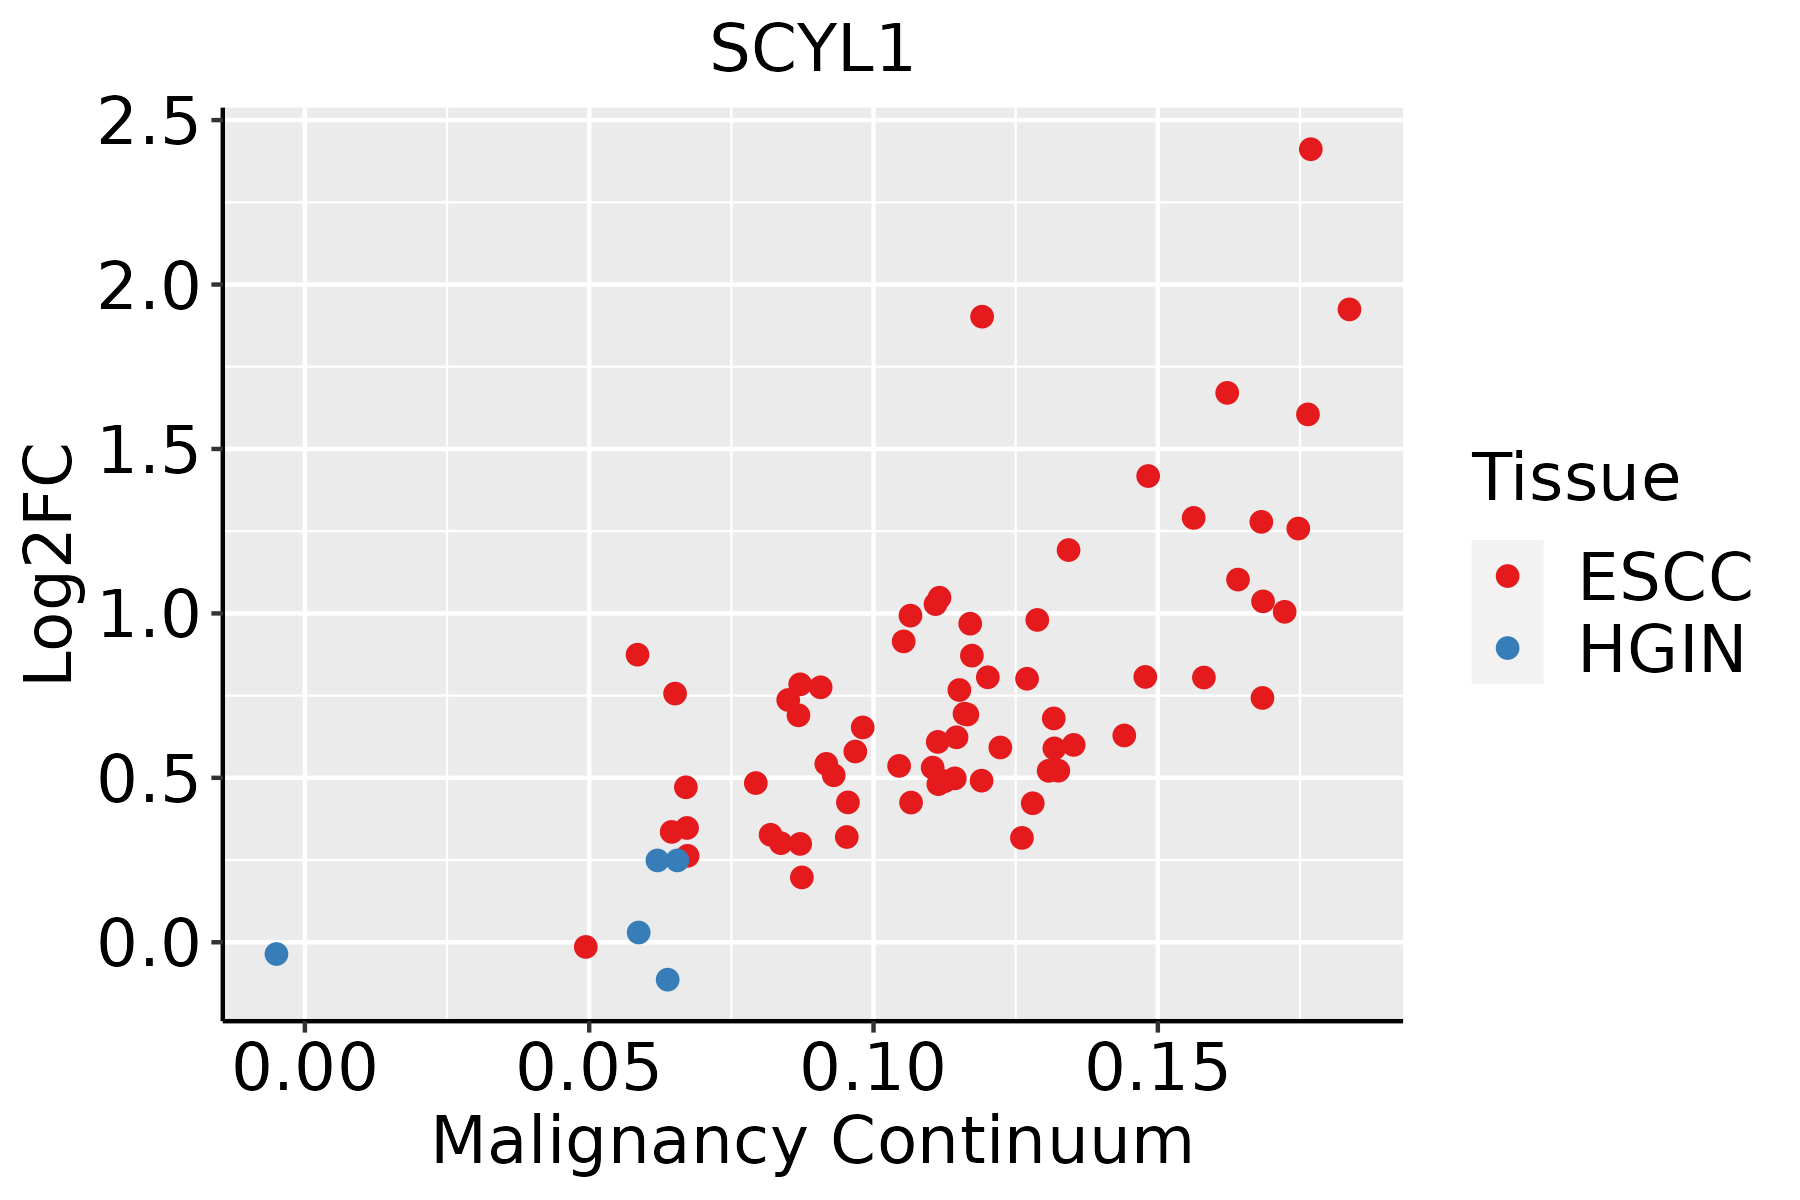 | ESCC: Esophageal squamous cell carcinoma |
| HGIN: High-grade intraepithelial neoplasias | ||
| LGIN: Low-grade intraepithelial neoplasias | ||
| Liver |  | HCC: Hepatocellular carcinoma |
| NAFLD: Non-alcoholic fatty liver disease | ||
| Oral Cavity | 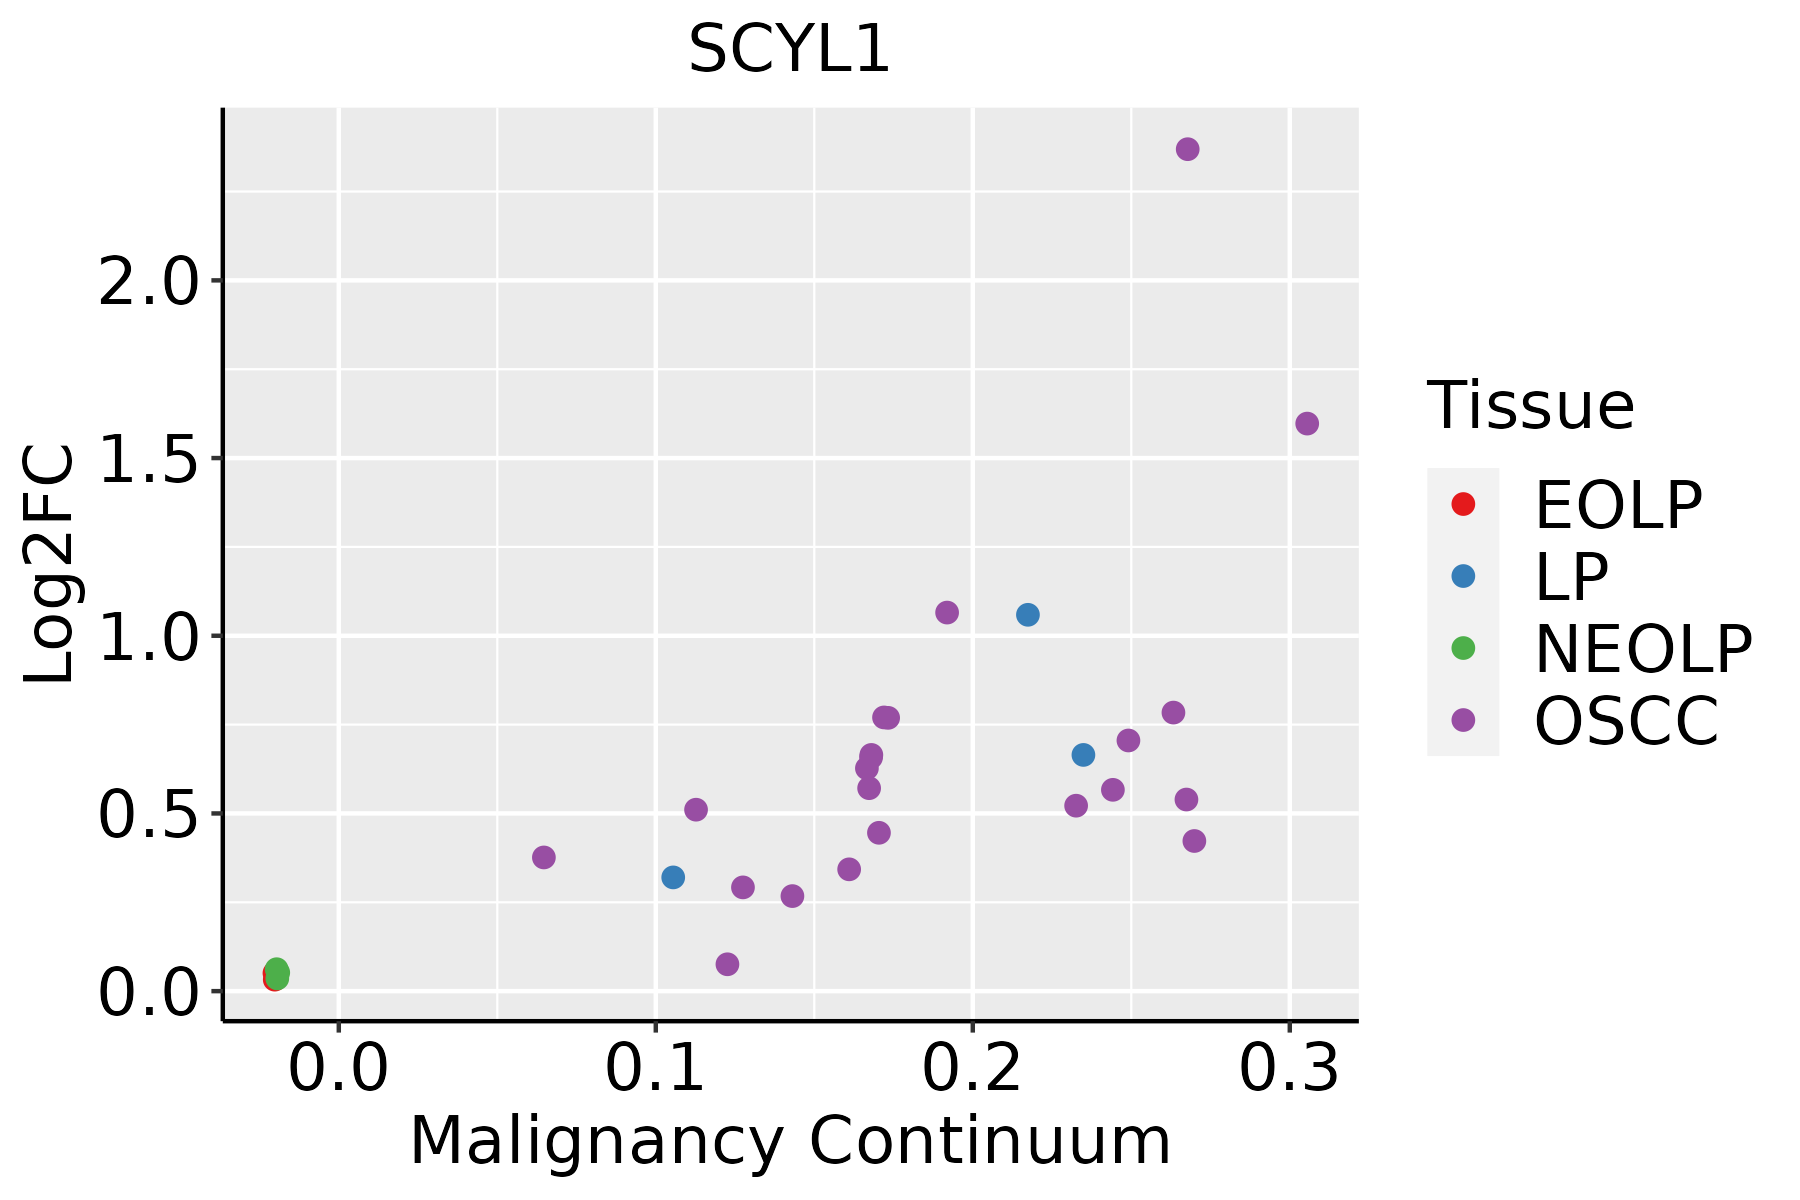 | EOLP: Erosive Oral lichen planus |
| LP: leukoplakia | ||
| NEOLP: Non-erosive oral lichen planus | ||
| OSCC: Oral squamous cell carcinoma | ||
| Skin | 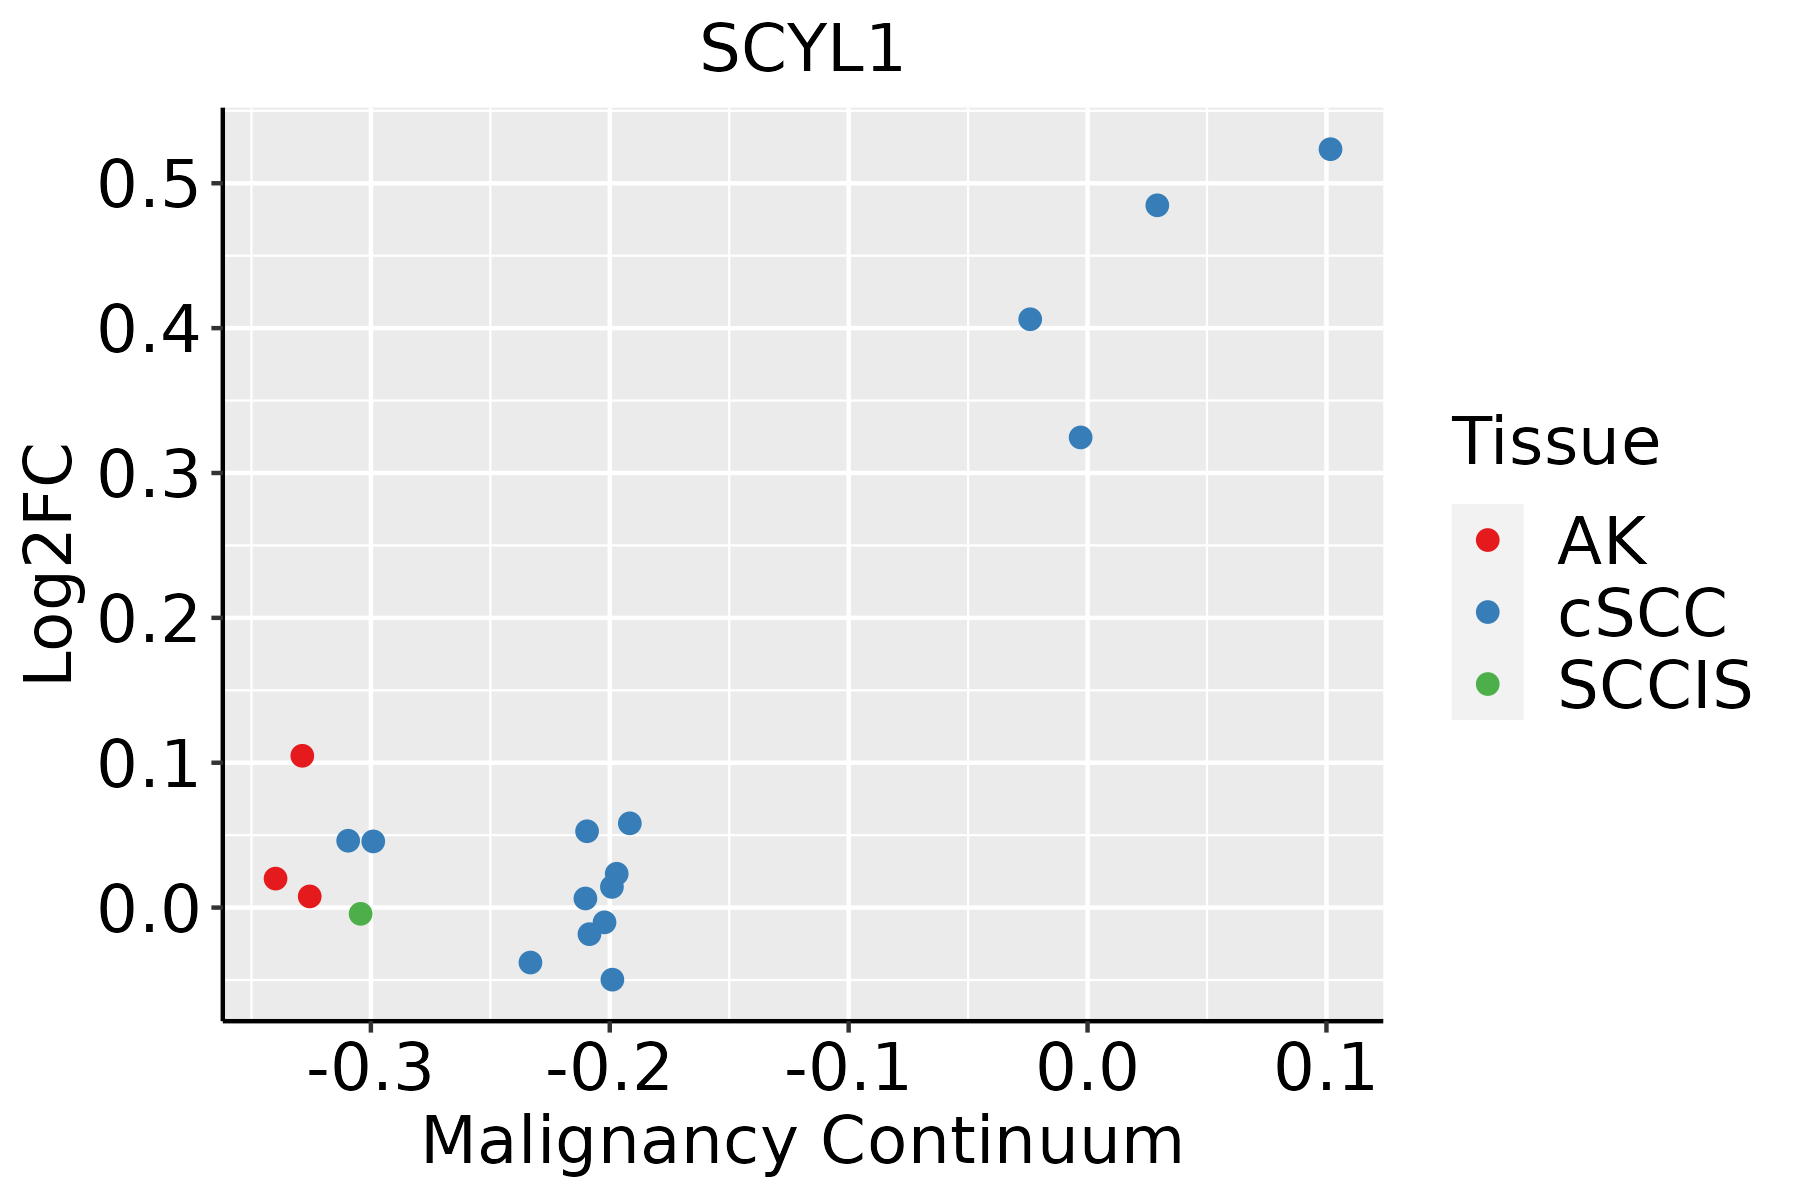 | AK: Actinic keratosis |
| cSCC: Cutaneous squamous cell carcinoma | ||
| SCCIS:squamous cell carcinoma in situ | ||
| Thyroid | 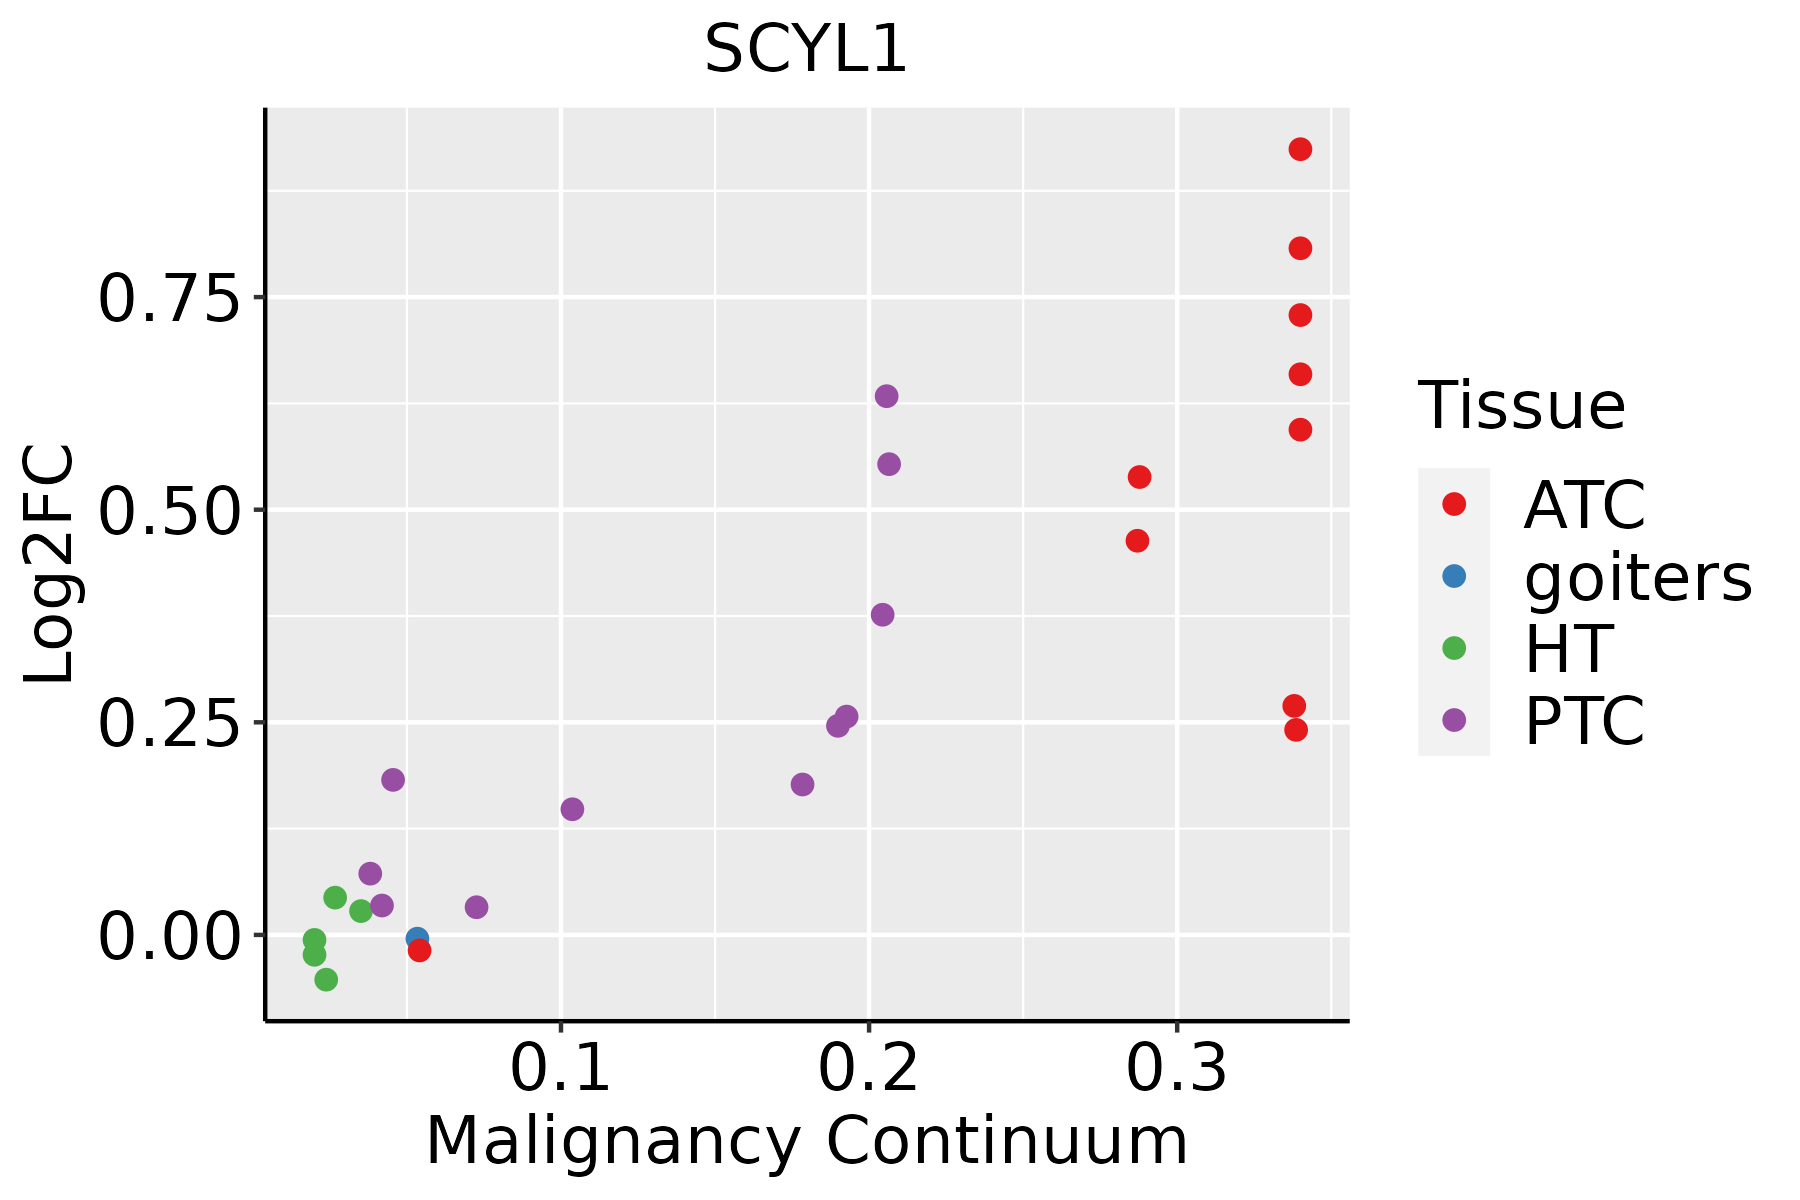 | ATC: Anaplastic thyroid cancer |
| HT: Hashimoto's thyroiditis | ||
| PTC: Papillary thyroid cancer |
| ∗log2FC in expression of this searched gene in stem-like cells from each diseased tissue sample relative to stem-like cells in normal samples in each tissue plotted against the malignancy continuum. Samples are colored based on if they are from different disease stage. |
Top |
Malignant transformation related pathway analysis |
| Find out the enriched GO biological processes and KEGG pathways involved in transition from healthy to precancer to cancer |
| Tissue | Disease Stage | Enriched GO biological Processes |
| Colorectum | AD |  |
| Colorectum | SER |  |
| Colorectum | MSS |  |
| Colorectum | MSI-H |  |
| Colorectum | FAP |  |
| ∗Top 15 enriched GO BP terms are showed in the bar plot of each disease state in each tissue. Each row represents a significant GO biological process which is colored according to the -log10(p.adjust). |
| Page: 1 2 3 4 5 6 7 8 9 |
| GO ID | Tissue | Disease Stage | Description | Gene Ratio | Bg Ratio | pvalue | p.adjust | Count |
| GO:004819318 | Esophagus | ESCC | Golgi vesicle transport | 231/8552 | 296/18723 | 1.82e-30 | 9.63e-28 | 231 |
| GO:000689017 | Esophagus | ESCC | retrograde vesicle-mediated transport, Golgi to endoplasmic reticulum | 46/8552 | 52/18723 | 1.23e-10 | 3.66e-09 | 46 |
| GO:00182124 | Esophagus | ESCC | peptidyl-tyrosine modification | 202/8552 | 378/18723 | 1.34e-03 | 6.39e-03 | 202 |
| GO:00181084 | Esophagus | ESCC | peptidyl-tyrosine phosphorylation | 200/8552 | 375/18723 | 1.60e-03 | 7.45e-03 | 200 |
| GO:004819311 | Liver | Cirrhotic | Golgi vesicle transport | 153/4634 | 296/18723 | 1.02e-23 | 6.43e-21 | 153 |
| GO:00068905 | Liver | Cirrhotic | retrograde vesicle-mediated transport, Golgi to endoplasmic reticulum | 29/4634 | 52/18723 | 1.69e-06 | 3.22e-05 | 29 |
| GO:004819321 | Liver | HCC | Golgi vesicle transport | 217/7958 | 296/18723 | 2.58e-27 | 1.02e-24 | 217 |
| GO:000689011 | Liver | HCC | retrograde vesicle-mediated transport, Golgi to endoplasmic reticulum | 36/7958 | 52/18723 | 8.79e-05 | 7.66e-04 | 36 |
| GO:004819315 | Oral cavity | OSCC | Golgi vesicle transport | 209/7305 | 296/18723 | 1.39e-28 | 6.30e-26 | 209 |
| GO:000689010 | Oral cavity | OSCC | retrograde vesicle-mediated transport, Golgi to endoplasmic reticulum | 40/7305 | 52/18723 | 2.86e-08 | 5.50e-07 | 40 |
| GO:00182123 | Oral cavity | OSCC | peptidyl-tyrosine modification | 180/7305 | 378/18723 | 3.63e-04 | 2.22e-03 | 180 |
| GO:00181083 | Oral cavity | OSCC | peptidyl-tyrosine phosphorylation | 177/7305 | 375/18723 | 6.86e-04 | 3.83e-03 | 177 |
| GO:004819316 | Oral cavity | LP | Golgi vesicle transport | 141/4623 | 296/18723 | 6.11e-18 | 1.06e-15 | 141 |
| GO:000689015 | Oral cavity | LP | retrograde vesicle-mediated transport, Golgi to endoplasmic reticulum | 29/4623 | 52/18723 | 1.60e-06 | 3.79e-05 | 29 |
| GO:0048193110 | Skin | cSCC | Golgi vesicle transport | 153/4864 | 296/18723 | 1.85e-21 | 3.41e-19 | 153 |
| GO:000689018 | Skin | cSCC | retrograde vesicle-mediated transport, Golgi to endoplasmic reticulum | 27/4864 | 52/18723 | 5.68e-05 | 5.67e-04 | 27 |
| GO:004819320 | Thyroid | PTC | Golgi vesicle transport | 186/5968 | 296/18723 | 3.09e-28 | 1.22e-25 | 186 |
| GO:000689019 | Thyroid | PTC | retrograde vesicle-mediated transport, Golgi to endoplasmic reticulum | 37/5968 | 52/18723 | 6.98e-09 | 1.75e-07 | 37 |
| GO:00182126 | Thyroid | PTC | peptidyl-tyrosine modification | 142/5968 | 378/18723 | 1.02e-02 | 4.14e-02 | 142 |
| GO:0048193111 | Thyroid | ATC | Golgi vesicle transport | 189/6293 | 296/18723 | 9.58e-27 | 5.05e-24 | 189 |
| Page: 1 2 |
| Pathway ID | Tissue | Disease Stage | Description | Gene Ratio | Bg Ratio | pvalue | p.adjust | qvalue | Count |
| Page: 1 |
Top |
Cell-cell communication analysis |
| Identification of potential cell-cell interactions between two cell types and their ligand-receptor pairs for different disease states |
| Ligand | Receptor | LRpair | Pathway | Tissue | Disease Stage |
| Page: 1 |
Top |
Single-cell gene regulatory network inference analysis |
| Find out the significant the regulons (TFs) and the target genes of each regulon across cell types for different disease states |
| TF | Cell Type | Tissue | Disease Stage | Target Gene | RSS | Regulon Activity |
| ∗The dot plots of a searched regulon are shown for all cell subpopulations in each disease state of each tissue based on the regulon specific score inferred using pySCENIC and by calculating the average expression. |
| Page: 1 |
Top |
Somatic mutation of malignant transformation related genes |
| Annotation of somatic variants for genes involved in malignant transformation |
| Hugo Symbol | Variant Class | Variant Classification | dbSNP RS | HGVSc | HGVSp | HGVSp Short | SWISSPROT | BIOTYPE | SIFT | PolyPhen | Tumor Sample Barcode | Tissue | Histology | Sex | Age | Stage | Therapy Types | Drugs | Outcome |
| SCYL1 | SNV | Missense_Mutation | c.379N>T | p.Ala127Ser | p.A127S | Q96KG9 | protein_coding | deleterious(0.01) | possibly_damaging(0.897) | TCGA-AO-A128-01 | Breast | breast invasive carcinoma | Female | <65 | I/II | Chemotherapy | doxorubicin | SD | |
| SCYL1 | SNV | Missense_Mutation | novel | c.1100N>C | p.Ile367Thr | p.I367T | Q96KG9 | protein_coding | deleterious(0.03) | benign(0.031) | TCGA-D8-A1XK-01 | Breast | breast invasive carcinoma | Female | <65 | I/II | Chemotherapy | doxorubicine+cyclophosphamide | SD |
| SCYL1 | SNV | Missense_Mutation | novel | c.640N>A | p.Glu214Lys | p.E214K | Q96KG9 | protein_coding | deleterious(0) | probably_damaging(0.99) | TCGA-2W-A8YY-01 | Cervix | cervical & endocervical cancer | Female | <65 | I/II | Chemotherapy | cisplatin | CR |
| SCYL1 | SNV | Missense_Mutation | c.2141C>T | p.Pro714Leu | p.P714L | Q96KG9 | protein_coding | deleterious(0.03) | benign(0.006) | TCGA-A6-5661-01 | Colorectum | colon adenocarcinoma | Female | >=65 | I/II | Unknown | Unknown | SD | |
| SCYL1 | SNV | Missense_Mutation | novel | c.1415T>C | p.Phe472Ser | p.F472S | Q96KG9 | protein_coding | deleterious(0) | probably_damaging(0.994) | TCGA-AA-3664-01 | Colorectum | colon adenocarcinoma | Female | >=65 | I/II | Unknown | Unknown | SD |
| SCYL1 | SNV | Missense_Mutation | rs377549319 | c.1622C>T | p.Ser541Leu | p.S541L | Q96KG9 | protein_coding | deleterious(0) | probably_damaging(0.991) | TCGA-AA-3864-01 | Colorectum | colon adenocarcinoma | Male | >=65 | I/II | Unknown | Unknown | SD |
| SCYL1 | SNV | Missense_Mutation | rs370701660 | c.2327G>A | p.Arg776Gln | p.R776Q | Q96KG9 | protein_coding | deleterious(0.01) | benign(0.289) | TCGA-AA-3947-01 | Colorectum | colon adenocarcinoma | Female | <65 | I/II | Unknown | Unknown | SD |
| SCYL1 | SNV | Missense_Mutation | novel | c.670G>A | p.Ala224Thr | p.A224T | Q96KG9 | protein_coding | tolerated(0.19) | benign(0) | TCGA-AZ-4315-01 | Colorectum | colon adenocarcinoma | Male | <65 | I/II | Unknown | Unknown | SD |
| SCYL1 | SNV | Missense_Mutation | c.520C>T | p.Pro174Ser | p.P174S | Q96KG9 | protein_coding | tolerated(0.05) | probably_damaging(0.942) | TCGA-CK-4951-01 | Colorectum | colon adenocarcinoma | Female | >=65 | I/II | Unknown | Unknown | PD | |
| SCYL1 | SNV | Missense_Mutation | rs766077898 | c.1096N>T | p.Arg366Cys | p.R366C | Q96KG9 | protein_coding | deleterious(0) | possibly_damaging(0.907) | TCGA-WS-AB45-01 | Colorectum | colon adenocarcinoma | Female | <65 | I/II | Unknown | Unknown | SD |
| Page: 1 2 3 4 5 6 7 |
Top |
Related drugs of malignant transformation related genes |
| Identification of chemicals and drugs interact with genes involved in malignant transfromation |
| (DGIdb 4.0) |
| Entrez ID | Symbol | Category | Interaction Types | Drug Claim Name | Drug Name | PMIDs |
| Page: 1 |

Copyright 2023-Present -The University of Texas Health Science Center at Houston |