
|
|||||
|
 | |
| |
| |
| |
| |
| |
|
Gene: SCUBE2 |
Gene summary for SCUBE2 |
| Gene information | Species | Human | Gene symbol | SCUBE2 | Gene ID | 57758 |
| Gene name | signal peptide, CUB domain and EGF like domain containing 2 | |
| Gene Alias | CEGB1 | |
| Cytomap | 11p15.4 | |
| Gene Type | protein-coding | GO ID | GO:0007154 | UniProtAcc | Q9NQ36 |
Top |
Malignant transformation analysis |
| Identification of the aberrant gene expression in precancerous and cancerous lesions by comparing the gene expression of stem-like cells in diseased tissues with normal stem cells |
| Entrez ID | Symbol | Replicates | Species | Organ | Tissue | Adj P-value | Log2FC | Malignancy |
| 57758 | SCUBE2 | GSM4909302 | Human | Breast | IDC | 4.53e-03 | 2.79e-01 | 0.1545 |
| 57758 | SCUBE2 | GSM4909304 | Human | Breast | IDC | 5.67e-08 | 2.99e-01 | 0.1636 |
| 57758 | SCUBE2 | GSM4909306 | Human | Breast | IDC | 1.18e-16 | 5.11e-01 | 0.1564 |
| 57758 | SCUBE2 | GSM4909307 | Human | Breast | IDC | 1.48e-15 | 4.84e-01 | 0.1569 |
| 57758 | SCUBE2 | GSM4909308 | Human | Breast | IDC | 1.08e-44 | 7.79e-01 | 0.158 |
| 57758 | SCUBE2 | GSM4909311 | Human | Breast | IDC | 4.55e-02 | 2.03e-01 | 0.1534 |
| 57758 | SCUBE2 | GSM4909312 | Human | Breast | IDC | 1.59e-06 | 3.43e-01 | 0.1552 |
| 57758 | SCUBE2 | GSM4909321 | Human | Breast | IDC | 1.02e-03 | 3.02e-01 | 0.1559 |
| 57758 | SCUBE2 | NCCBC3 | Human | Breast | DCIS | 3.41e-09 | 3.64e-01 | 0.1198 |
| 57758 | SCUBE2 | P3 | Human | Breast | IDC | 7.78e-16 | 8.94e-01 | 0.1542 |
| 57758 | SCUBE2 | GSM5252128_BPH327PrGF_Via | Human | Prostate | BPH | 4.42e-06 | 3.65e-01 | -0.1688 |
| 57758 | SCUBE2 | GSM5252130_BPH340PrGF_Via | Human | Prostate | BPH | 1.59e-08 | 7.82e-01 | -0.1972 |
| 57758 | SCUBE2 | GSM5252131_BPH340PrSF_Via | Human | Prostate | BPH | 4.36e-23 | 1.04e+00 | -0.2126 |
| 57758 | SCUBE2 | GSM5252135_BPH511PrPUr_Fcol_3GEX | Human | Prostate | BPH | 2.29e-08 | 6.18e-01 | -0.1833 |
| 57758 | SCUBE2 | GSM5252137_BPH556PrGA2_Fcol | Human | Prostate | BPH | 4.04e-08 | 7.75e-01 | -0.23 |
| 57758 | SCUBE2 | 047563_1562-all-cells | Human | Prostate | BPH | 4.23e-05 | -1.32e-01 | 0.0791 |
| 57758 | SCUBE2 | 048752_1579-all-cells | Human | Prostate | BPH | 1.47e-02 | 3.06e-01 | 0.1008 |
| 57758 | SCUBE2 | 052095_1628-all-cells | Human | Prostate | BPH | 3.66e-19 | 6.50e-01 | 0.1032 |
| 57758 | SCUBE2 | 052099_1652-all-cells | Human | Prostate | BPH | 2.87e-11 | 4.57e-01 | 0.1038 |
| 57758 | SCUBE2 | Dong_P1 | Human | Prostate | Tumor | 3.22e-08 | 1.36e-01 | 0.035 |
| Page: 1 2 |
| Tissue | Expression Dynamics | Abbreviation |
| Breast | 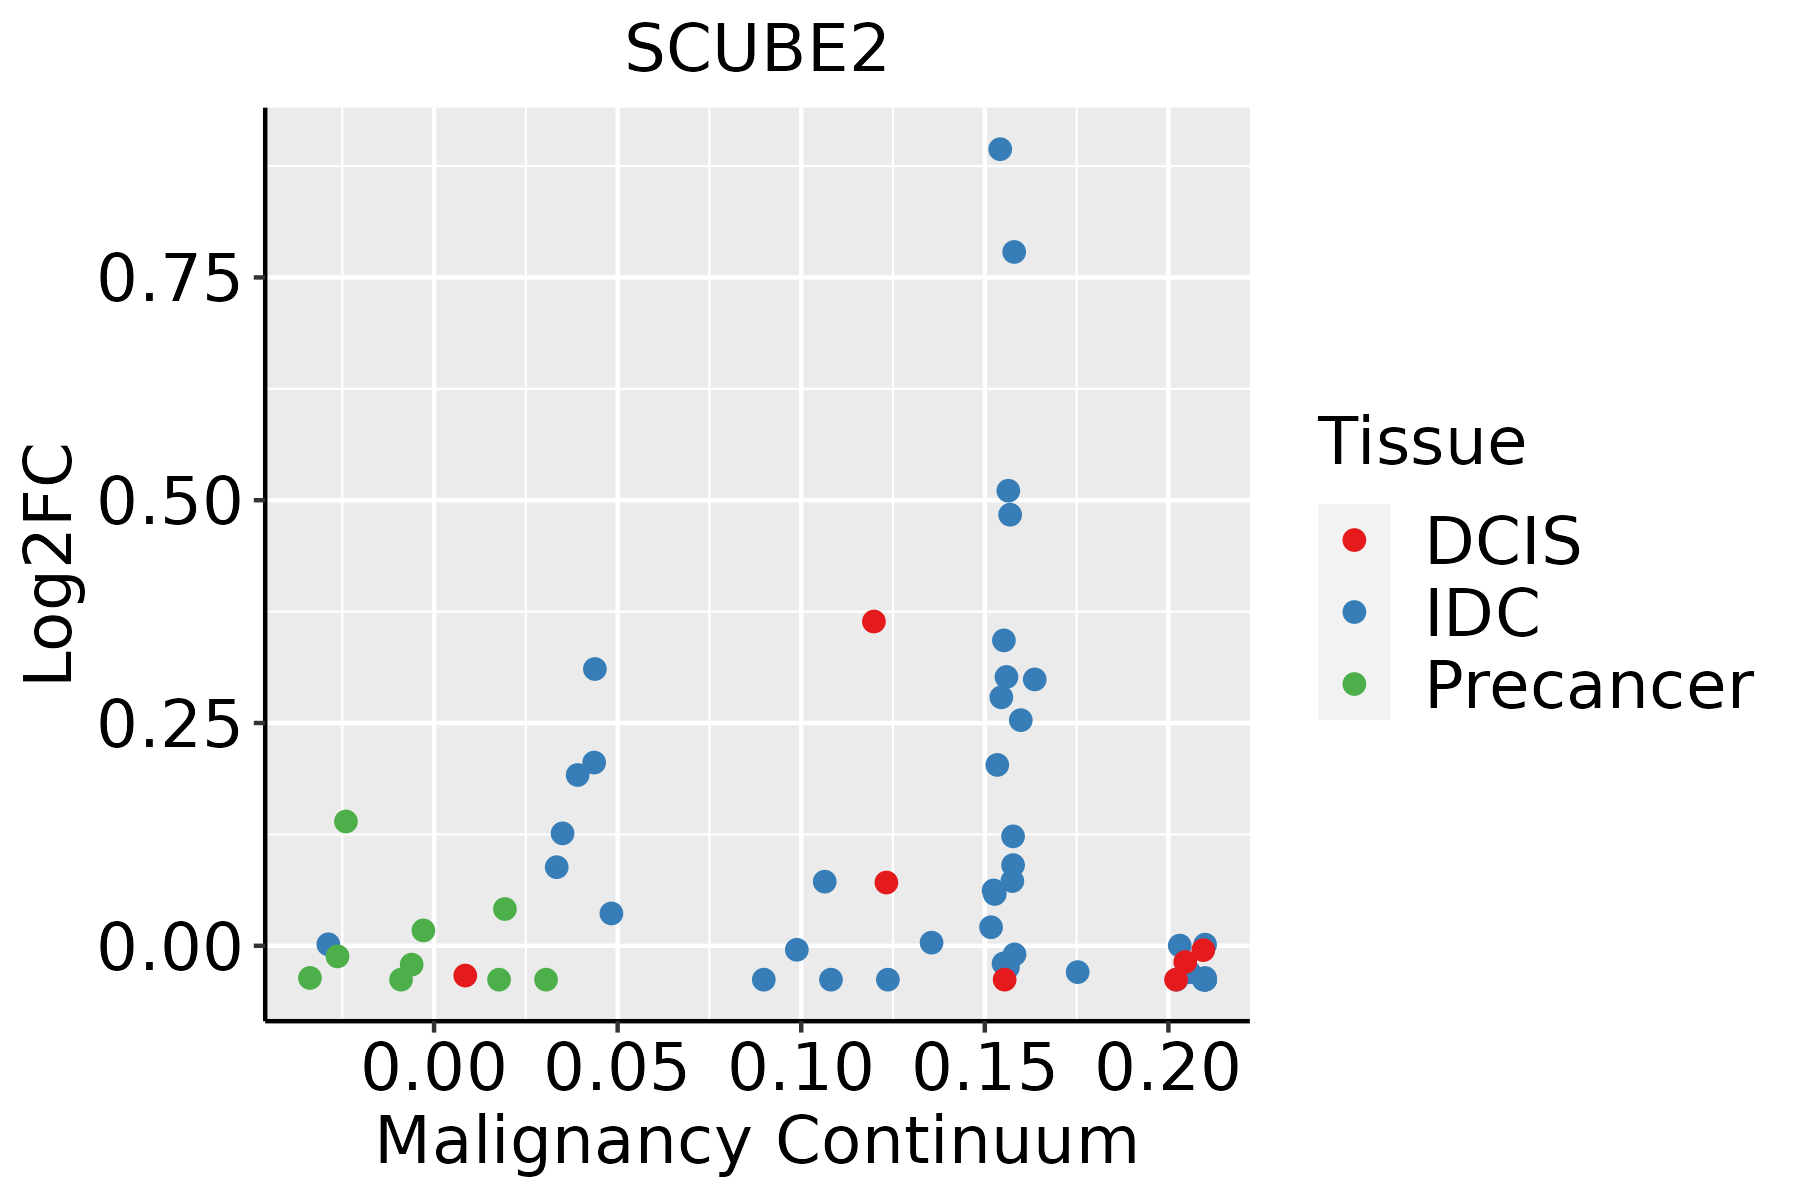 | IDC: Invasive ductal carcinoma |
| DCIS: Ductal carcinoma in situ | ||
| Precancer(BRCA1-mut): Precancerous lesion from BRCA1 mutation carriers | ||
| Prostate | 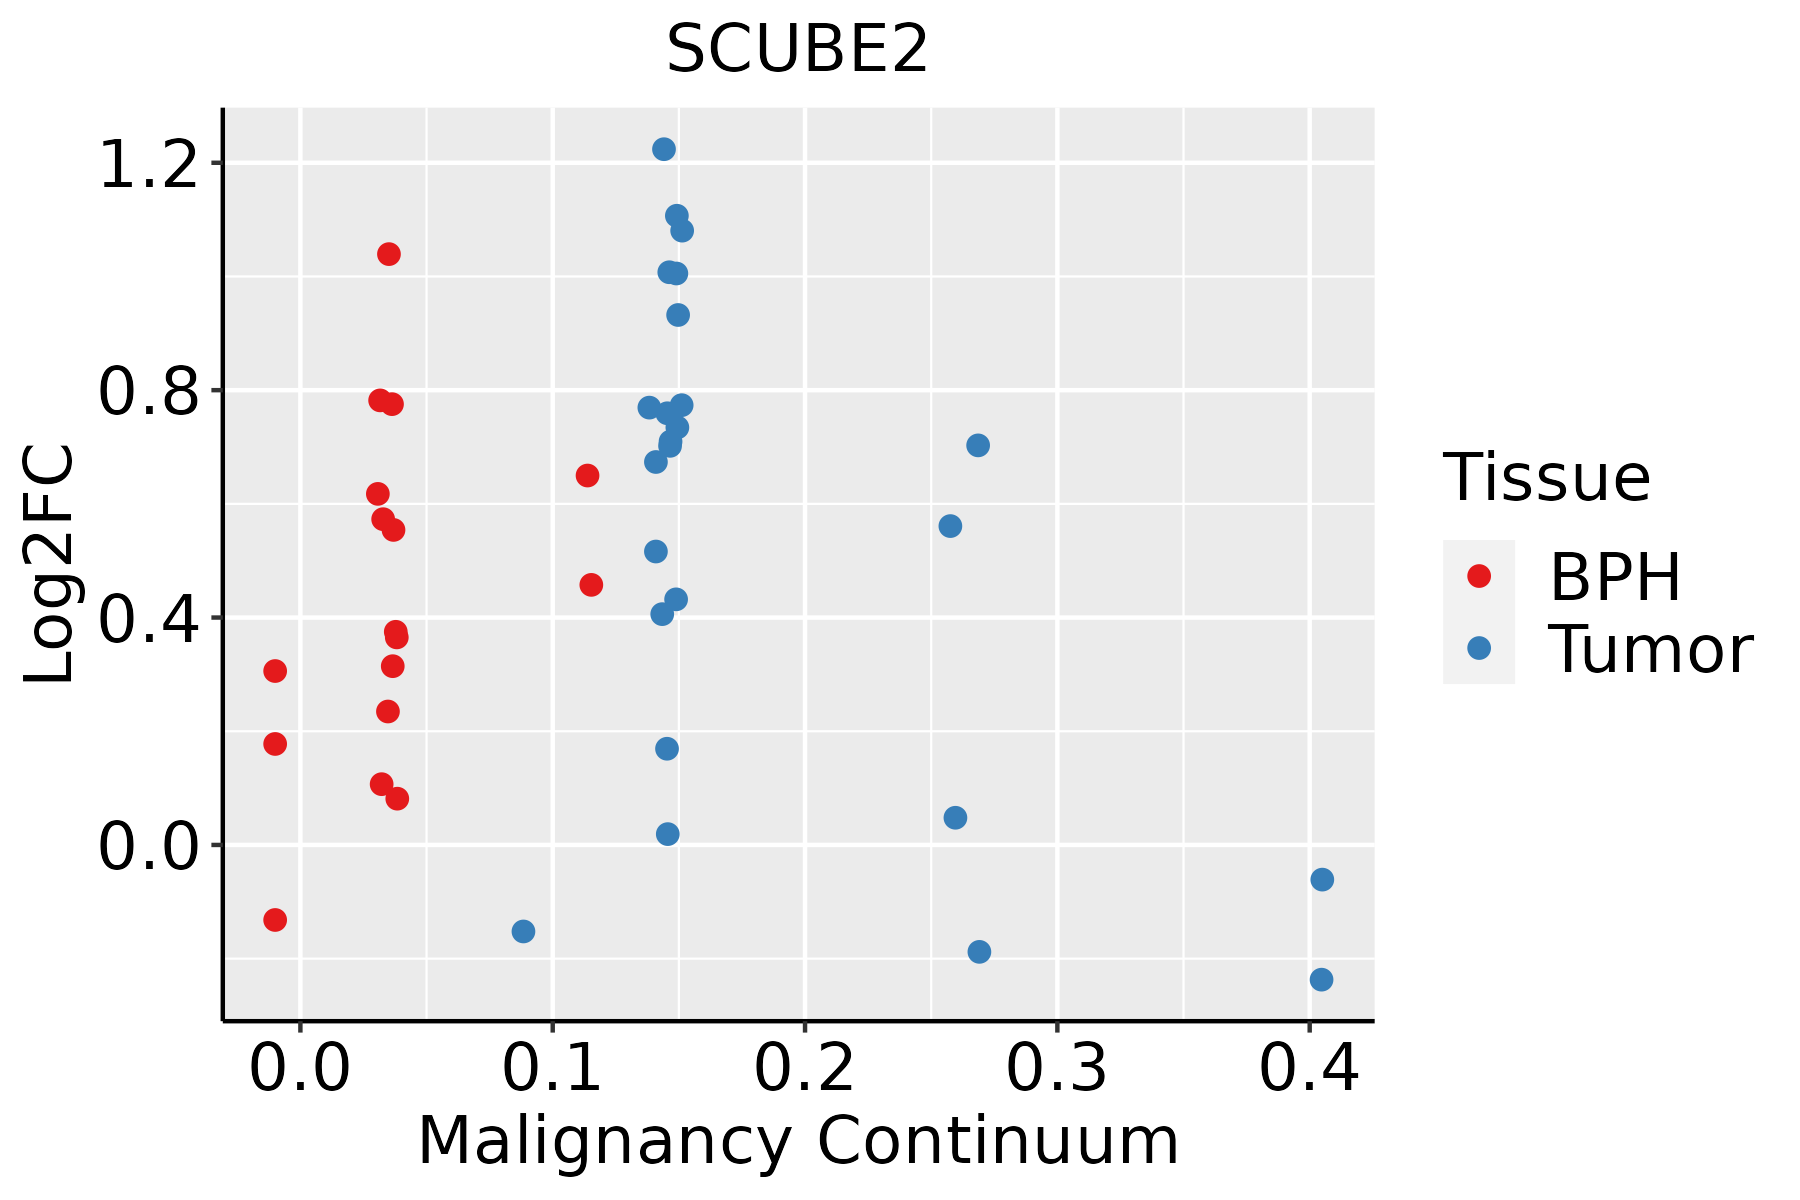 | BPH: Benign Prostatic Hyperplasia |
| ∗log2FC in expression of this searched gene in stem-like cells from each diseased tissue sample relative to stem-like cells in normal samples in each tissue plotted against the malignancy continuum. Samples are colored based on if they are from different disease stage. |
Top |
Malignant transformation related pathway analysis |
| Find out the enriched GO biological processes and KEGG pathways involved in transition from healthy to precancer to cancer |
| Tissue | Disease Stage | Enriched GO biological Processes |
| Colorectum | AD |  |
| Colorectum | SER |  |
| Colorectum | MSS |  |
| Colorectum | MSI-H |  |
| Colorectum | FAP |  |
| ∗Top 15 enriched GO BP terms are showed in the bar plot of each disease state in each tissue. Each row represents a significant GO biological process which is colored according to the -log10(p.adjust). |
| Page: 1 2 3 4 5 6 7 8 9 |
| GO ID | Tissue | Disease Stage | Description | Gene Ratio | Bg Ratio | pvalue | p.adjust | Count |
| Page: 1 |
| Pathway ID | Tissue | Disease Stage | Description | Gene Ratio | Bg Ratio | pvalue | p.adjust | qvalue | Count |
| Page: 1 |
Top |
Cell-cell communication analysis |
| Identification of potential cell-cell interactions between two cell types and their ligand-receptor pairs for different disease states |
| Ligand | Receptor | LRpair | Pathway | Tissue | Disease Stage |
| Page: 1 |
Top |
Single-cell gene regulatory network inference analysis |
| Find out the significant the regulons (TFs) and the target genes of each regulon across cell types for different disease states |
| TF | Cell Type | Tissue | Disease Stage | Target Gene | RSS | Regulon Activity |
| ∗The dot plots of a searched regulon are shown for all cell subpopulations in each disease state of each tissue based on the regulon specific score inferred using pySCENIC and by calculating the average expression. |
| Page: 1 |
Top |
Somatic mutation of malignant transformation related genes |
| Annotation of somatic variants for genes involved in malignant transformation |
| Hugo Symbol | Variant Class | Variant Classification | dbSNP RS | HGVSc | HGVSp | HGVSp Short | SWISSPROT | BIOTYPE | SIFT | PolyPhen | Tumor Sample Barcode | Tissue | Histology | Sex | Age | Stage | Therapy Types | Drugs | Outcome |
| SCUBE2 | SNV | Missense_Mutation | rs747651323 | c.697G>A | p.Asp233Asn | p.D233N | Q9NQ36 | protein_coding | tolerated(0.49) | benign(0.027) | TCGA-A8-A06Q-01 | Breast | breast invasive carcinoma | Female | <65 | III/IV | Unknown | Unknown | SD |
| SCUBE2 | SNV | Missense_Mutation | novel | c.1744N>A | p.Glu582Lys | p.E582K | Q9NQ36 | protein_coding | deleterious(0.05) | benign(0.355) | TCGA-AN-A046-01 | Breast | breast invasive carcinoma | Female | >=65 | I/II | Unknown | Unknown | SD |
| SCUBE2 | SNV | Missense_Mutation | rs757661901 | c.2781N>T | p.Glu927Asp | p.E927D | Q9NQ36 | protein_coding | tolerated(0.23) | probably_damaging(0.995) | TCGA-C8-A274-01 | Breast | breast invasive carcinoma | Female | <65 | I/II | Hormone Therapy | tamoxiphen | SD |
| SCUBE2 | SNV | Missense_Mutation | c.2408N>G | p.Gln803Arg | p.Q803R | Q9NQ36 | protein_coding | deleterious(0) | benign(0.272) | TCGA-D8-A1XK-01 | Breast | breast invasive carcinoma | Female | <65 | I/II | Chemotherapy | doxorubicine+cyclophosphamide | SD | |
| SCUBE2 | SNV | Missense_Mutation | c.2648N>T | p.Cys883Phe | p.C883F | Q9NQ36 | protein_coding | deleterious(0) | probably_damaging(0.945) | TCGA-D8-A27M-01 | Breast | breast invasive carcinoma | Female | <65 | I/II | Chemotherapy | methotrexate+5 | SD | |
| SCUBE2 | SNV | Missense_Mutation | rs761718889 | c.2962N>T | p.Arg988Cys | p.R988C | Q9NQ36 | protein_coding | deleterious(0) | probably_damaging(0.944) | TCGA-E9-A247-01 | Breast | breast invasive carcinoma | Female | <65 | I/II | Hormone Therapy | tamoxiphen | SD |
| SCUBE2 | insertion | Nonsense_Mutation | novel | c.1978_1979insATCTGAATGGTGATTTATATCTGATGGCCACGGCAGAGTGAAGAC | p.Gly660delinsAspLeuAsnGlyAspLeuTyrLeuMetAlaThrAlaGluTerArgArg | p.G660delinsDLNGDLYLMATAE*RR | Q9NQ36 | protein_coding | TCGA-A2-A0CP-01 | Breast | breast invasive carcinoma | Female | <65 | I/II | Chemotherapy | cytoxan | SD | ||
| SCUBE2 | insertion | Frame_Shift_Ins | novel | c.1339_1340insA | p.Gly447GlufsTer17 | p.G447Efs*17 | Q9NQ36 | protein_coding | TCGA-A8-A08H-01 | Breast | breast invasive carcinoma | Female | >=65 | I/II | Unknown | Unknown | SD | ||
| SCUBE2 | insertion | In_Frame_Ins | novel | c.1337_1338insAAATGACTTCATGTTCTATTTCACCGT | p.Lys446_Gly447insAsnAspPheMetPheTyrPheThrVal | p.K446_G447insNDFMFYFTV | Q9NQ36 | protein_coding | TCGA-A8-A08H-01 | Breast | breast invasive carcinoma | Female | >=65 | I/II | Unknown | Unknown | SD | ||
| SCUBE2 | insertion | Nonsense_Mutation | novel | c.352_353insGAACTTAGAAGCAGCTAGCAGCTGCATGGGGTTGAGT | p.Met118ArgfsTer3 | p.M118Rfs*3 | Q9NQ36 | protein_coding | TCGA-BH-A0EB-01 | Breast | breast invasive carcinoma | Female | >=65 | I/II | Hormone Therapy | arimidex | SD |
| Page: 1 2 3 4 5 6 7 8 9 10 |
Top |
Related drugs of malignant transformation related genes |
| Identification of chemicals and drugs interact with genes involved in malignant transfromation |
| (DGIdb 4.0) |
| Entrez ID | Symbol | Category | Interaction Types | Drug Claim Name | Drug Name | PMIDs |
| Page: 1 |

Copyright 2023-Present -The University of Texas Health Science Center at Houston |