
|
|||||
|
 | |
| |
| |
| |
| |
| |
|
Gene: SCTR |
Gene summary for SCTR |
| Gene information | Species | Human | Gene symbol | SCTR | Gene ID | 6344 |
| Gene name | secretin receptor | |
| Gene Alias | SR | |
| Cytomap | 2q14.2 | |
| Gene Type | protein-coding | GO ID | GO:0002021 | UniProtAcc | P47872 |
Top |
Malignant transformation analysis |
| Identification of the aberrant gene expression in precancerous and cancerous lesions by comparing the gene expression of stem-like cells in diseased tissues with normal stem cells |
| Entrez ID | Symbol | Replicates | Species | Organ | Tissue | Adj P-value | Log2FC | Malignancy |
| 6344 | SCTR | RNA-P25T1-P25T1-1 | Human | Lung | AIS | 3.24e-13 | 7.76e-01 | -0.2116 |
| 6344 | SCTR | RNA-P25T1-P25T1-2 | Human | Lung | AIS | 5.19e-07 | 7.82e-01 | -0.1941 |
| 6344 | SCTR | RNA-P25T1-P25T1-3 | Human | Lung | AIS | 1.07e-10 | 9.31e-01 | -0.2107 |
| 6344 | SCTR | RNA-P25T1-P25T1-4 | Human | Lung | AIS | 4.16e-18 | 8.99e-01 | -0.2119 |
| 6344 | SCTR | RNA-P6T2-P6T2-1 | Human | Lung | IAC | 1.82e-26 | 9.36e-01 | -0.0166 |
| 6344 | SCTR | RNA-P6T2-P6T2-2 | Human | Lung | IAC | 7.46e-34 | 1.01e+00 | -0.0132 |
| 6344 | SCTR | RNA-P6T2-P6T2-3 | Human | Lung | IAC | 3.47e-26 | 9.33e-01 | -0.013 |
| 6344 | SCTR | RNA-P6T2-P6T2-4 | Human | Lung | IAC | 1.05e-29 | 9.75e-01 | -0.0121 |
| 6344 | SCTR | RNA-P7T1-P7T1-1 | Human | Lung | AIS | 1.47e-11 | 1.00e+00 | -0.0961 |
| 6344 | SCTR | RNA-P7T1-P7T1-2 | Human | Lung | AIS | 5.68e-14 | 9.44e-01 | -0.0876 |
| 6344 | SCTR | RNA-P7T1-P7T1-3 | Human | Lung | AIS | 1.85e-08 | 9.04e-01 | -0.0822 |
| 6344 | SCTR | RNA-P7T1-P7T1-4 | Human | Lung | AIS | 1.13e-09 | 8.45e-01 | -0.0809 |
| 6344 | SCTR | RNA-P8T2-P8T2-3 | Human | Lung | AIS | 1.03e-03 | 1.15e+00 | -0.1284 |
| 6344 | SCTR | HTA12-23-1 | Human | Pancreas | PDAC | 4.62e-07 | 7.50e-01 | 0.3405 |
| 6344 | SCTR | HTA12-26-1 | Human | Pancreas | PDAC | 1.22e-03 | 3.14e-01 | 0.3728 |
| 6344 | SCTR | HTA12-29-1 | Human | Pancreas | PDAC | 1.75e-27 | 6.32e-01 | 0.3722 |
| Page: 1 |
| Tissue | Expression Dynamics | Abbreviation |
| Lung | 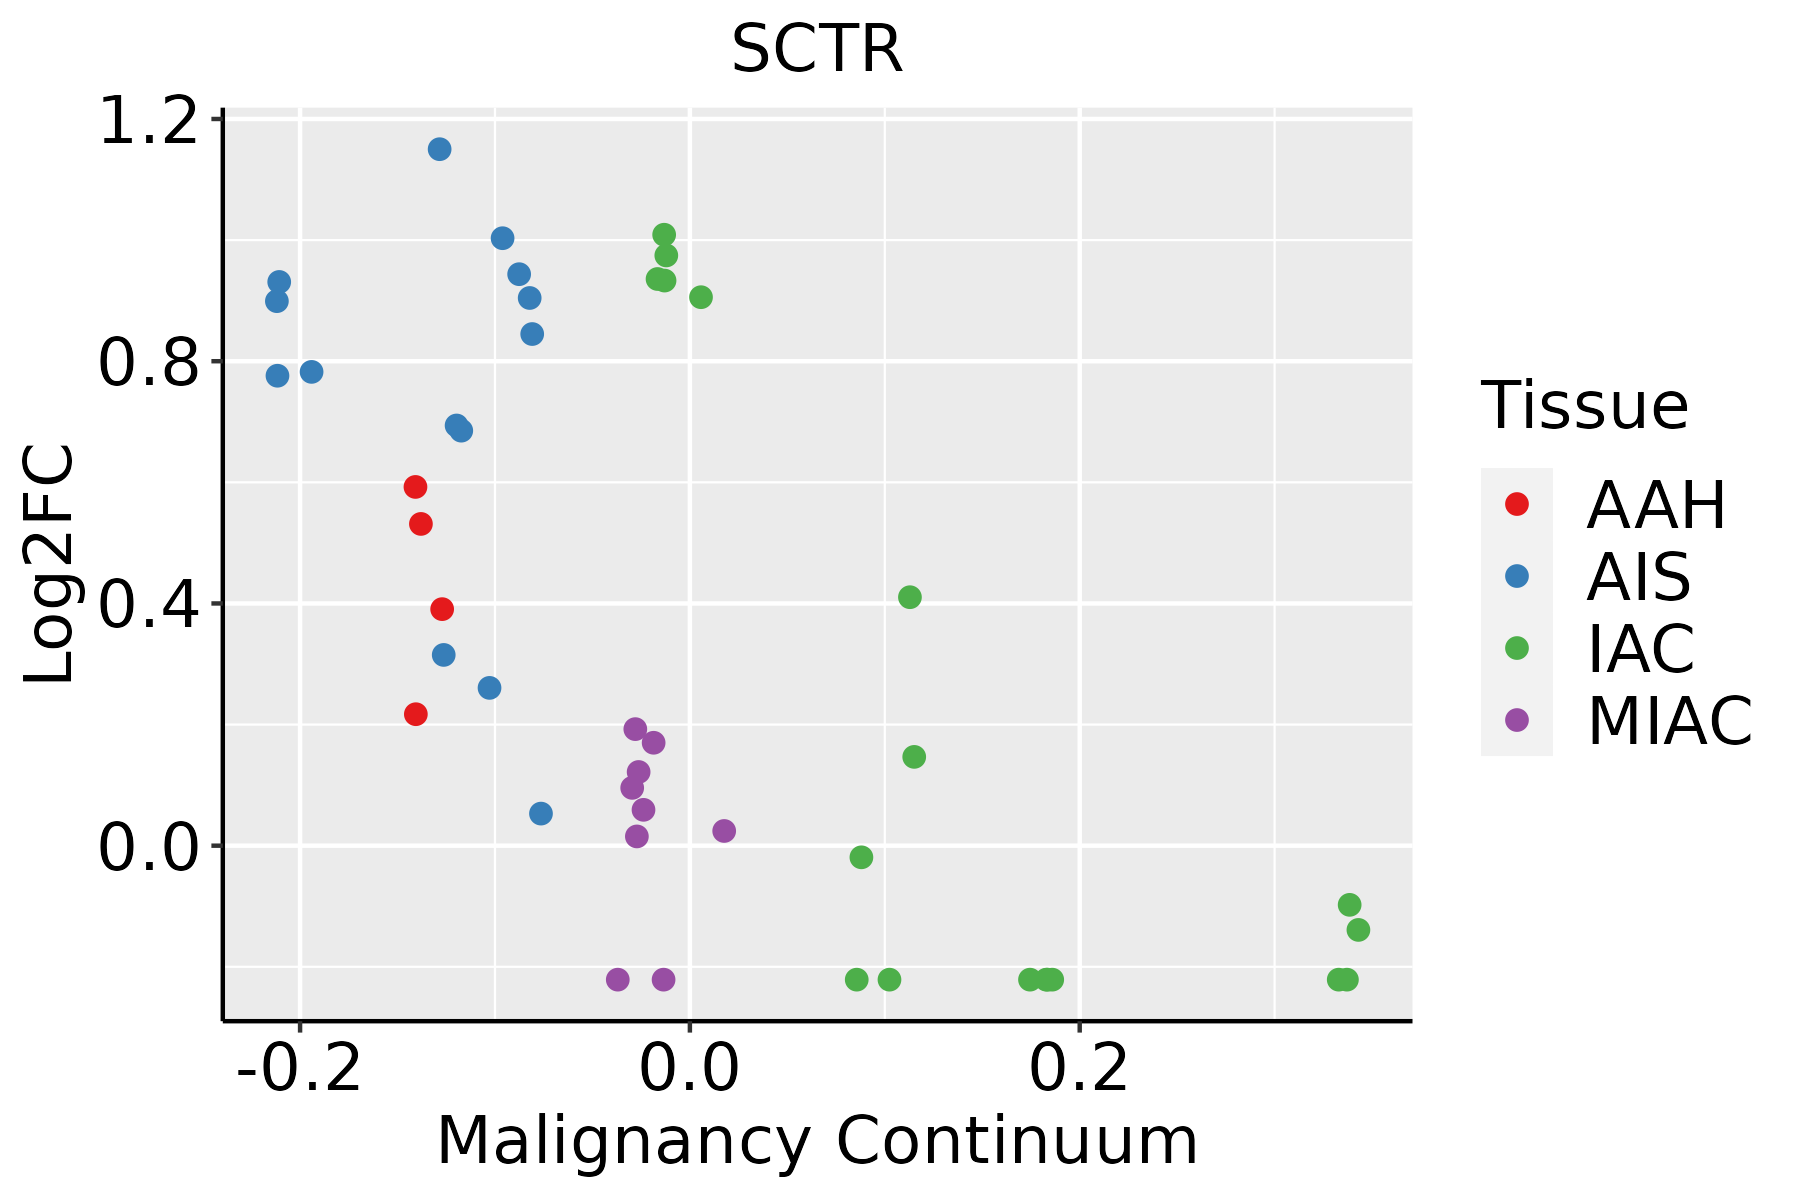 | AAH: Atypical adenomatous hyperplasia |
| AIS: Adenocarcinoma in situ | ||
| IAC: Invasive lung adenocarcinoma | ||
| MIA: Minimally invasive adenocarcinoma |
| ∗log2FC in expression of this searched gene in stem-like cells from each diseased tissue sample relative to stem-like cells in normal samples in each tissue plotted against the malignancy continuum. Samples are colored based on if they are from different disease stage. |
Top |
Malignant transformation related pathway analysis |
| Find out the enriched GO biological processes and KEGG pathways involved in transition from healthy to precancer to cancer |
| Tissue | Disease Stage | Enriched GO biological Processes |
| Colorectum | AD |  |
| Colorectum | SER |  |
| Colorectum | MSS |  |
| Colorectum | MSI-H |  |
| Colorectum | FAP |  |
| ∗Top 15 enriched GO BP terms are showed in the bar plot of each disease state in each tissue. Each row represents a significant GO biological process which is colored according to the -log10(p.adjust). |
| Page: 1 2 3 4 5 6 7 8 9 |
| GO ID | Tissue | Disease Stage | Description | Gene Ratio | Bg Ratio | pvalue | p.adjust | Count |
| GO:00325357 | Lung | IAC | regulation of cellular component size | 65/2061 | 383/18723 | 2.56e-04 | 4.26e-03 | 65 |
| GO:00316678 | Lung | IAC | response to nutrient levels | 76/2061 | 474/18723 | 4.87e-04 | 7.08e-03 | 76 |
| GO:00083615 | Lung | IAC | regulation of cell size | 33/2061 | 181/18723 | 2.47e-03 | 2.33e-02 | 33 |
| GO:003253513 | Lung | AIS | regulation of cellular component size | 56/1849 | 383/18723 | 1.83e-03 | 2.05e-02 | 56 |
| GO:0030104 | Lung | AIS | water homeostasis | 14/1849 | 64/18723 | 3.36e-03 | 3.20e-02 | 14 |
| GO:0019932 | Lung | AIS | second-messenger-mediated signaling | 46/1849 | 312/18723 | 3.79e-03 | 3.52e-02 | 46 |
| GO:003166713 | Lung | AIS | response to nutrient levels | 64/1849 | 474/18723 | 6.13e-03 | 4.98e-02 | 64 |
| Page: 1 |
| Pathway ID | Tissue | Disease Stage | Description | Gene Ratio | Bg Ratio | pvalue | p.adjust | qvalue | Count |
| Page: 1 |
Top |
Cell-cell communication analysis |
| Identification of potential cell-cell interactions between two cell types and their ligand-receptor pairs for different disease states |
| Ligand | Receptor | LRpair | Pathway | Tissue | Disease Stage |
| SCT | SCTR | SCT_SCTR | SCT | Lung | AAH |
| SCT | SCTR | SCT_SCTR | SCT | Lung | AIS |
| SCT | SCTR | SCT_SCTR | SCT | Lung | IAC |
| SCT | SCTR | SCT_SCTR | SCT | Lung | Precancer |
| Page: 1 |
Top |
Single-cell gene regulatory network inference analysis |
| Find out the significant the regulons (TFs) and the target genes of each regulon across cell types for different disease states |
| TF | Cell Type | Tissue | Disease Stage | Target Gene | RSS | Regulon Activity |
| ∗The dot plots of a searched regulon are shown for all cell subpopulations in each disease state of each tissue based on the regulon specific score inferred using pySCENIC and by calculating the average expression. |
| Page: 1 |
Top |
Somatic mutation of malignant transformation related genes |
| Annotation of somatic variants for genes involved in malignant transformation |
| Hugo Symbol | Variant Class | Variant Classification | dbSNP RS | HGVSc | HGVSp | HGVSp Short | SWISSPROT | BIOTYPE | SIFT | PolyPhen | Tumor Sample Barcode | Tissue | Histology | Sex | Age | Stage | Therapy Types | Drugs | Outcome |
| SCTR | insertion | Nonsense_Mutation | novel | c.579_580insCTTTGATGTCATGCTTTATACCACATGGTTGCAAT | p.Ile194LeufsTer2 | p.I194Lfs*2 | P47872 | protein_coding | TCGA-AR-A0TY-01 | Breast | breast invasive carcinoma | Female | <65 | I/II | Unspecific | Paclitaxel | PD | ||
| SCTR | SNV | Missense_Mutation | rs779937018 | c.589N>A | p.Ala197Thr | p.A197T | P47872 | protein_coding | tolerated(0.55) | benign(0.313) | TCGA-AA-3672-01 | Colorectum | colon adenocarcinoma | Female | >=65 | III/IV | Unknown | Unknown | SD |
| SCTR | SNV | Missense_Mutation | c.244N>A | p.Gly82Ser | p.G82S | P47872 | protein_coding | deleterious(0.01) | probably_damaging(0.973) | TCGA-AA-3713-01 | Colorectum | colon adenocarcinoma | Male | >=65 | III/IV | Chemotherapy | 5-fluorouracil | PR | |
| SCTR | SNV | Missense_Mutation | c.404G>A | p.Arg135Gln | p.R135Q | P47872 | protein_coding | tolerated(0.98) | benign(0.001) | TCGA-AA-3864-01 | Colorectum | colon adenocarcinoma | Male | >=65 | I/II | Unknown | Unknown | SD | |
| SCTR | SNV | Missense_Mutation | c.612N>G | p.Asp204Glu | p.D204E | P47872 | protein_coding | tolerated(0.54) | benign(0.241) | TCGA-AA-A010-01 | Colorectum | colon adenocarcinoma | Female | <65 | I/II | Chemotherapy | folinic | CR | |
| SCTR | SNV | Missense_Mutation | novel | c.352A>G | p.Arg118Gly | p.R118G | P47872 | protein_coding | tolerated(0.64) | possibly_damaging(0.561) | TCGA-AD-5900-01 | Colorectum | colon adenocarcinoma | Male | >=65 | I/II | Unknown | Unknown | SD |
| SCTR | SNV | Missense_Mutation | novel | c.160N>G | p.Thr54Ala | p.T54A | P47872 | protein_coding | tolerated(0.59) | benign(0.001) | TCGA-CA-6717-01 | Colorectum | colon adenocarcinoma | Male | <65 | I/II | Chemotherapy | oxaliplatin | CR |
| SCTR | SNV | Missense_Mutation | rs748166802 | c.521N>A | p.Arg174His | p.R174H | P47872 | protein_coding | deleterious(0.01) | probably_damaging(1) | TCGA-EI-6513-01 | Colorectum | rectum adenocarcinoma | Male | <65 | III/IV | Unknown | Unknown | SD |
| SCTR | SNV | Missense_Mutation | rs762989197 | c.784N>A | p.Gly262Arg | p.G262R | P47872 | protein_coding | deleterious(0) | probably_damaging(1) | TCGA-AJ-A3BG-01 | Endometrium | uterine corpus endometrioid carcinoma | Female | >=65 | I/II | Chemotherapy | carboplatin | PD |
| SCTR | SNV | Missense_Mutation | rs762989197 | c.784N>A | p.Gly262Arg | p.G262R | P47872 | protein_coding | deleterious(0) | probably_damaging(1) | TCGA-AJ-A3EL-01 | Endometrium | uterine corpus endometrioid carcinoma | Female | <65 | I/II | Unknown | Unknown | SD |
| Page: 1 2 3 4 5 |
Top |
Related drugs of malignant transformation related genes |
| Identification of chemicals and drugs interact with genes involved in malignant transfromation |
| (DGIdb 4.0) |
| Entrez ID | Symbol | Category | Interaction Types | Drug Claim Name | Drug Name | PMIDs |
| 6344 | SCTR | G PROTEIN COUPLED RECEPTOR, DRUGGABLE GENOME | agonist | 135651884 | SECRETIN | |
| 6344 | SCTR | G PROTEIN COUPLED RECEPTOR, DRUGGABLE GENOME | SECRETIN | SECRETIN | ||
| 6344 | SCTR | G PROTEIN COUPLED RECEPTOR, DRUGGABLE GENOME | agonist | CHEMBL1201488 | SECRETIN SYNTHETIC HUMAN | |
| 6344 | SCTR | G PROTEIN COUPLED RECEPTOR, DRUGGABLE GENOME | agonist | 135651911 | VASOACTIVE INTESTINAL PEPTIDE | |
| 6344 | SCTR | G PROTEIN COUPLED RECEPTOR, DRUGGABLE GENOME | agonist | CHEMBL1201616 | SECRETIN SYNTHETIC PORCINE | |
| 6344 | SCTR | G PROTEIN COUPLED RECEPTOR, DRUGGABLE GENOME | SECRETIN | SECRETIN | ||
| 6344 | SCTR | G PROTEIN COUPLED RECEPTOR, DRUGGABLE GENOME | Secretin | SECRETIN | ||
| 6344 | SCTR | G PROTEIN COUPLED RECEPTOR, DRUGGABLE GENOME | agonist | CHEMBL3039582 | SECRETIN | |
| 6344 | SCTR | G PROTEIN COUPLED RECEPTOR, DRUGGABLE GENOME | antagonist | 178100608 | ||
| 6344 | SCTR | G PROTEIN COUPLED RECEPTOR, DRUGGABLE GENOME | RG1068 |
| Page: 1 |

Copyright 2023-Present -The University of Texas Health Science Center at Houston |