
|
|||||
|
 | |
| |
| |
| |
| |
| |
|
Gene: SCRN3 |
Gene summary for SCRN3 |
| Gene information | Species | Human | Gene symbol | SCRN3 | Gene ID | 79634 |
| Gene name | secernin 3 | |
| Gene Alias | SES3 | |
| Cytomap | 2q31.1 | |
| Gene Type | protein-coding | GO ID | GO:0006508 | UniProtAcc | Q0VDG4 |
Top |
Malignant transformation analysis |
| Identification of the aberrant gene expression in precancerous and cancerous lesions by comparing the gene expression of stem-like cells in diseased tissues with normal stem cells |
| Entrez ID | Symbol | Replicates | Species | Organ | Tissue | Adj P-value | Log2FC | Malignancy |
| 79634 | SCRN3 | LZE2T | Human | Esophagus | ESCC | 3.70e-05 | 6.21e-01 | 0.082 |
| 79634 | SCRN3 | LZE4T | Human | Esophagus | ESCC | 4.75e-09 | 3.50e-01 | 0.0811 |
| 79634 | SCRN3 | LZE7T | Human | Esophagus | ESCC | 1.64e-06 | 3.69e-01 | 0.0667 |
| 79634 | SCRN3 | LZE8T | Human | Esophagus | ESCC | 1.84e-04 | 1.70e-01 | 0.067 |
| 79634 | SCRN3 | LZE20T | Human | Esophagus | ESCC | 3.47e-04 | 2.20e-01 | 0.0662 |
| 79634 | SCRN3 | LZE22T | Human | Esophagus | ESCC | 9.33e-04 | 3.32e-01 | 0.068 |
| 79634 | SCRN3 | LZE24T | Human | Esophagus | ESCC | 7.30e-20 | 5.73e-01 | 0.0596 |
| 79634 | SCRN3 | P1T-E | Human | Esophagus | ESCC | 6.34e-10 | 3.68e-01 | 0.0875 |
| 79634 | SCRN3 | P2T-E | Human | Esophagus | ESCC | 1.27e-22 | 3.58e-01 | 0.1177 |
| 79634 | SCRN3 | P4T-E | Human | Esophagus | ESCC | 1.32e-28 | 6.51e-01 | 0.1323 |
| 79634 | SCRN3 | P5T-E | Human | Esophagus | ESCC | 3.56e-09 | 2.34e-01 | 0.1327 |
| 79634 | SCRN3 | P8T-E | Human | Esophagus | ESCC | 1.04e-15 | 3.92e-01 | 0.0889 |
| 79634 | SCRN3 | P9T-E | Human | Esophagus | ESCC | 1.51e-31 | 7.65e-01 | 0.1131 |
| 79634 | SCRN3 | P10T-E | Human | Esophagus | ESCC | 2.06e-10 | 2.77e-01 | 0.116 |
| 79634 | SCRN3 | P12T-E | Human | Esophagus | ESCC | 1.92e-41 | 7.24e-01 | 0.1122 |
| 79634 | SCRN3 | P15T-E | Human | Esophagus | ESCC | 3.45e-16 | 4.08e-01 | 0.1149 |
| 79634 | SCRN3 | P16T-E | Human | Esophagus | ESCC | 8.07e-22 | 3.88e-01 | 0.1153 |
| 79634 | SCRN3 | P17T-E | Human | Esophagus | ESCC | 2.91e-09 | 2.99e-01 | 0.1278 |
| 79634 | SCRN3 | P19T-E | Human | Esophagus | ESCC | 4.62e-02 | 2.19e-01 | 0.1662 |
| 79634 | SCRN3 | P20T-E | Human | Esophagus | ESCC | 1.98e-34 | 7.71e-01 | 0.1124 |
| Page: 1 2 3 4 |
| Tissue | Expression Dynamics | Abbreviation |
| Esophagus | 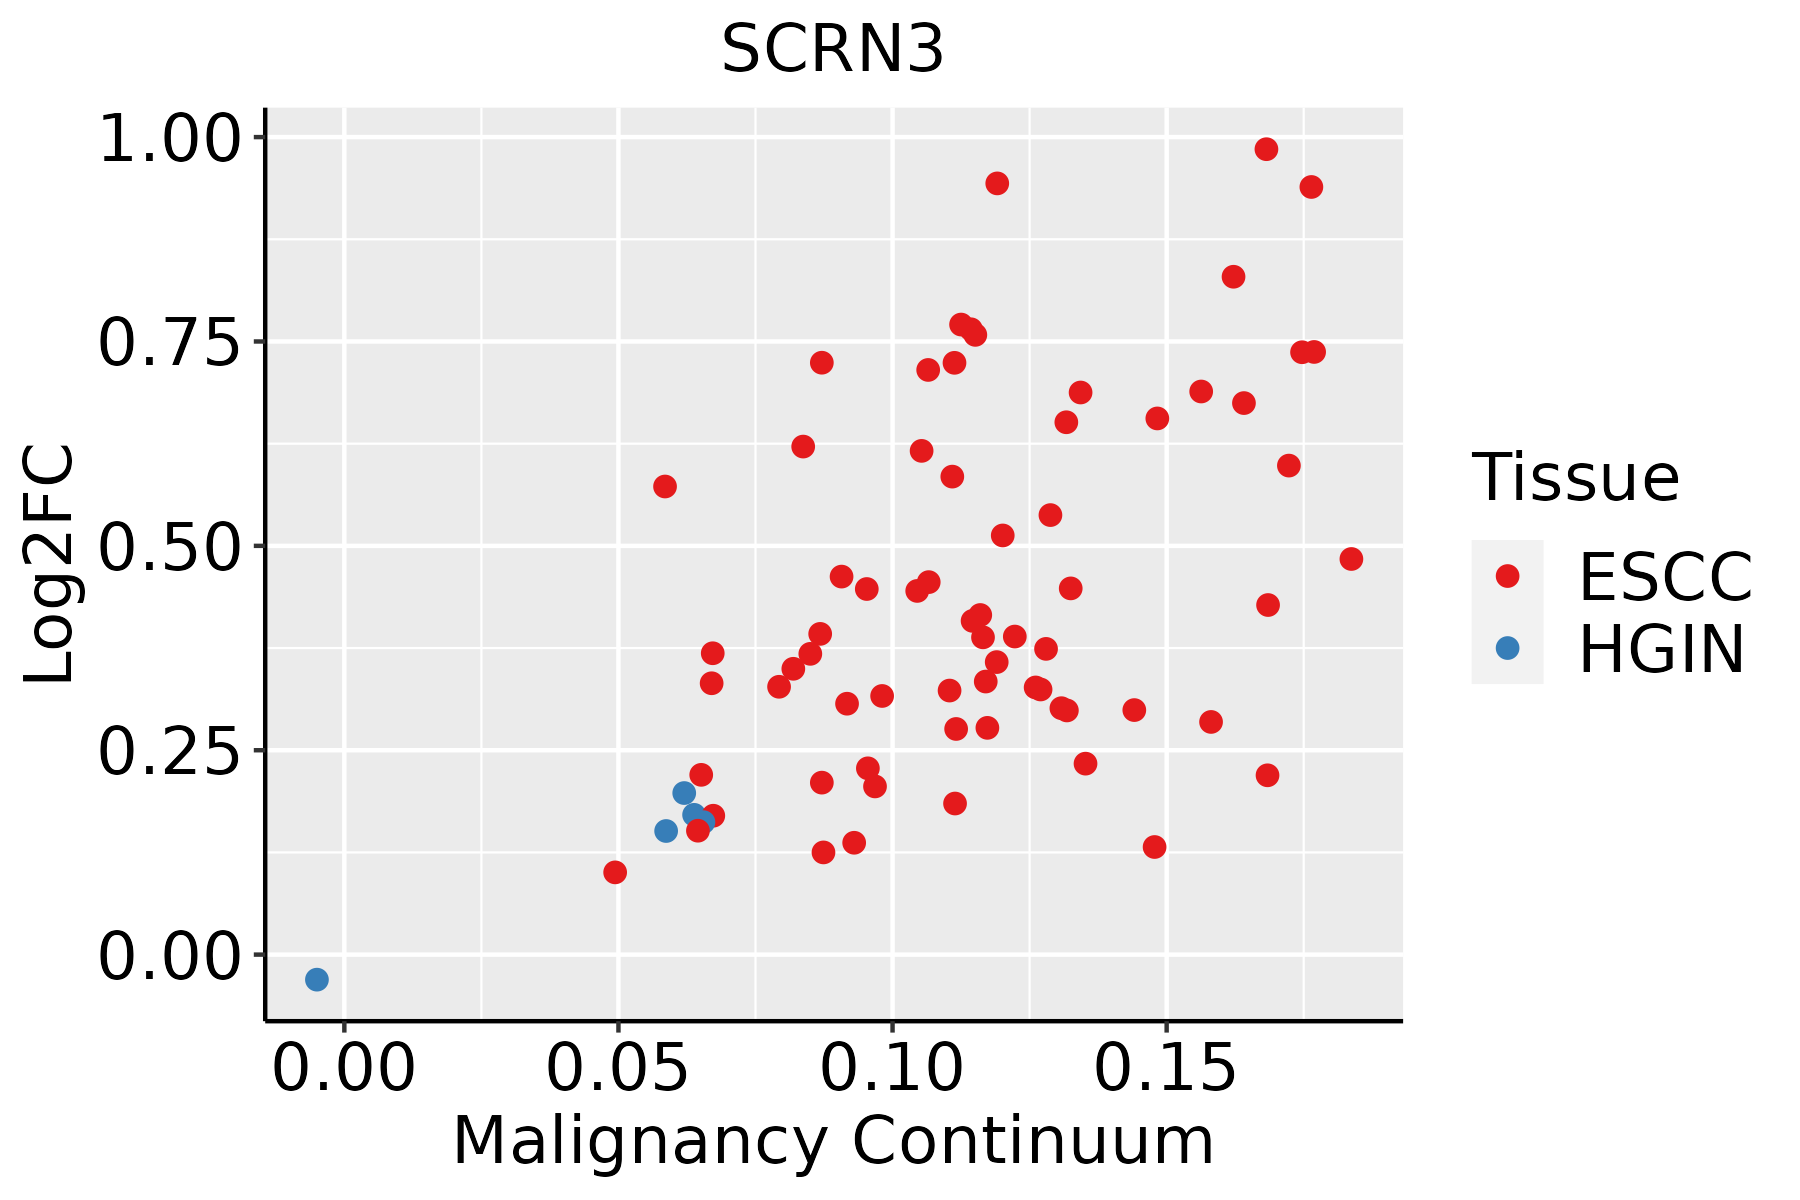 | ESCC: Esophageal squamous cell carcinoma |
| HGIN: High-grade intraepithelial neoplasias | ||
| LGIN: Low-grade intraepithelial neoplasias | ||
| Oral Cavity | 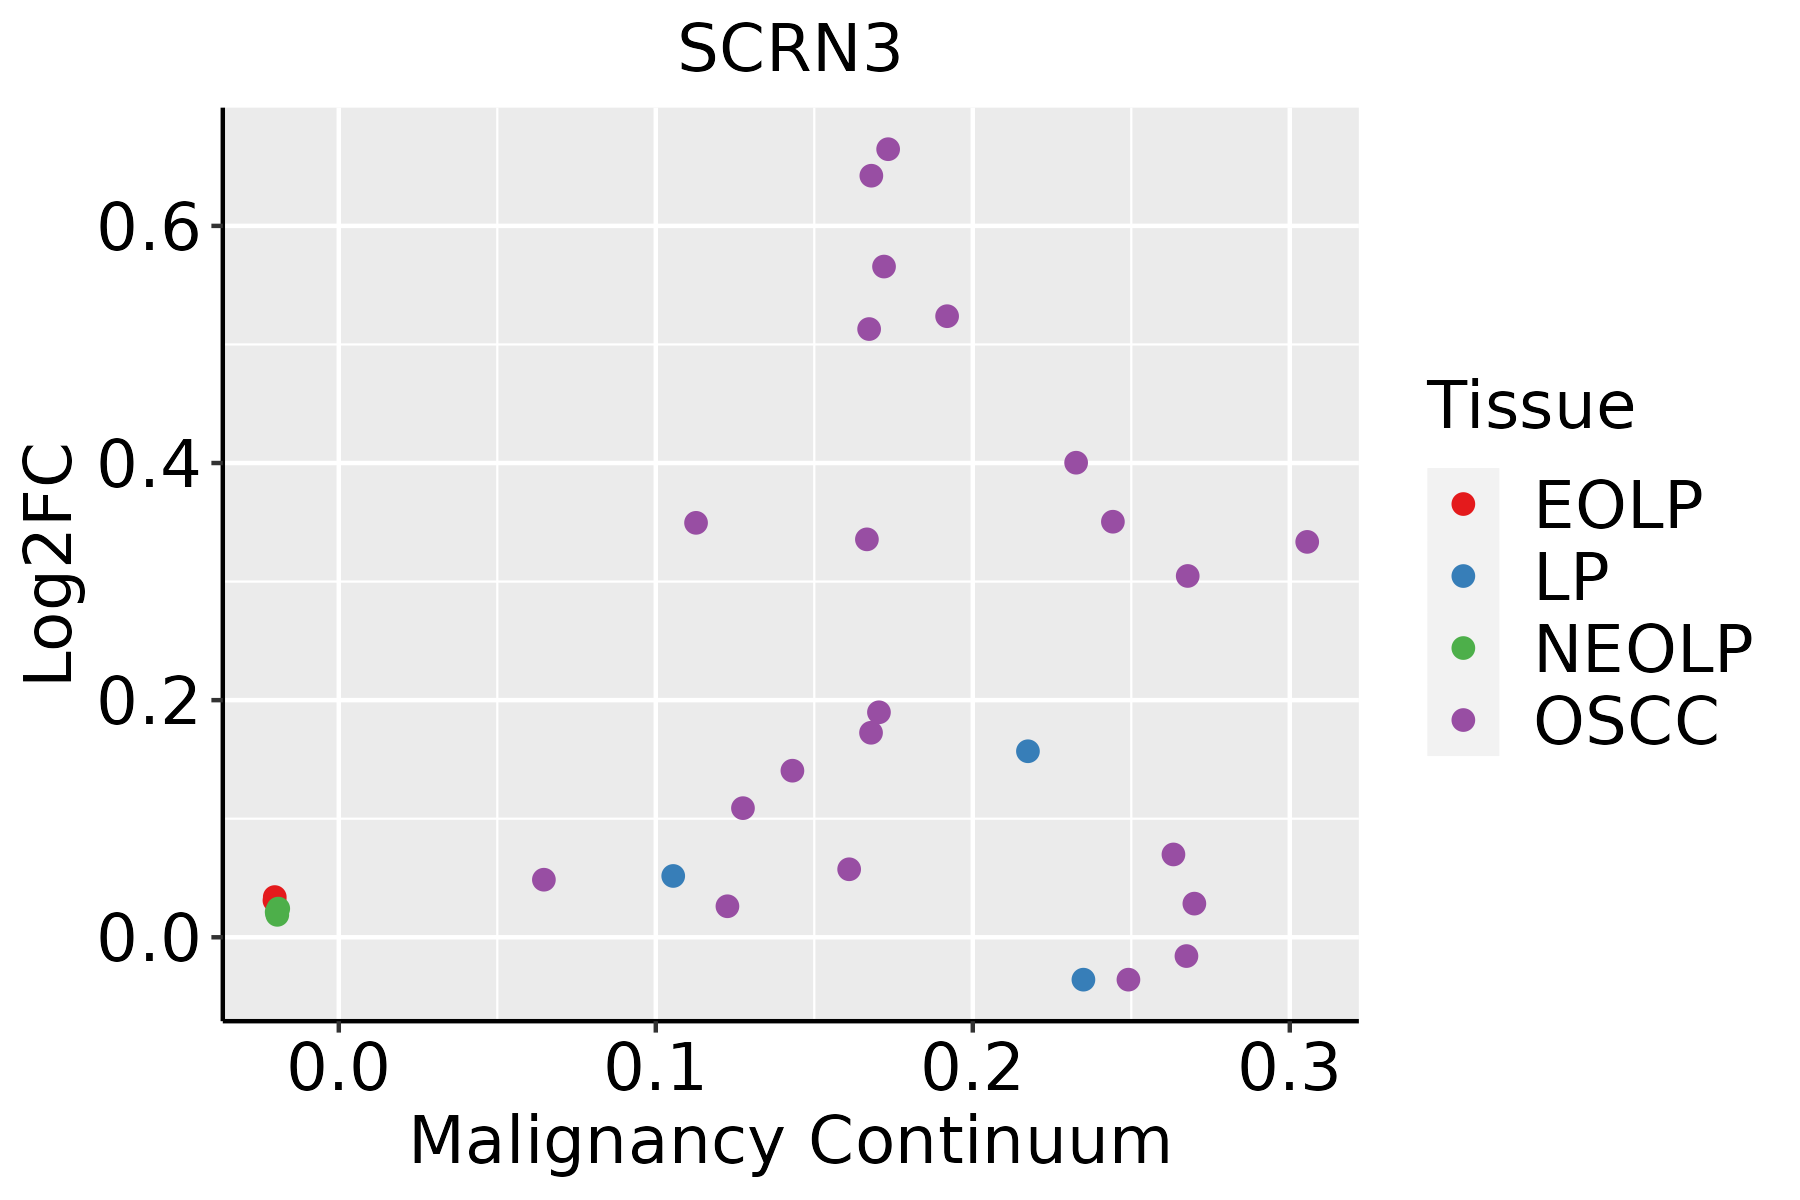 | EOLP: Erosive Oral lichen planus |
| LP: leukoplakia | ||
| NEOLP: Non-erosive oral lichen planus | ||
| OSCC: Oral squamous cell carcinoma |
| ∗log2FC in expression of this searched gene in stem-like cells from each diseased tissue sample relative to stem-like cells in normal samples in each tissue plotted against the malignancy continuum. Samples are colored based on if they are from different disease stage. |
Top |
Malignant transformation related pathway analysis |
| Find out the enriched GO biological processes and KEGG pathways involved in transition from healthy to precancer to cancer |
| Tissue | Disease Stage | Enriched GO biological Processes |
| Colorectum | AD |  |
| Colorectum | SER |  |
| Colorectum | MSS |  |
| Colorectum | MSI-H |  |
| Colorectum | FAP |  |
| ∗Top 15 enriched GO BP terms are showed in the bar plot of each disease state in each tissue. Each row represents a significant GO biological process which is colored according to the -log10(p.adjust). |
| Page: 1 2 3 4 5 6 7 8 9 |
| GO ID | Tissue | Disease Stage | Description | Gene Ratio | Bg Ratio | pvalue | p.adjust | Count |
| Page: 1 |
| Pathway ID | Tissue | Disease Stage | Description | Gene Ratio | Bg Ratio | pvalue | p.adjust | qvalue | Count |
| Page: 1 |
Top |
Cell-cell communication analysis |
| Identification of potential cell-cell interactions between two cell types and their ligand-receptor pairs for different disease states |
| Ligand | Receptor | LRpair | Pathway | Tissue | Disease Stage |
| Page: 1 |
Top |
Single-cell gene regulatory network inference analysis |
| Find out the significant the regulons (TFs) and the target genes of each regulon across cell types for different disease states |
| TF | Cell Type | Tissue | Disease Stage | Target Gene | RSS | Regulon Activity |
| ∗The dot plots of a searched regulon are shown for all cell subpopulations in each disease state of each tissue based on the regulon specific score inferred using pySCENIC and by calculating the average expression. |
| Page: 1 |
Top |
Somatic mutation of malignant transformation related genes |
| Annotation of somatic variants for genes involved in malignant transformation |
| Hugo Symbol | Variant Class | Variant Classification | dbSNP RS | HGVSc | HGVSp | HGVSp Short | SWISSPROT | BIOTYPE | SIFT | PolyPhen | Tumor Sample Barcode | Tissue | Histology | Sex | Age | Stage | Therapy Types | Drugs | Outcome |
| SCRN3 | SNV | Missense_Mutation | novel | c.1007N>C | p.Lys336Thr | p.K336T | Q0VDG4 | protein_coding | deleterious(0.01) | benign(0.122) | TCGA-AN-A046-01 | Breast | breast invasive carcinoma | Female | >=65 | I/II | Unknown | Unknown | SD |
| SCRN3 | SNV | Missense_Mutation | c.838N>A | p.Ala280Thr | p.A280T | Q0VDG4 | protein_coding | deleterious(0) | benign(0.039) | TCGA-AN-A0AK-01 | Breast | breast invasive carcinoma | Female | >=65 | I/II | Unknown | Unknown | SD | |
| SCRN3 | SNV | Missense_Mutation | rs542985134 | c.215N>A | p.Arg72His | p.R72H | Q0VDG4 | protein_coding | deleterious(0) | probably_damaging(0.971) | TCGA-D8-A146-01 | Breast | breast invasive carcinoma | Female | <65 | I/II | Unknown | Unknown | SD |
| SCRN3 | SNV | Missense_Mutation | novel | c.315A>C | p.Glu105Asp | p.E105D | Q0VDG4 | protein_coding | tolerated(0.08) | probably_damaging(0.998) | TCGA-2W-A8YY-01 | Cervix | cervical & endocervical cancer | Female | <65 | I/II | Chemotherapy | cisplatin | CR |
| SCRN3 | SNV | Missense_Mutation | novel | c.565C>G | p.Gln189Glu | p.Q189E | Q0VDG4 | protein_coding | tolerated(0.09) | possibly_damaging(0.473) | TCGA-HM-A4S6-01 | Cervix | cervical & endocervical cancer | Female | <65 | III/IV | Chemotherapy | cisplatin | CR |
| SCRN3 | SNV | Missense_Mutation | c.433G>C | p.Glu145Gln | p.E145Q | Q0VDG4 | protein_coding | deleterious(0.02) | probably_damaging(0.999) | TCGA-Q1-A5R2-01 | Cervix | cervical & endocervical cancer | Female | <65 | I/II | Chemotherapy | cisplatin | PR | |
| SCRN3 | SNV | Missense_Mutation | rs777659517 | c.106N>C | p.Glu36Gln | p.E36Q | Q0VDG4 | protein_coding | deleterious(0.01) | probably_damaging(0.999) | TCGA-ZJ-A8QO-01 | Cervix | cervical & endocervical cancer | Female | >=65 | I/II | Unknown | Unknown | SD |
| SCRN3 | SNV | Missense_Mutation | c.550N>T | p.Arg184Cys | p.R184C | Q0VDG4 | protein_coding | deleterious(0.03) | probably_damaging(0.999) | TCGA-AA-A01R-01 | Colorectum | colon adenocarcinoma | Male | <65 | III/IV | Chemotherapy | 5-fluorouracil | PD | |
| SCRN3 | SNV | Missense_Mutation | novel | c.545N>A | p.Gly182Glu | p.G182E | Q0VDG4 | protein_coding | deleterious(0) | probably_damaging(1) | TCGA-AZ-4315-01 | Colorectum | colon adenocarcinoma | Male | <65 | I/II | Unknown | Unknown | SD |
| SCRN3 | SNV | Missense_Mutation | c.956N>T | p.Ser319Leu | p.S319L | Q0VDG4 | protein_coding | tolerated(0.21) | benign(0.024) | TCGA-AZ-6598-01 | Colorectum | colon adenocarcinoma | Female | >=65 | I/II | Unknown | Unknown | SD |
| Page: 1 2 3 4 5 |
Top |
Related drugs of malignant transformation related genes |
| Identification of chemicals and drugs interact with genes involved in malignant transfromation |
| (DGIdb 4.0) |
| Entrez ID | Symbol | Category | Interaction Types | Drug Claim Name | Drug Name | PMIDs |
| Page: 1 |

Copyright 2023-Present -The University of Texas Health Science Center at Houston |