
|
|||||
|
 | |
| |
| |
| |
| |
| |
|
Gene: SCRN2 |
Gene summary for SCRN2 |
| Gene information | Species | Human | Gene symbol | SCRN2 | Gene ID | 90507 |
| Gene name | secernin 2 | |
| Gene Alias | Ses2 | |
| Cytomap | 17q21.32 | |
| Gene Type | protein-coding | GO ID | GO:0006508 | UniProtAcc | Q96FV2 |
Top |
Malignant transformation analysis |
| Identification of the aberrant gene expression in precancerous and cancerous lesions by comparing the gene expression of stem-like cells in diseased tissues with normal stem cells |
| Entrez ID | Symbol | Replicates | Species | Organ | Tissue | Adj P-value | Log2FC | Malignancy |
| 90507 | SCRN2 | LZE3D | Human | Esophagus | HGIN | 2.57e-02 | 3.97e-01 | 0.0668 |
| 90507 | SCRN2 | LZE4T | Human | Esophagus | ESCC | 1.15e-04 | 8.36e-02 | 0.0811 |
| 90507 | SCRN2 | LZE7T | Human | Esophagus | ESCC | 1.80e-07 | 2.46e-01 | 0.0667 |
| 90507 | SCRN2 | LZE8T | Human | Esophagus | ESCC | 5.20e-09 | 1.76e-01 | 0.067 |
| 90507 | SCRN2 | LZE20T | Human | Esophagus | ESCC | 1.14e-02 | 4.18e-02 | 0.0662 |
| 90507 | SCRN2 | LZE22D1 | Human | Esophagus | HGIN | 1.13e-04 | 1.12e-01 | 0.0595 |
| 90507 | SCRN2 | LZE24T | Human | Esophagus | ESCC | 1.79e-23 | 5.55e-01 | 0.0596 |
| 90507 | SCRN2 | LZE22D3 | Human | Esophagus | HGIN | 5.07e-04 | 4.96e-01 | 0.0653 |
| 90507 | SCRN2 | LZE21T | Human | Esophagus | ESCC | 3.36e-05 | 1.41e-01 | 0.0655 |
| 90507 | SCRN2 | LZE6T | Human | Esophagus | ESCC | 3.29e-07 | 3.62e-01 | 0.0845 |
| 90507 | SCRN2 | P1T-E | Human | Esophagus | ESCC | 1.24e-10 | 6.22e-01 | 0.0875 |
| 90507 | SCRN2 | P2T-E | Human | Esophagus | ESCC | 5.31e-16 | 3.61e-01 | 0.1177 |
| 90507 | SCRN2 | P4T-E | Human | Esophagus | ESCC | 3.73e-39 | 7.36e-01 | 0.1323 |
| 90507 | SCRN2 | P5T-E | Human | Esophagus | ESCC | 2.56e-27 | 5.67e-01 | 0.1327 |
| 90507 | SCRN2 | P8T-E | Human | Esophagus | ESCC | 3.09e-24 | 4.43e-01 | 0.0889 |
| 90507 | SCRN2 | P9T-E | Human | Esophagus | ESCC | 4.83e-16 | 2.37e-01 | 0.1131 |
| 90507 | SCRN2 | P10T-E | Human | Esophagus | ESCC | 8.78e-17 | 1.93e-01 | 0.116 |
| 90507 | SCRN2 | P11T-E | Human | Esophagus | ESCC | 7.83e-10 | 4.50e-01 | 0.1426 |
| 90507 | SCRN2 | P12T-E | Human | Esophagus | ESCC | 1.42e-28 | 5.06e-01 | 0.1122 |
| 90507 | SCRN2 | P15T-E | Human | Esophagus | ESCC | 6.52e-19 | 3.12e-01 | 0.1149 |
| Page: 1 2 3 4 5 6 |
| Tissue | Expression Dynamics | Abbreviation |
| Esophagus | 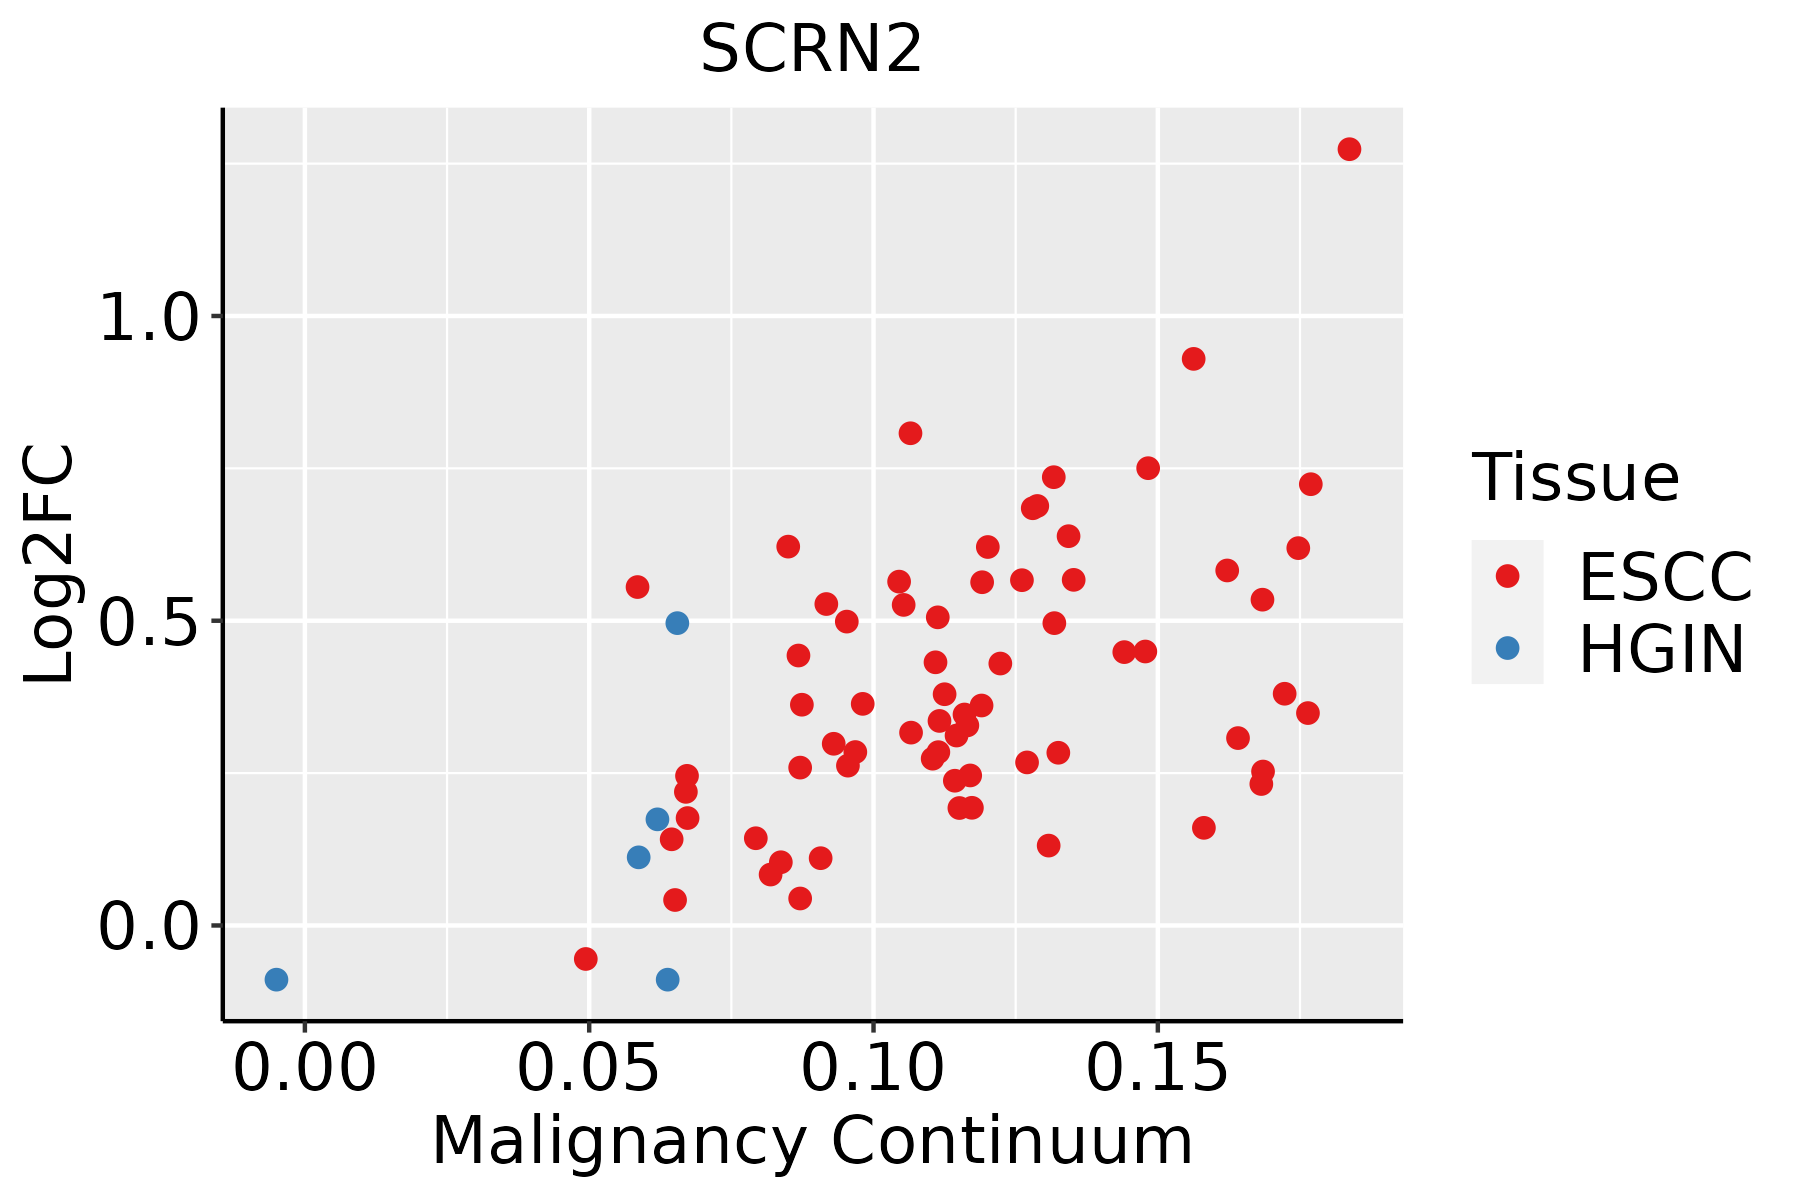 | ESCC: Esophageal squamous cell carcinoma |
| HGIN: High-grade intraepithelial neoplasias | ||
| LGIN: Low-grade intraepithelial neoplasias | ||
| Liver | 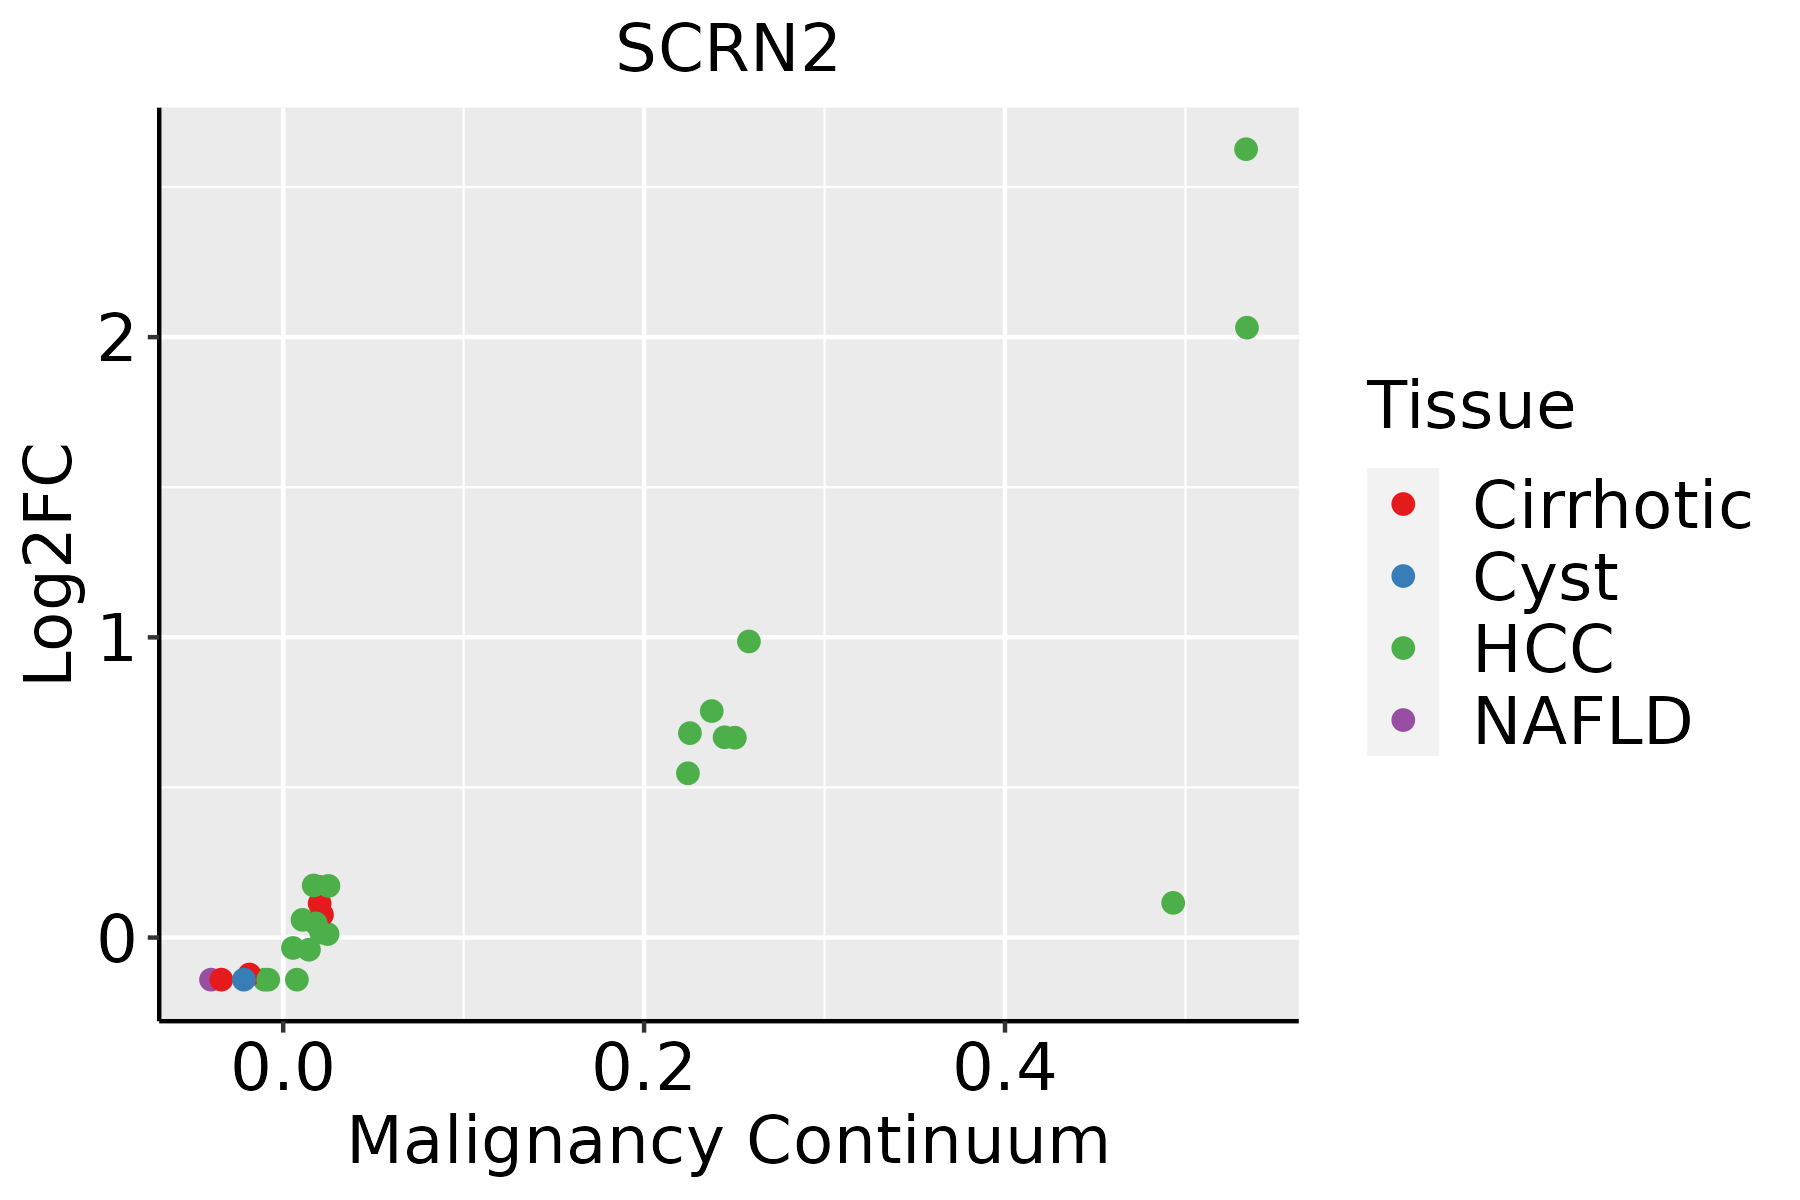 | HCC: Hepatocellular carcinoma |
| NAFLD: Non-alcoholic fatty liver disease | ||
| Oral Cavity | 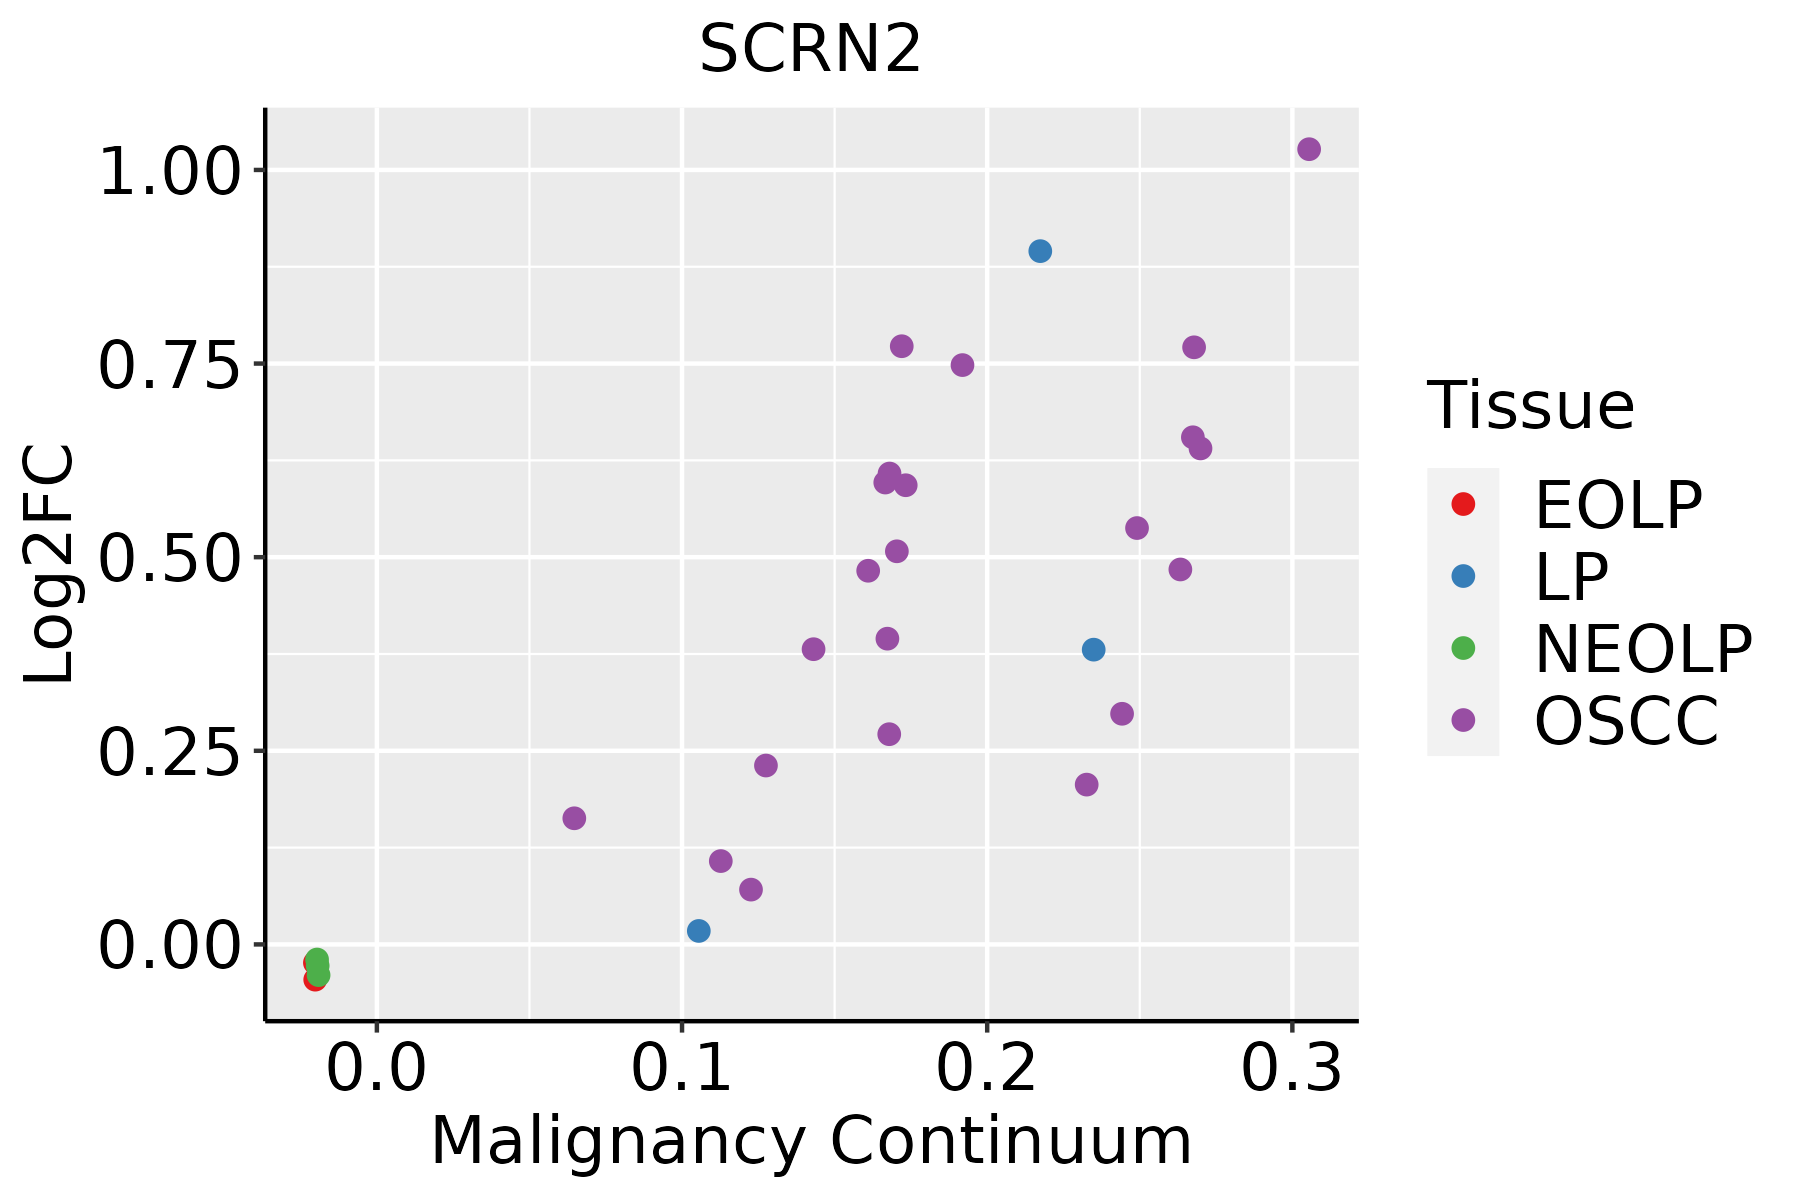 | EOLP: Erosive Oral lichen planus |
| LP: leukoplakia | ||
| NEOLP: Non-erosive oral lichen planus | ||
| OSCC: Oral squamous cell carcinoma | ||
| Thyroid | 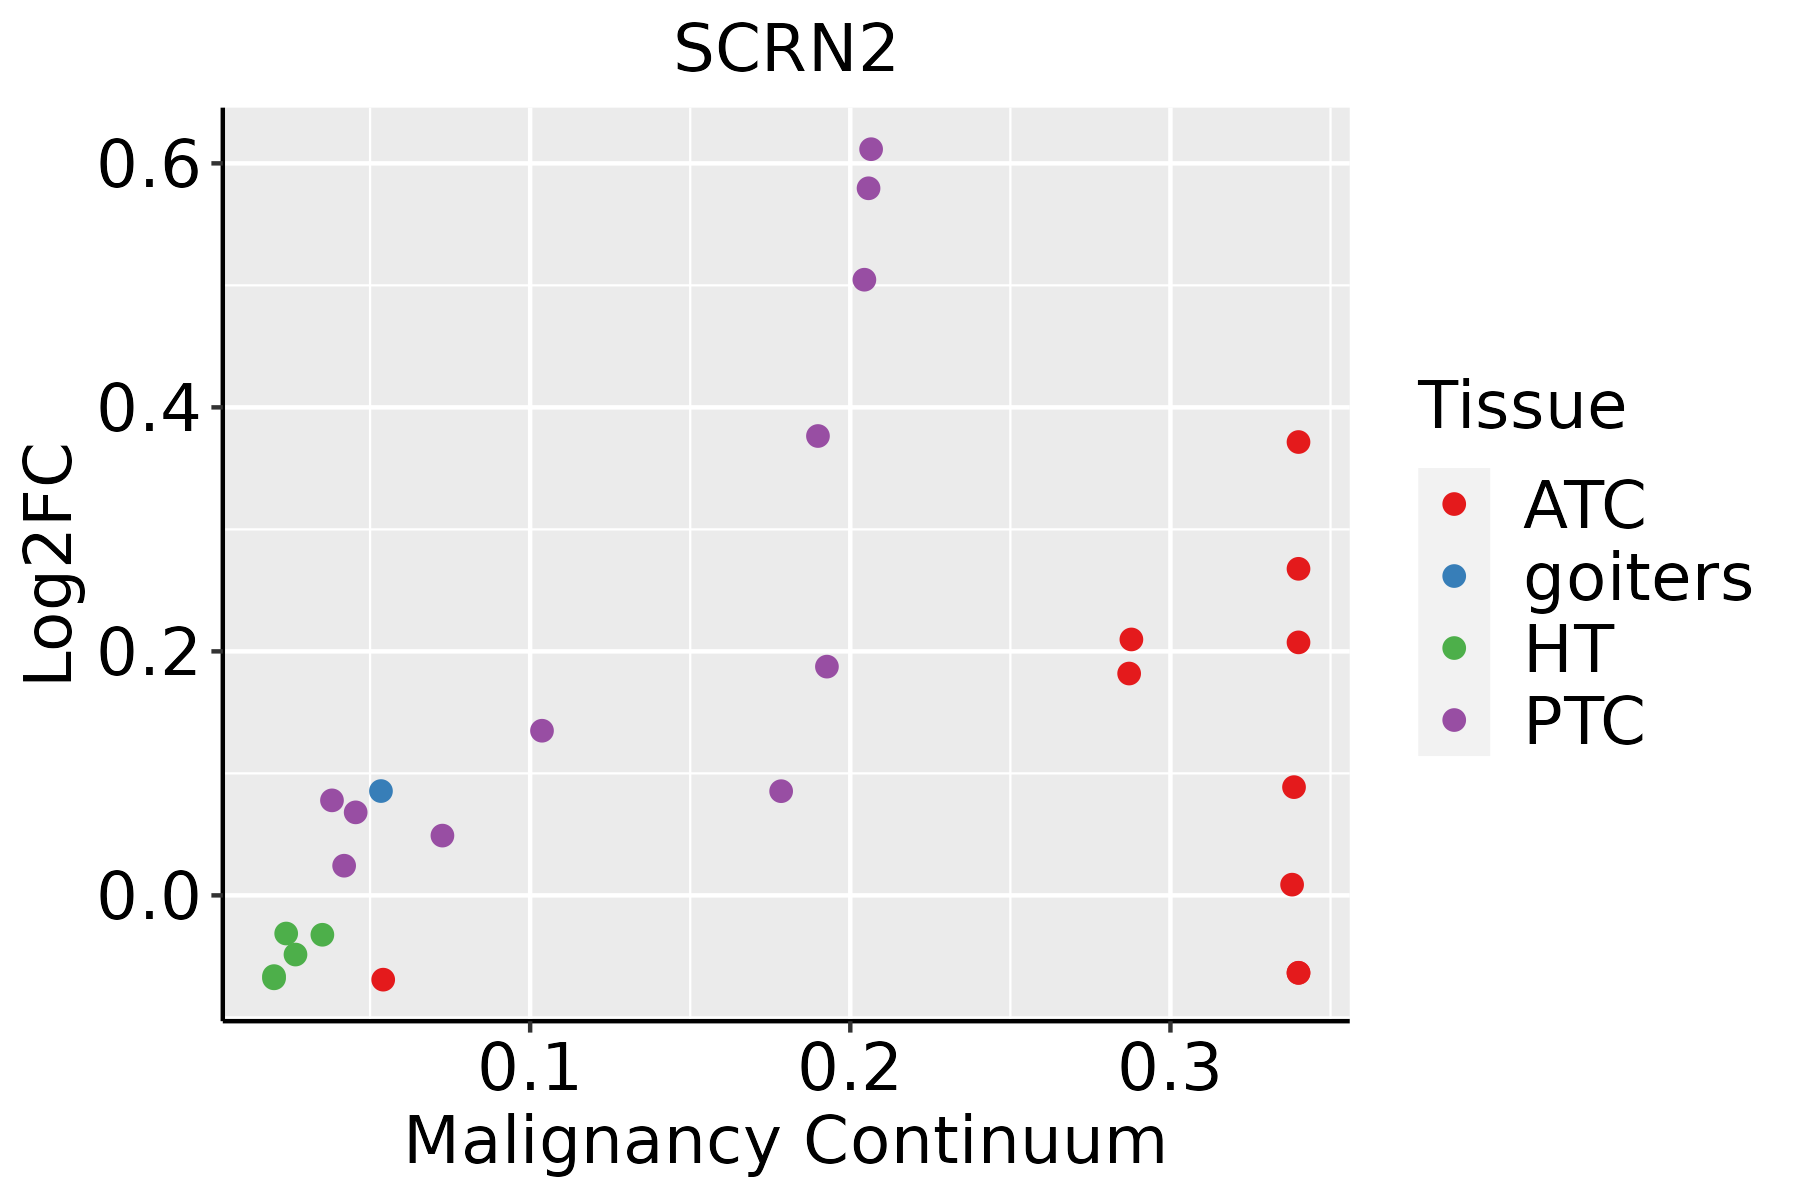 | ATC: Anaplastic thyroid cancer |
| HT: Hashimoto's thyroiditis | ||
| PTC: Papillary thyroid cancer |
| ∗log2FC in expression of this searched gene in stem-like cells from each diseased tissue sample relative to stem-like cells in normal samples in each tissue plotted against the malignancy continuum. Samples are colored based on if they are from different disease stage. |
Top |
Malignant transformation related pathway analysis |
| Find out the enriched GO biological processes and KEGG pathways involved in transition from healthy to precancer to cancer |
| Tissue | Disease Stage | Enriched GO biological Processes |
| Colorectum | AD |  |
| Colorectum | SER |  |
| Colorectum | MSS |  |
| Colorectum | MSI-H |  |
| Colorectum | FAP |  |
| ∗Top 15 enriched GO BP terms are showed in the bar plot of each disease state in each tissue. Each row represents a significant GO biological process which is colored according to the -log10(p.adjust). |
| Page: 1 2 3 4 5 6 7 8 9 |
| GO ID | Tissue | Disease Stage | Description | Gene Ratio | Bg Ratio | pvalue | p.adjust | Count |
| Page: 1 |
| Pathway ID | Tissue | Disease Stage | Description | Gene Ratio | Bg Ratio | pvalue | p.adjust | qvalue | Count |
| Page: 1 |
Top |
Cell-cell communication analysis |
| Identification of potential cell-cell interactions between two cell types and their ligand-receptor pairs for different disease states |
| Ligand | Receptor | LRpair | Pathway | Tissue | Disease Stage |
| Page: 1 |
Top |
Single-cell gene regulatory network inference analysis |
| Find out the significant the regulons (TFs) and the target genes of each regulon across cell types for different disease states |
| TF | Cell Type | Tissue | Disease Stage | Target Gene | RSS | Regulon Activity |
| ∗The dot plots of a searched regulon are shown for all cell subpopulations in each disease state of each tissue based on the regulon specific score inferred using pySCENIC and by calculating the average expression. |
| Page: 1 |
Top |
Somatic mutation of malignant transformation related genes |
| Annotation of somatic variants for genes involved in malignant transformation |
| Hugo Symbol | Variant Class | Variant Classification | dbSNP RS | HGVSc | HGVSp | HGVSp Short | SWISSPROT | BIOTYPE | SIFT | PolyPhen | Tumor Sample Barcode | Tissue | Histology | Sex | Age | Stage | Therapy Types | Drugs | Outcome |
| SCRN2 | SNV | Missense_Mutation | c.828N>G | p.Ile276Met | p.I276M | Q96FV2 | protein_coding | deleterious(0) | probably_damaging(0.997) | TCGA-AC-A23H-01 | Breast | breast invasive carcinoma | Female | >=65 | I/II | Unknown | Unknown | PD | |
| SCRN2 | SNV | Missense_Mutation | rs766421033 | c.433N>A | p.Gly145Arg | p.G145R | Q96FV2 | protein_coding | deleterious(0) | probably_damaging(1) | TCGA-AR-A251-01 | Breast | breast invasive carcinoma | Female | <65 | III/IV | Chemotherapy | doxorubicin | SD |
| SCRN2 | SNV | Missense_Mutation | novel | c.292G>A | p.Glu98Lys | p.E98K | Q96FV2 | protein_coding | deleterious(0) | probably_damaging(0.999) | TCGA-C8-A8HQ-01 | Breast | breast invasive carcinoma | Female | <65 | I/II | Unknown | Unknown | SD |
| SCRN2 | deletion | Frame_Shift_Del | c.328delN | p.Glu110LysfsTer25 | p.E110Kfs*25 | Q96FV2 | protein_coding | TCGA-BH-A18G-01 | Breast | breast invasive carcinoma | Female | >=65 | I/II | Unknown | Unknown | SD | |||
| SCRN2 | SNV | Missense_Mutation | rs144133774 | c.1040N>A | p.Arg347Gln | p.R347Q | Q96FV2 | protein_coding | deleterious(0.01) | probably_damaging(0.994) | TCGA-C5-A1BQ-01 | Cervix | cervical & endocervical cancer | Female | >=65 | III/IV | Chemotherapy | cisplatin | CR |
| SCRN2 | SNV | Missense_Mutation | c.8N>T | p.Ser3Leu | p.S3L | Q96FV2 | protein_coding | tolerated_low_confidence(0.16) | benign(0) | TCGA-EK-A2RB-01 | Cervix | cervical & endocervical cancer | Female | <65 | I/II | Unknown | Unknown | SD | |
| SCRN2 | SNV | Missense_Mutation | rs374214556 | c.1079N>A | p.Arg360His | p.R360H | Q96FV2 | protein_coding | deleterious(0.02) | benign(0.373) | TCGA-A6-6141-01 | Colorectum | colon adenocarcinoma | Male | <65 | I/II | Chemotherapy | 5-fu | SD |
| SCRN2 | SNV | Missense_Mutation | rs779903206 | c.1243N>A | p.Ala415Thr | p.A415T | Q96FV2 | protein_coding | tolerated(0.1) | benign(0) | TCGA-AA-3811-01 | Colorectum | colon adenocarcinoma | Female | >=65 | III/IV | Unknown | Unknown | PD |
| SCRN2 | SNV | Missense_Mutation | rs751802544 | c.566N>A | p.Arg189His | p.R189H | Q96FV2 | protein_coding | deleterious(0.02) | benign(0.013) | TCGA-G4-6628-01 | Colorectum | colon adenocarcinoma | Male | >=65 | I/II | Unknown | Unknown | SD |
| SCRN2 | deletion | Frame_Shift_Del | rs750983392 | c.437delG | p.Gly146AlafsTer50 | p.G146Afs*50 | Q96FV2 | protein_coding | TCGA-AA-3966-01 | Colorectum | colon adenocarcinoma | Female | >=65 | I/II | Unknown | Unknown | SD |
| Page: 1 2 3 4 |
Top |
Related drugs of malignant transformation related genes |
| Identification of chemicals and drugs interact with genes involved in malignant transfromation |
| (DGIdb 4.0) |
| Entrez ID | Symbol | Category | Interaction Types | Drug Claim Name | Drug Name | PMIDs |
| Page: 1 |

Copyright 2023-Present -The University of Texas Health Science Center at Houston |