
|
|||||
|
 | |
| |
| |
| |
| |
| |
|
Gene: SCP2 |
Gene summary for SCP2 |
| Gene information | Species | Human | Gene symbol | SCP2 | Gene ID | 6342 |
| Gene name | sterol carrier protein 2 | |
| Gene Alias | NLTP | |
| Cytomap | 1p32.3 | |
| Gene Type | protein-coding | GO ID | GO:0001676 | UniProtAcc | P22307 |
Top |
Malignant transformation analysis |
| Identification of the aberrant gene expression in precancerous and cancerous lesions by comparing the gene expression of stem-like cells in diseased tissues with normal stem cells |
| Entrez ID | Symbol | Replicates | Species | Organ | Tissue | Adj P-value | Log2FC | Malignancy |
| 6342 | SCP2 | GSM4909281 | Human | Breast | IDC | 5.06e-12 | 4.13e-01 | 0.21 |
| 6342 | SCP2 | GSM4909282 | Human | Breast | IDC | 9.20e-06 | 3.16e-01 | -0.0288 |
| 6342 | SCP2 | GSM4909285 | Human | Breast | IDC | 4.32e-22 | 4.07e-01 | 0.21 |
| 6342 | SCP2 | GSM4909289 | Human | Breast | IDC | 2.25e-04 | 5.15e-01 | 0.1064 |
| 6342 | SCP2 | GSM4909290 | Human | Breast | IDC | 1.18e-19 | 5.91e-01 | 0.2096 |
| 6342 | SCP2 | GSM4909294 | Human | Breast | IDC | 2.44e-07 | 2.84e-01 | 0.2022 |
| 6342 | SCP2 | GSM4909296 | Human | Breast | IDC | 1.01e-06 | -2.15e-01 | 0.1524 |
| 6342 | SCP2 | GSM4909297 | Human | Breast | IDC | 3.67e-06 | 3.24e-02 | 0.1517 |
| 6342 | SCP2 | GSM4909298 | Human | Breast | IDC | 6.55e-16 | 3.94e-01 | 0.1551 |
| 6342 | SCP2 | GSM4909303 | Human | Breast | IDC | 1.20e-02 | 3.89e-01 | 0.0438 |
| 6342 | SCP2 | GSM4909304 | Human | Breast | IDC | 2.25e-08 | 3.13e-01 | 0.1636 |
| 6342 | SCP2 | GSM4909306 | Human | Breast | IDC | 7.49e-03 | 2.38e-01 | 0.1564 |
| 6342 | SCP2 | GSM4909308 | Human | Breast | IDC | 4.81e-05 | 2.63e-01 | 0.158 |
| 6342 | SCP2 | GSM4909311 | Human | Breast | IDC | 1.27e-20 | -2.17e-01 | 0.1534 |
| 6342 | SCP2 | GSM4909312 | Human | Breast | IDC | 5.54e-08 | 1.18e-01 | 0.1552 |
| 6342 | SCP2 | GSM4909316 | Human | Breast | IDC | 4.71e-07 | 4.69e-01 | 0.21 |
| 6342 | SCP2 | GSM4909319 | Human | Breast | IDC | 3.12e-23 | -2.82e-01 | 0.1563 |
| 6342 | SCP2 | GSM4909320 | Human | Breast | IDC | 1.36e-03 | -2.73e-01 | 0.1575 |
| 6342 | SCP2 | GSM4909321 | Human | Breast | IDC | 1.38e-06 | -9.89e-02 | 0.1559 |
| 6342 | SCP2 | brca2 | Human | Breast | Precancer | 5.94e-04 | 2.07e-01 | -0.024 |
| Page: 1 2 3 4 5 6 7 8 9 10 11 12 13 |
| Tissue | Expression Dynamics | Abbreviation |
| Breast |  | IDC: Invasive ductal carcinoma |
| DCIS: Ductal carcinoma in situ | ||
| Precancer(BRCA1-mut): Precancerous lesion from BRCA1 mutation carriers | ||
| Colorectum (GSE201348) | 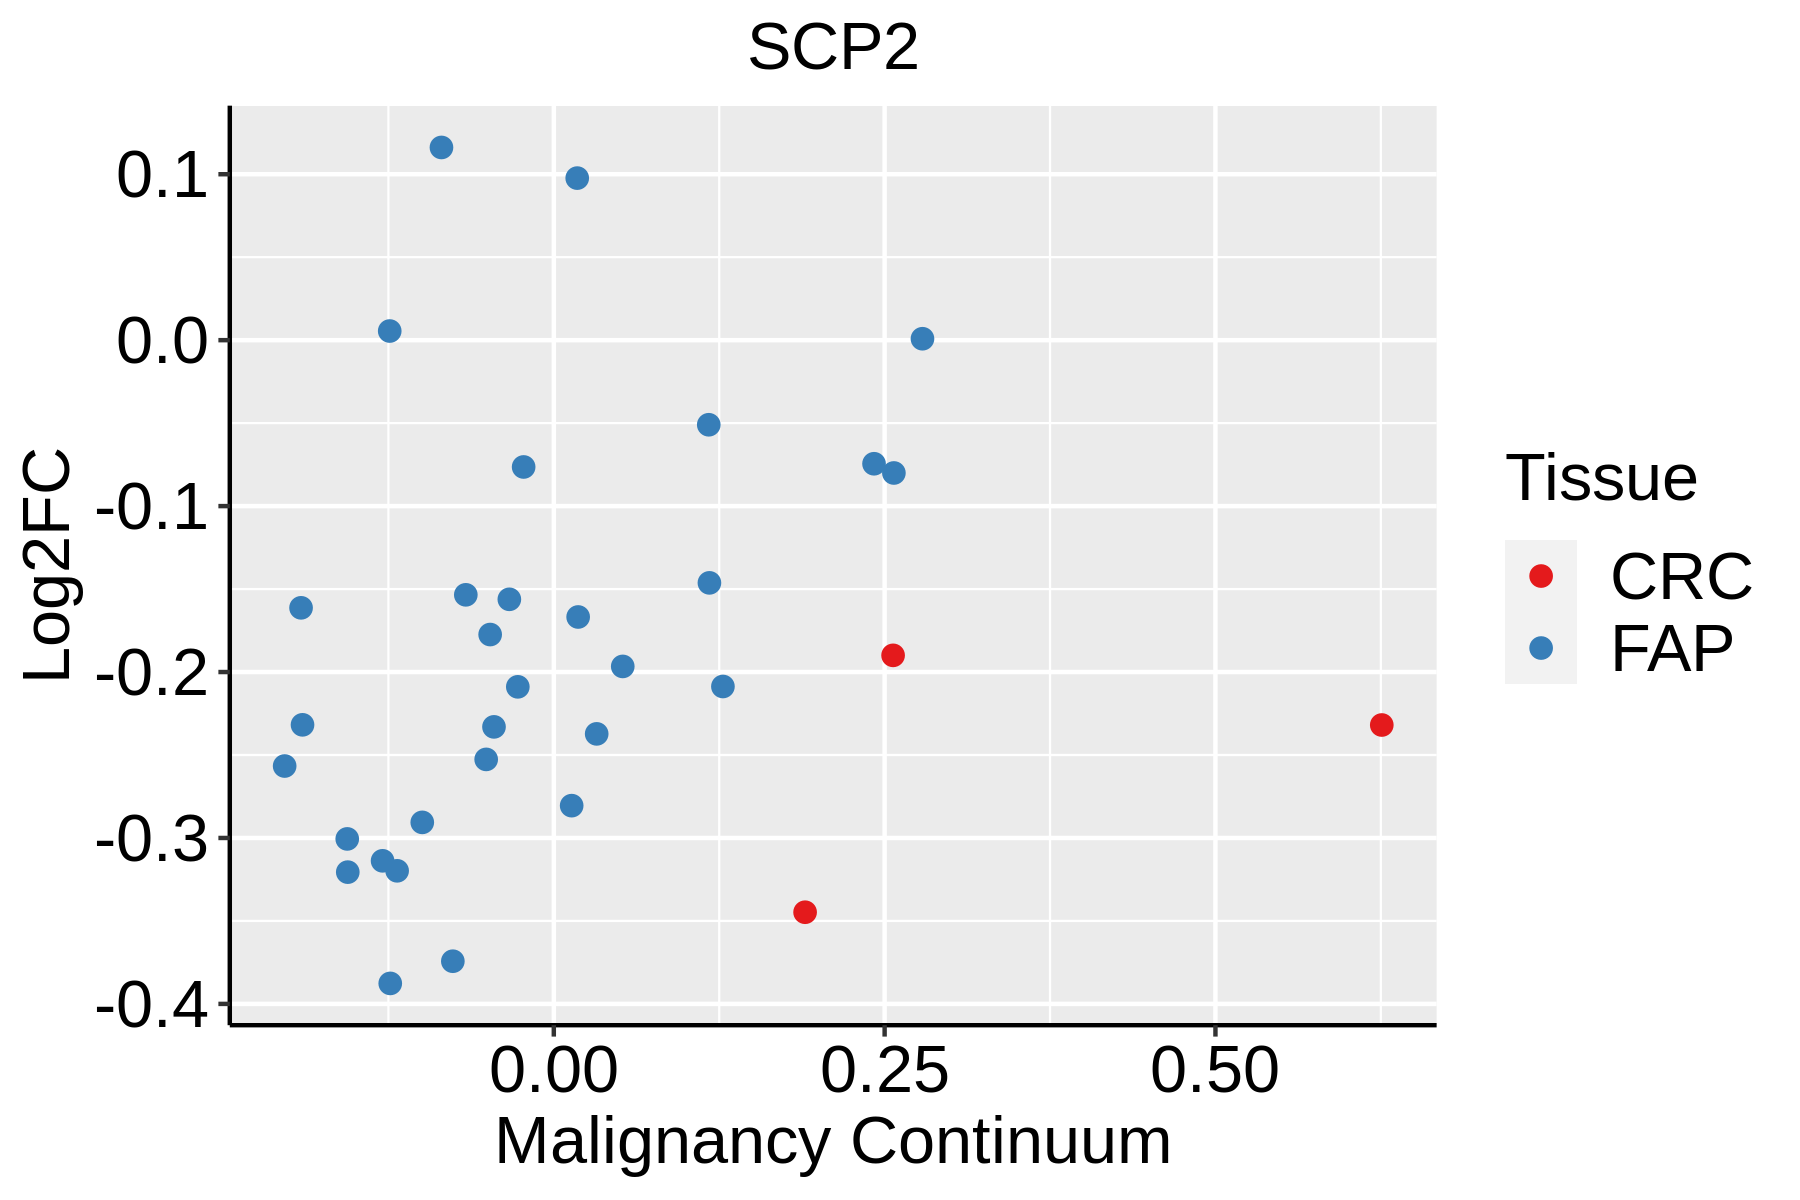 | FAP: Familial adenomatous polyposis |
| CRC: Colorectal cancer | ||
| Colorectum (HTA11) | 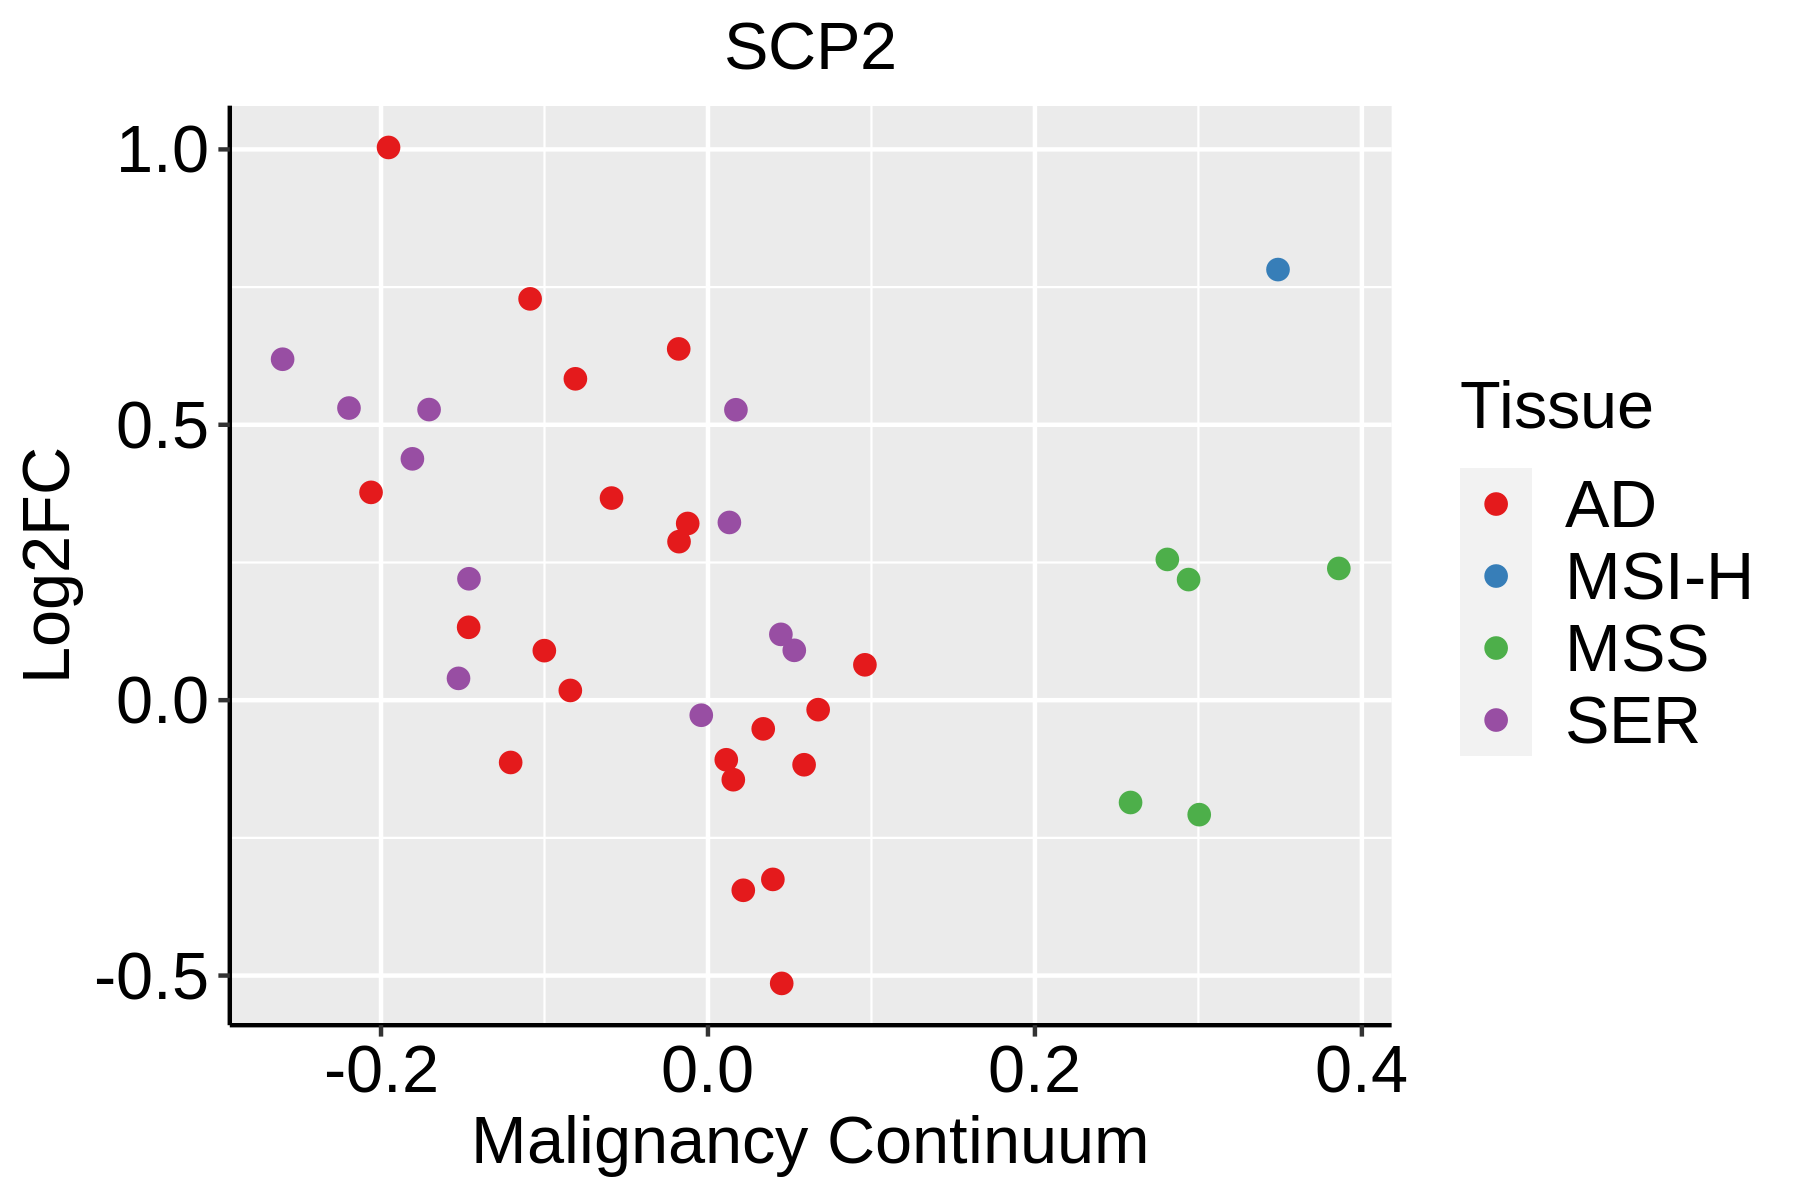 | AD: Adenomas |
| SER: Sessile serrated lesions | ||
| MSI-H: Microsatellite-high colorectal cancer | ||
| MSS: Microsatellite stable colorectal cancer | ||
| Endometrium |  | AEH: Atypical endometrial hyperplasia |
| EEC: Endometrioid Cancer | ||
| Esophagus |  | ESCC: Esophageal squamous cell carcinoma |
| HGIN: High-grade intraepithelial neoplasias | ||
| LGIN: Low-grade intraepithelial neoplasias | ||
| GC |  | CAG: Chronic atrophic gastritis |
| CAG with IM: Chronic atrophic gastritis with intestinal metaplasia | ||
| CSG: Chronic superficial gastritis | ||
| GC: Gastric cancer | ||
| SIM: Severe intestinal metaplasia | ||
| WIM: Wild intestinal metaplasia | ||
| Liver | 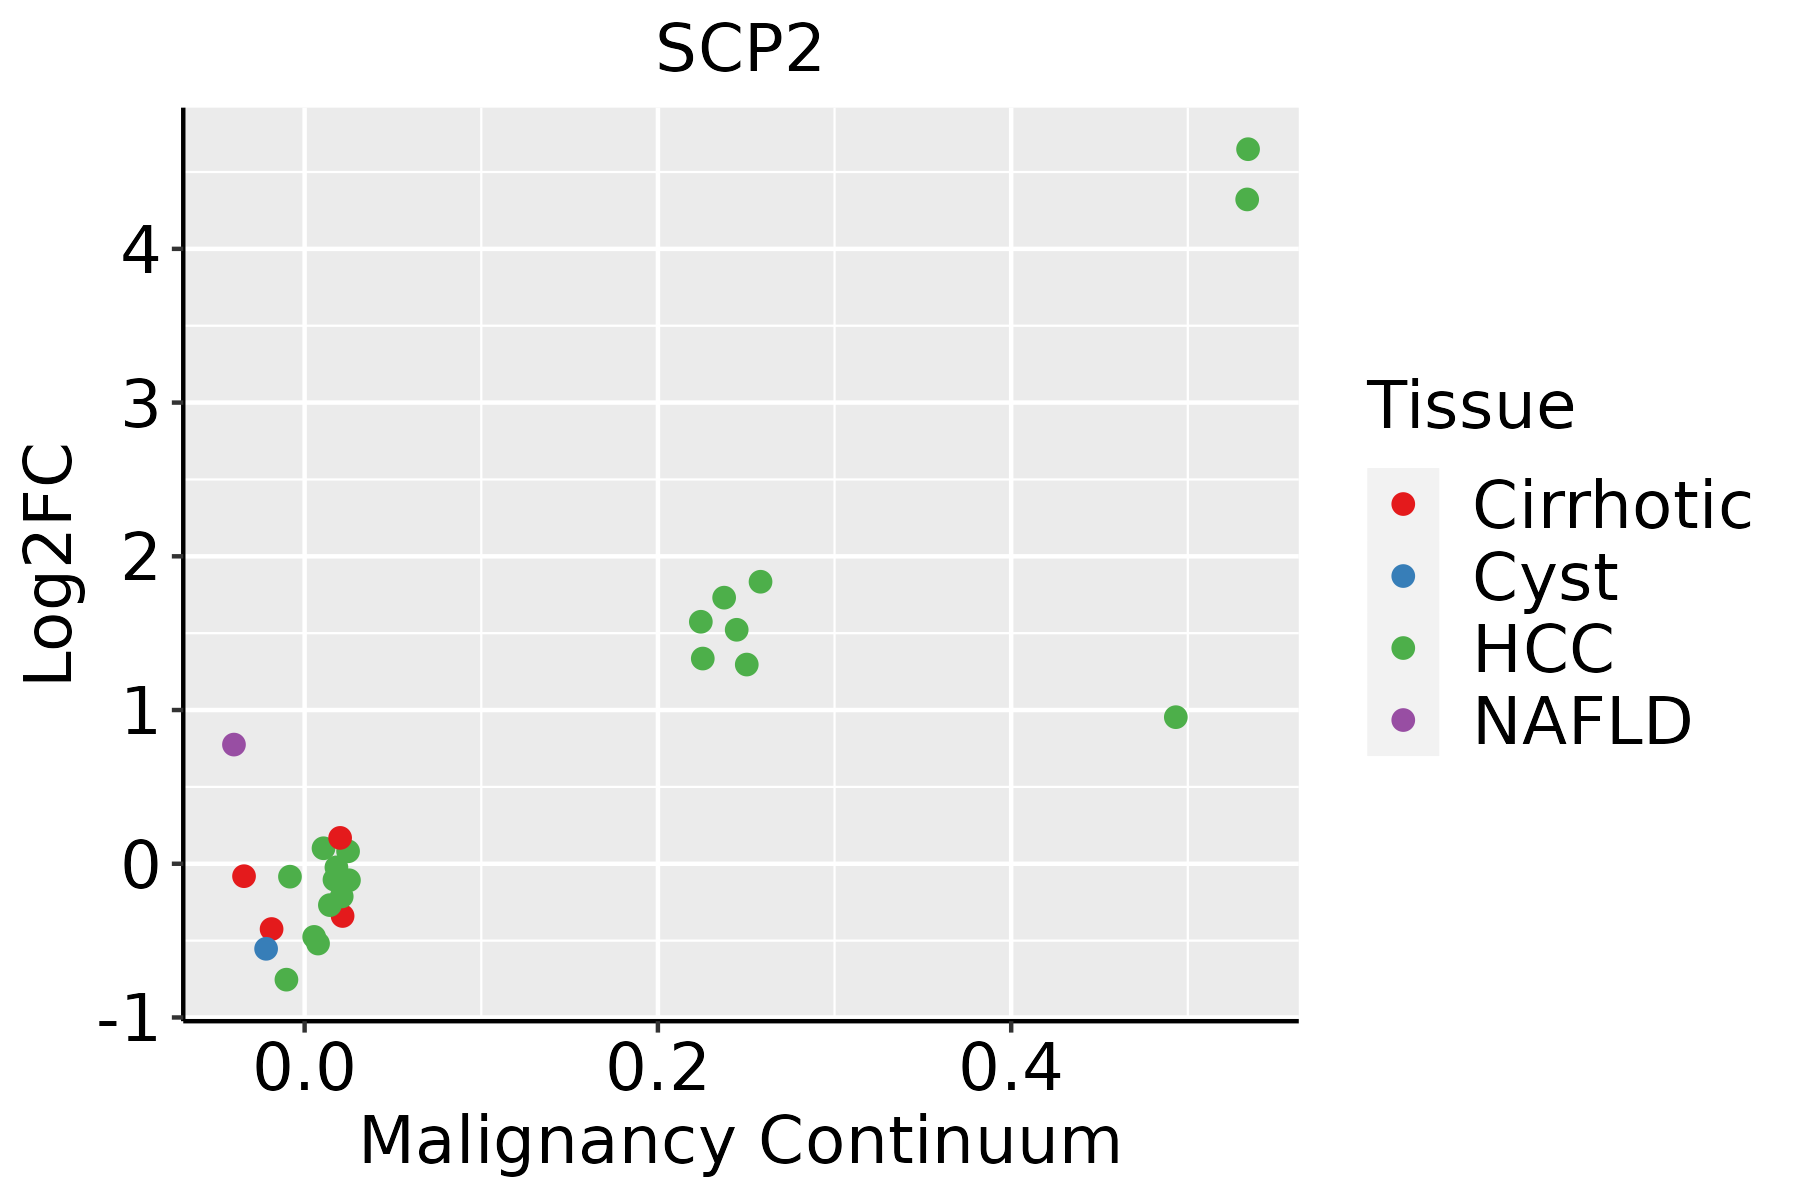 | HCC: Hepatocellular carcinoma |
| NAFLD: Non-alcoholic fatty liver disease | ||
| Oral Cavity | 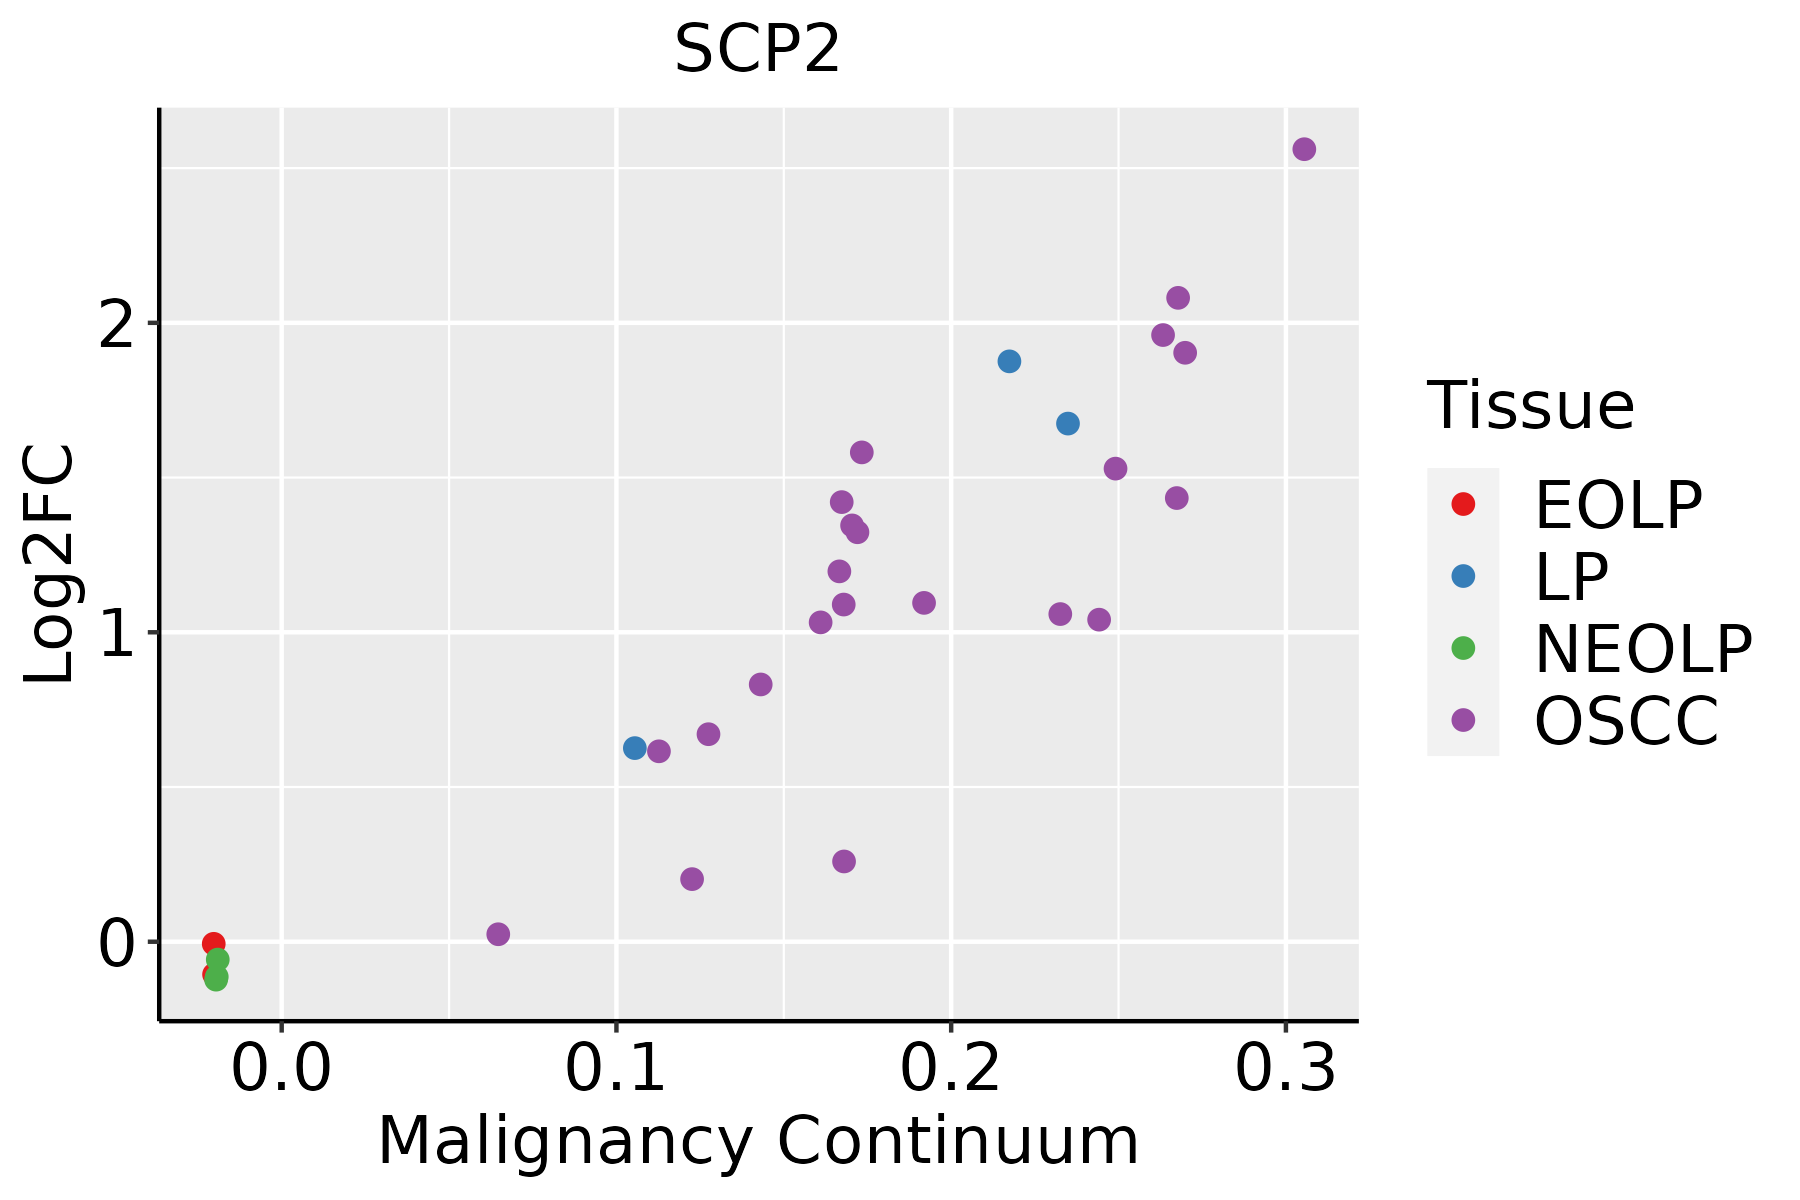 | EOLP: Erosive Oral lichen planus |
| LP: leukoplakia | ||
| NEOLP: Non-erosive oral lichen planus | ||
| OSCC: Oral squamous cell carcinoma | ||
| Prostate | 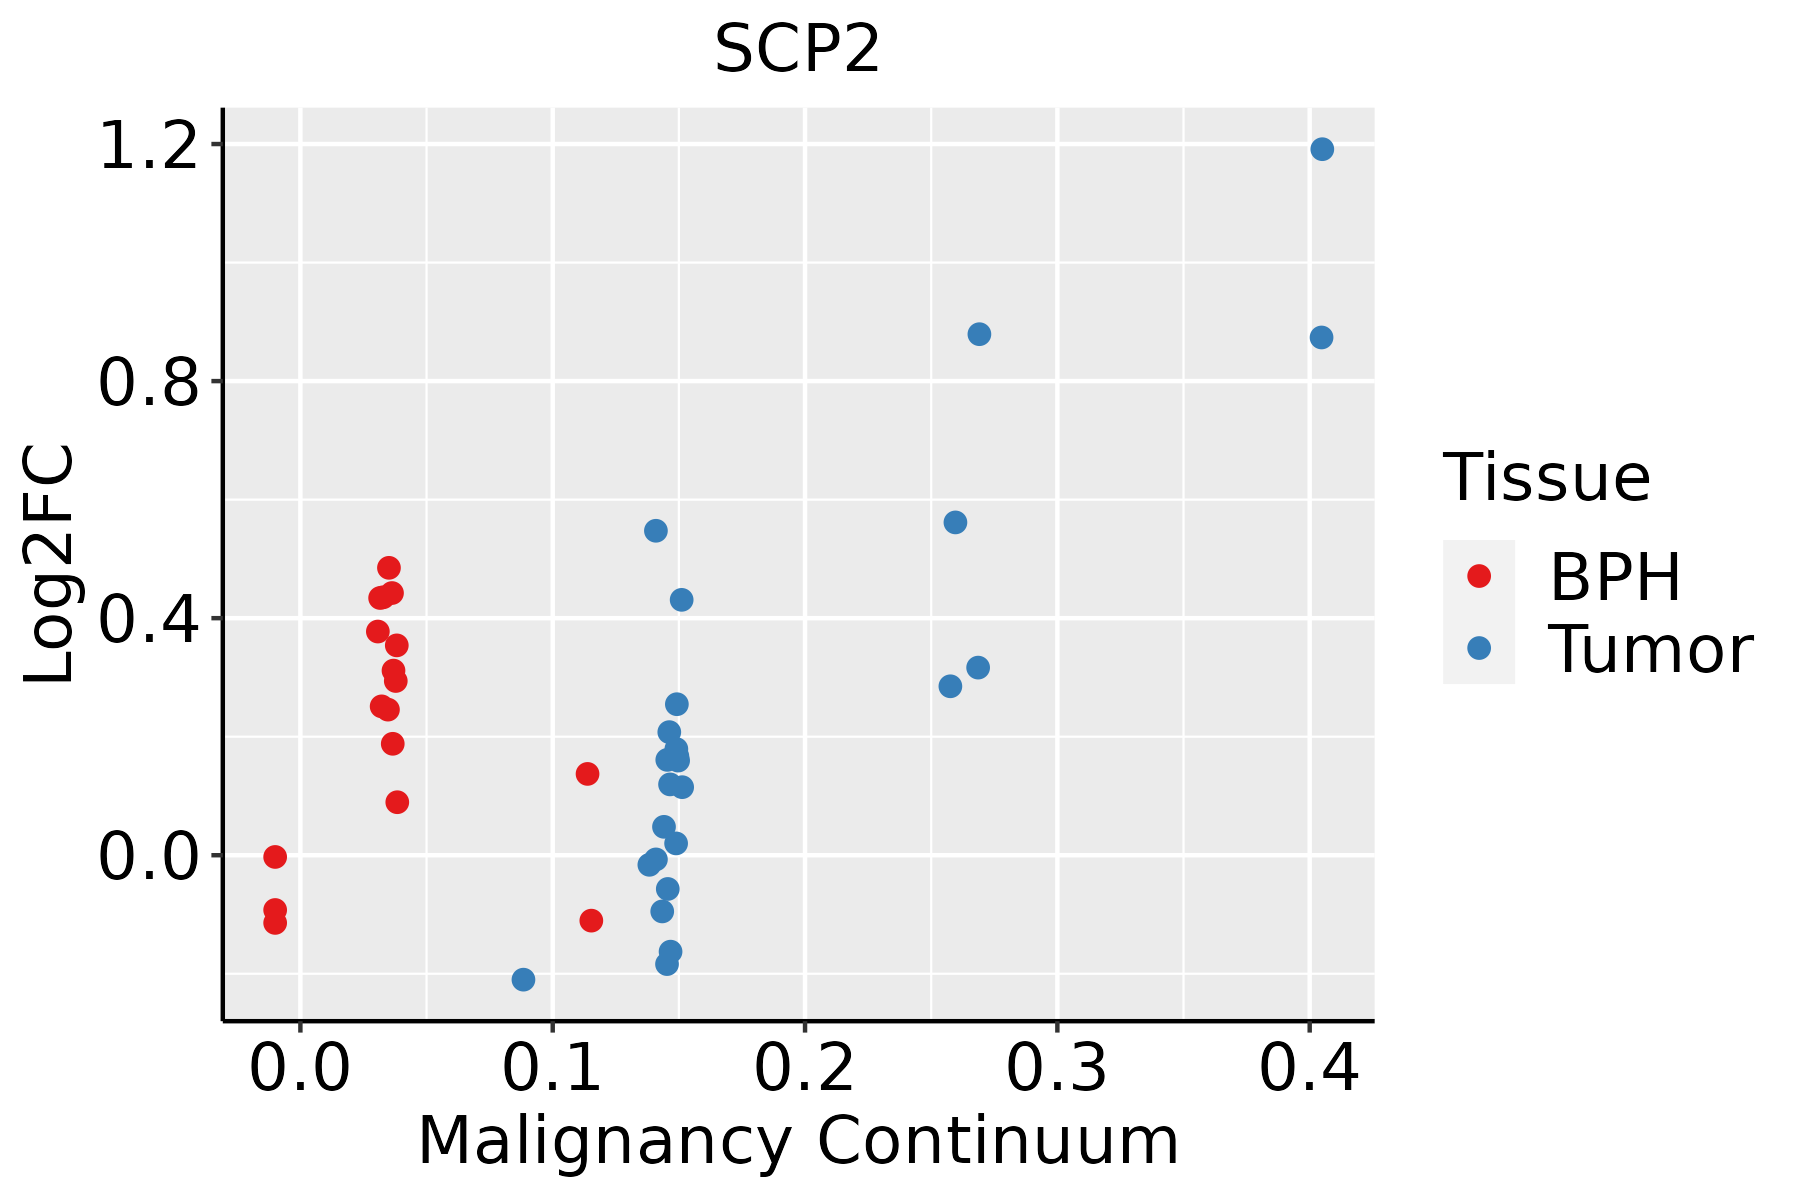 | BPH: Benign Prostatic Hyperplasia |
| Skin |  | AK: Actinic keratosis |
| cSCC: Cutaneous squamous cell carcinoma | ||
| SCCIS:squamous cell carcinoma in situ | ||
| Thyroid | 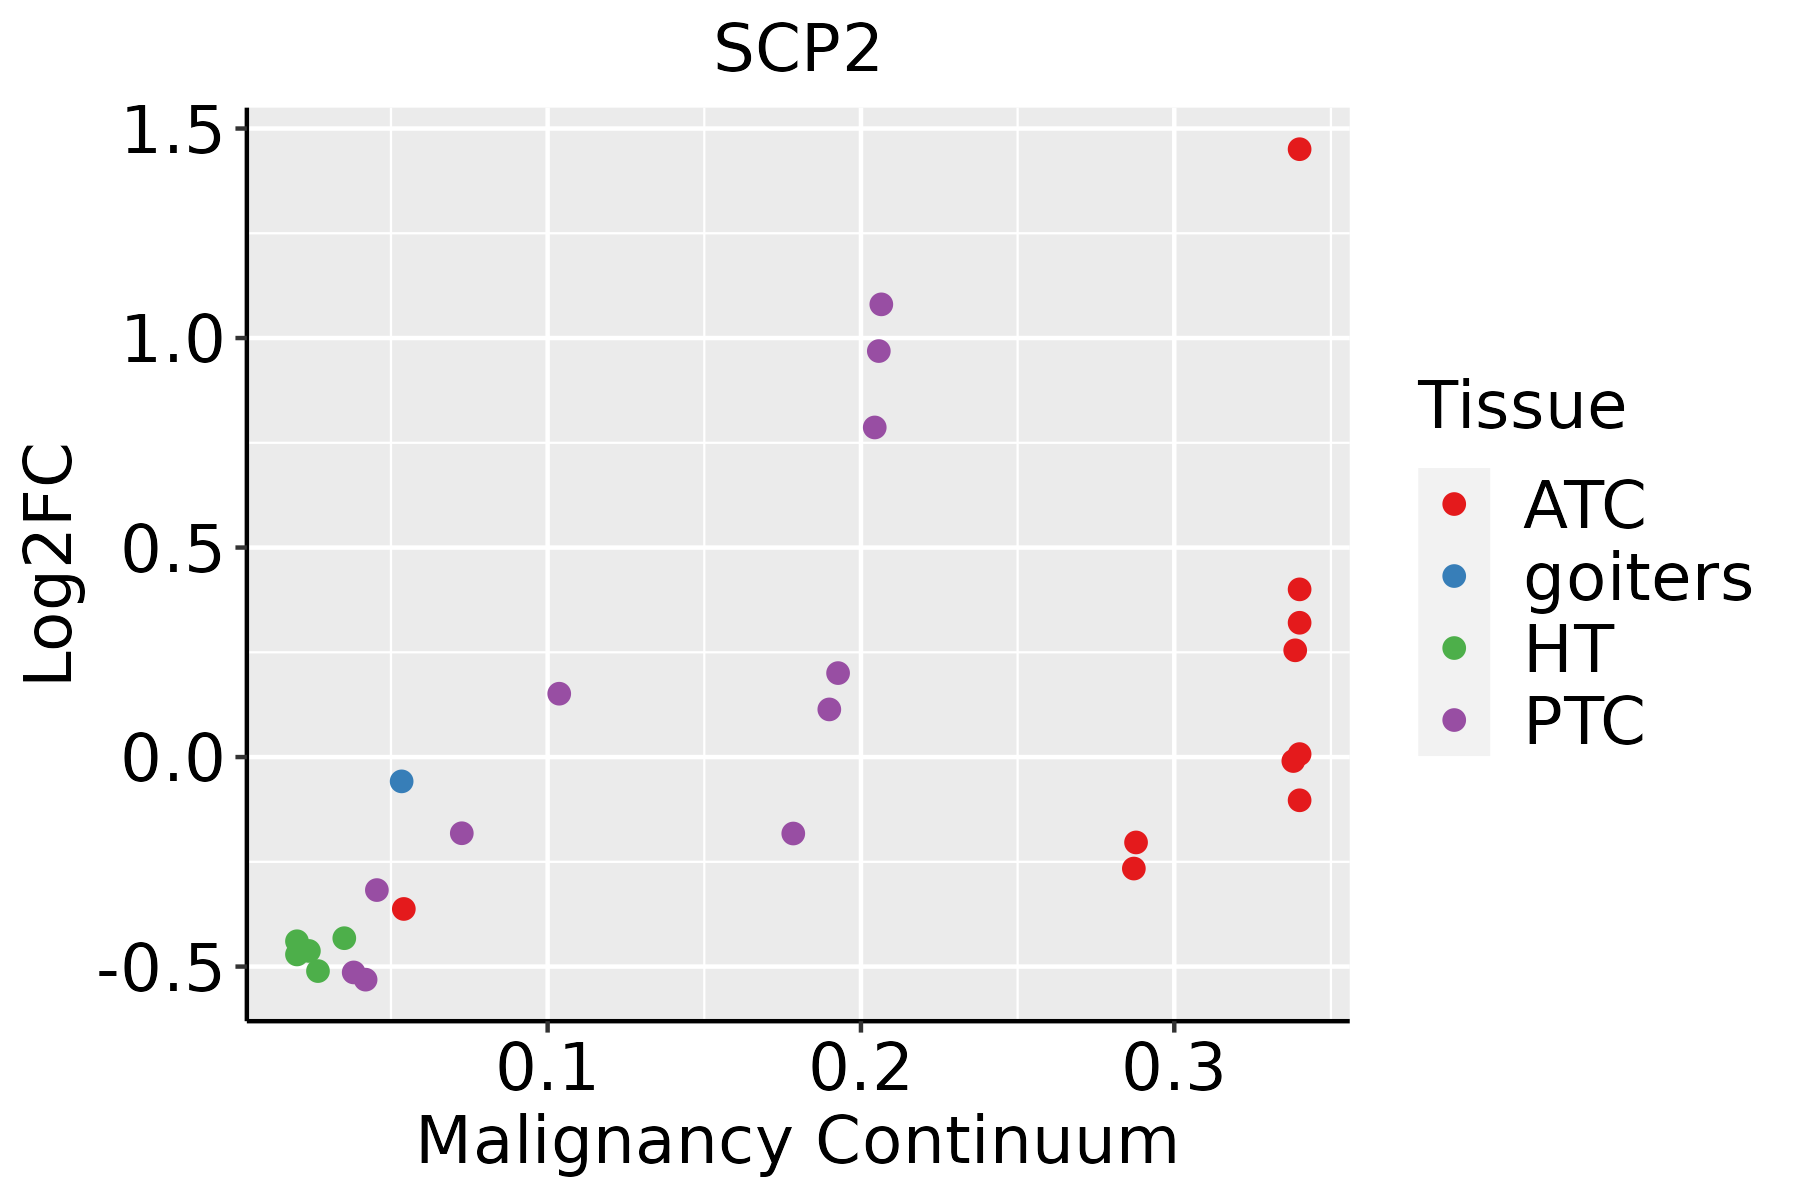 | ATC: Anaplastic thyroid cancer |
| HT: Hashimoto's thyroiditis | ||
| PTC: Papillary thyroid cancer |
| ∗log2FC in expression of this searched gene in stem-like cells from each diseased tissue sample relative to stem-like cells in normal samples in each tissue plotted against the malignancy continuum. Samples are colored based on if they are from different disease stage. |
Top |
Malignant transformation related pathway analysis |
| Find out the enriched GO biological processes and KEGG pathways involved in transition from healthy to precancer to cancer |
| Tissue | Disease Stage | Enriched GO biological Processes |
| Colorectum | AD |  |
| Colorectum | SER |  |
| Colorectum | MSS |  |
| Colorectum | MSI-H |  |
| Colorectum | FAP |  |
| ∗Top 15 enriched GO BP terms are showed in the bar plot of each disease state in each tissue. Each row represents a significant GO biological process which is colored according to the -log10(p.adjust). |
| Page: 1 2 3 4 5 6 7 8 9 |
| GO ID | Tissue | Disease Stage | Description | Gene Ratio | Bg Ratio | pvalue | p.adjust | Count |
| GO:00463946 | Breast | Precancer | carboxylic acid biosynthetic process | 32/1080 | 314/18723 | 1.30e-03 | 1.38e-02 | 32 |
| GO:00723304 | Breast | Precancer | monocarboxylic acid biosynthetic process | 24/1080 | 214/18723 | 1.41e-03 | 1.48e-02 | 24 |
| GO:00160536 | Breast | Precancer | organic acid biosynthetic process | 32/1080 | 316/18723 | 1.44e-03 | 1.50e-02 | 32 |
| GO:00066944 | Breast | IDC | steroid biosynthetic process | 25/1434 | 173/18723 | 1.56e-03 | 1.56e-02 | 25 |
| GO:007233012 | Breast | IDC | monocarboxylic acid biosynthetic process | 29/1434 | 214/18723 | 1.91e-03 | 1.83e-02 | 29 |
| GO:001605313 | Breast | IDC | organic acid biosynthetic process | 39/1434 | 316/18723 | 2.13e-03 | 1.99e-02 | 39 |
| GO:004639413 | Breast | IDC | carboxylic acid biosynthetic process | 38/1434 | 314/18723 | 3.39e-03 | 2.83e-02 | 38 |
| GO:00323888 | Breast | IDC | positive regulation of intracellular transport | 26/1434 | 202/18723 | 6.33e-03 | 4.47e-02 | 26 |
| GO:001605322 | Breast | DCIS | organic acid biosynthetic process | 38/1390 | 316/18723 | 2.22e-03 | 2.04e-02 | 38 |
| GO:007233022 | Breast | DCIS | monocarboxylic acid biosynthetic process | 28/1390 | 214/18723 | 2.43e-03 | 2.18e-02 | 28 |
| GO:004639422 | Breast | DCIS | carboxylic acid biosynthetic process | 37/1390 | 314/18723 | 3.56e-03 | 2.92e-02 | 37 |
| GO:003238813 | Breast | DCIS | positive regulation of intracellular transport | 26/1390 | 202/18723 | 4.24e-03 | 3.33e-02 | 26 |
| GO:000669411 | Breast | DCIS | steroid biosynthetic process | 23/1390 | 173/18723 | 4.63e-03 | 3.52e-02 | 23 |
| GO:0032388 | Colorectum | AD | positive regulation of intracellular transport | 74/3918 | 202/18723 | 1.83e-07 | 7.80e-06 | 74 |
| GO:0032386 | Colorectum | AD | regulation of intracellular transport | 109/3918 | 337/18723 | 5.33e-07 | 1.95e-05 | 109 |
| GO:0044282 | Colorectum | AD | small molecule catabolic process | 118/3918 | 376/18723 | 1.05e-06 | 3.55e-05 | 118 |
| GO:0006635 | Colorectum | AD | fatty acid beta-oxidation | 33/3918 | 74/18723 | 3.98e-06 | 1.09e-04 | 33 |
| GO:0009062 | Colorectum | AD | fatty acid catabolic process | 41/3918 | 100/18723 | 4.02e-06 | 1.09e-04 | 41 |
| GO:0019395 | Colorectum | AD | fatty acid oxidation | 40/3918 | 103/18723 | 2.43e-05 | 4.69e-04 | 40 |
| GO:0016042 | Colorectum | AD | lipid catabolic process | 97/3918 | 320/18723 | 4.31e-05 | 7.56e-04 | 97 |
| Page: 1 2 3 4 5 6 7 8 9 10 11 12 13 14 15 |
| Pathway ID | Tissue | Disease Stage | Description | Gene Ratio | Bg Ratio | pvalue | p.adjust | qvalue | Count |
| hsa01212 | Colorectum | CRC | Fatty acid metabolism | 14/1091 | 57/8465 | 1.17e-02 | 4.99e-02 | 3.38e-02 | 14 |
| hsa012121 | Colorectum | CRC | Fatty acid metabolism | 14/1091 | 57/8465 | 1.17e-02 | 4.99e-02 | 3.38e-02 | 14 |
| hsa012129 | Esophagus | ESCC | Fatty acid metabolism | 41/4205 | 57/8465 | 5.13e-04 | 1.75e-03 | 8.98e-04 | 41 |
| hsa041467 | Esophagus | ESCC | Peroxisome | 55/4205 | 82/8465 | 1.04e-03 | 3.27e-03 | 1.68e-03 | 55 |
| hsa0121214 | Esophagus | ESCC | Fatty acid metabolism | 41/4205 | 57/8465 | 5.13e-04 | 1.75e-03 | 8.98e-04 | 41 |
| hsa0414612 | Esophagus | ESCC | Peroxisome | 55/4205 | 82/8465 | 1.04e-03 | 3.27e-03 | 1.68e-03 | 55 |
| hsa033206 | Liver | NAFLD | PPAR signaling pathway | 25/1043 | 75/8465 | 1.61e-06 | 6.62e-05 | 5.33e-05 | 25 |
| hsa00120 | Liver | NAFLD | Primary bile acid biosynthesis | 9/1043 | 17/8465 | 6.10e-05 | 1.33e-03 | 1.07e-03 | 9 |
| hsa04146 | Liver | NAFLD | Peroxisome | 19/1043 | 82/8465 | 4.37e-03 | 4.10e-02 | 3.30e-02 | 19 |
| hsa0332011 | Liver | NAFLD | PPAR signaling pathway | 25/1043 | 75/8465 | 1.61e-06 | 6.62e-05 | 5.33e-05 | 25 |
| hsa001201 | Liver | NAFLD | Primary bile acid biosynthesis | 9/1043 | 17/8465 | 6.10e-05 | 1.33e-03 | 1.07e-03 | 9 |
| hsa041461 | Liver | NAFLD | Peroxisome | 19/1043 | 82/8465 | 4.37e-03 | 4.10e-02 | 3.30e-02 | 19 |
| hsa012122 | Liver | Cirrhotic | Fatty acid metabolism | 32/2530 | 57/8465 | 3.12e-05 | 2.47e-04 | 1.52e-04 | 32 |
| hsa041462 | Liver | Cirrhotic | Peroxisome | 36/2530 | 82/8465 | 4.79e-03 | 1.74e-02 | 1.07e-02 | 36 |
| hsa0332021 | Liver | Cirrhotic | PPAR signaling pathway | 32/2530 | 75/8465 | 1.24e-02 | 3.92e-02 | 2.42e-02 | 32 |
| hsa01040 | Liver | Cirrhotic | Biosynthesis of unsaturated fatty acids | 14/2530 | 27/8465 | 1.36e-02 | 4.25e-02 | 2.62e-02 | 14 |
| hsa012123 | Liver | Cirrhotic | Fatty acid metabolism | 32/2530 | 57/8465 | 3.12e-05 | 2.47e-04 | 1.52e-04 | 32 |
| hsa041463 | Liver | Cirrhotic | Peroxisome | 36/2530 | 82/8465 | 4.79e-03 | 1.74e-02 | 1.07e-02 | 36 |
| hsa0332031 | Liver | Cirrhotic | PPAR signaling pathway | 32/2530 | 75/8465 | 1.24e-02 | 3.92e-02 | 2.42e-02 | 32 |
| hsa010401 | Liver | Cirrhotic | Biosynthesis of unsaturated fatty acids | 14/2530 | 27/8465 | 1.36e-02 | 4.25e-02 | 2.62e-02 | 14 |
| Page: 1 2 3 |
Top |
Cell-cell communication analysis |
| Identification of potential cell-cell interactions between two cell types and their ligand-receptor pairs for different disease states |
| Ligand | Receptor | LRpair | Pathway | Tissue | Disease Stage |
| Page: 1 |
Top |
Single-cell gene regulatory network inference analysis |
| Find out the significant the regulons (TFs) and the target genes of each regulon across cell types for different disease states |
| TF | Cell Type | Tissue | Disease Stage | Target Gene | RSS | Regulon Activity |
| ∗The dot plots of a searched regulon are shown for all cell subpopulations in each disease state of each tissue based on the regulon specific score inferred using pySCENIC and by calculating the average expression. |
| Page: 1 |
Top |
Somatic mutation of malignant transformation related genes |
| Annotation of somatic variants for genes involved in malignant transformation |
| Hugo Symbol | Variant Class | Variant Classification | dbSNP RS | HGVSc | HGVSp | HGVSp Short | SWISSPROT | BIOTYPE | SIFT | PolyPhen | Tumor Sample Barcode | Tissue | Histology | Sex | Age | Stage | Therapy Types | Drugs | Outcome |
| SCP2 | SNV | Missense_Mutation | c.127N>T | p.Gly43Cys | p.G43C | P22307 | protein_coding | deleterious(0.04) | probably_damaging(0.981) | TCGA-AO-A128-01 | Breast | breast invasive carcinoma | Female | <65 | I/II | Chemotherapy | doxorubicin | SD | |
| SCP2 | SNV | Missense_Mutation | c.211T>A | p.Cys71Ser | p.C71S | P22307 | protein_coding | tolerated(0.35) | benign(0.044) | TCGA-C8-A131-01 | Breast | breast invasive carcinoma | Female | >=65 | III/IV | Chemotherapy | 5-fluorouracil | CR | |
| SCP2 | insertion | Nonsense_Mutation | novel | c.771_772insTCACAGTTTGCTGTAAGAAAAAGATCTGTTTAAGATCTC | p.Gln257_Glu258insSerGlnPheAlaValArgLysArgSerValTerAspLeu | p.Q257_E258insSQFAVRKRSV*DL | P22307 | protein_coding | TCGA-A2-A0CP-01 | Breast | breast invasive carcinoma | Female | <65 | I/II | Chemotherapy | cytoxan | SD | ||
| SCP2 | insertion | Frame_Shift_Ins | novel | c.752_753insCCAAGCCAGGAACCCAGGACAAAGACCAAAT | p.Val252GlnfsTer21 | p.V252Qfs*21 | P22307 | protein_coding | TCGA-A2-A0EX-01 | Breast | breast invasive carcinoma | Female | <65 | I/II | Hormone Therapy | tamoxiphen | SD | ||
| SCP2 | SNV | Missense_Mutation | c.153N>C | p.Gln51His | p.Q51H | P22307 | protein_coding | tolerated(0.06) | benign(0.007) | TCGA-EK-A2RB-01 | Cervix | cervical & endocervical cancer | Female | <65 | I/II | Unknown | Unknown | SD | |
| SCP2 | SNV | Missense_Mutation | novel | c.812N>T | p.Ser271Ile | p.S271I | P22307 | protein_coding | deleterious(0) | probably_damaging(0.942) | TCGA-A6-2672-01 | Colorectum | colon adenocarcinoma | Female | >=65 | III/IV | Unknown | Unknown | SD |
| SCP2 | SNV | Missense_Mutation | c.382N>G | p.Ser128Gly | p.S128G | P22307 | protein_coding | deleterious(0.01) | benign(0.019) | TCGA-A6-6653-01 | Colorectum | colon adenocarcinoma | Male | >=65 | I/II | Unknown | Unknown | SD | |
| SCP2 | SNV | Missense_Mutation | c.374G>C | p.Ser125Thr | p.S125T | P22307 | protein_coding | tolerated(0.19) | benign(0.003) | TCGA-AA-3980-01 | Colorectum | colon adenocarcinoma | Female | >=65 | I/II | Unknown | Unknown | SD | |
| SCP2 | SNV | Missense_Mutation | novel | c.1554N>A | p.Phe518Leu | p.F518L | P22307 | protein_coding | deleterious(0) | probably_damaging(0.938) | TCGA-AA-3984-01 | Colorectum | colon adenocarcinoma | Female | <65 | I/II | Unknown | Unknown | SD |
| SCP2 | SNV | Missense_Mutation | c.934G>A | p.Glu312Lys | p.E312K | P22307 | protein_coding | deleterious(0) | probably_damaging(0.991) | TCGA-AG-A002-01 | Colorectum | rectum adenocarcinoma | Male | <65 | I/II | Unknown | Unknown | SD |
| Page: 1 2 3 4 5 6 |
Top |
Related drugs of malignant transformation related genes |
| Identification of chemicals and drugs interact with genes involved in malignant transfromation |
| (DGIdb 4.0) |
| Entrez ID | Symbol | Category | Interaction Types | Drug Claim Name | Drug Name | PMIDs |
| Page: 1 |

Copyright 2023-Present -The University of Texas Health Science Center at Houston |