Schematic overview of the cellular and molecular mechanisms involved in the cancer progression, including the proposed cellular and molecular mechanisms in cancer cells trajectory. AT1: alveolar type 1 cells; AT2: alveolar type 2 cells; AAH: atypical adenomatous hyperplasia; AIS: adenocarcinoma in situ; MIA: minimally invasive adenocarcinoma; IA: invasive adenocarcinoma; EMT: epithelial-mesenchymal transition

Home

Download

Statistics

Help

Contact

Center for Computational Systems Medicine
leaf

Gene summary

leaf

Malignant transformation analysis

leaf

Malignant transformation related pathway analysis

leaf

Cell-cell communication analysis

leaf

Single-cell gene regulatory network inference analysis

leaf

Somatic mutation of malignant transformation related genes

leaf

Related drugs of malignant transformation related genes

Gene: SCOC

Gene summary for SCOC

check button Gene summary.

Gene informationSpeciesHuman
Gene symbol

SCOC

Gene ID

60592

Gene nameshort coiled-coil protein
Gene AliasHRIHFB2072
Cytomap4q31.1
Gene Typeprotein-coding
GO ID

GO:0006914

UniProtAcc

Q9UIL1


Top

Malignant transformation analysis

check button Identification of the aberrant gene expression in precancerous and cancerous lesions by comparing the gene expression of stem-like cells in diseased tissues with normal stem cells
check button Malignant transformation involving gene list.
Entrez IDSymbolReplicatesSpeciesOrganTissueAdj P-valueLog2FCMalignancy
60592SCOCGSM4909281HumanBreastIDC8.87e-033.13e-010.21
60592SCOCGSM4909288HumanBreastIDC1.56e-033.03e-010.0988
60592SCOCGSM4909294HumanBreastIDC3.21e-084.32e-010.2022
60592SCOCGSM4909296HumanBreastIDC2.91e-08-2.67e-010.1524
60592SCOCGSM4909297HumanBreastIDC1.54e-067.97e-020.1517
60592SCOCGSM4909301HumanBreastIDC3.62e-07-2.66e-010.1577
60592SCOCGSM4909307HumanBreastIDC6.57e-03-2.06e-010.1569
60592SCOCGSM4909309HumanBreastIDC8.50e-04-2.33e-010.0483
60592SCOCGSM4909311HumanBreastIDC6.05e-19-2.71e-010.1534
60592SCOCGSM4909312HumanBreastIDC7.79e-052.47e-020.1552
60592SCOCGSM4909315HumanBreastIDC2.91e-479.09e-010.21
60592SCOCGSM4909316HumanBreastIDC6.83e-258.49e-010.21
60592SCOCGSM4909319HumanBreastIDC6.93e-25-2.42e-010.1563
60592SCOCGSM4909320HumanBreastIDC8.03e-06-3.67e-010.1575
60592SCOCGSM4909321HumanBreastIDC1.12e-07-1.17e-010.1559
60592SCOCbrca2HumanBreastPrecancer5.70e-031.03e-01-0.024
60592SCOCbrca10HumanBreastPrecancer6.30e-04-2.84e-01-0.0029
60592SCOCNCCBC14HumanBreastDCIS2.95e-081.59e-010.2021
60592SCOCNCCBC2HumanBreastDCIS2.30e-041.84e-010.1554
60592SCOCNCCBC5HumanBreastDCIS5.60e-10-1.55e-010.2046
Page: 1 2 3 4 5 6 7 8 

check button Transcriptomic changes along malignancy continuum.
TissueExpression DynamicsAbbreviation
BreastThe image shows the transcriptomic changes along malignancy continuum.log2FC in expression of this searched gene in stem-like cells from each diseased tissue sample relative to stem-like cells in normal samples in each tissue plotted against the malignancy continuum. Samples are colored based on if they are from different disease stage.IDC: Invasive ductal carcinoma
DCIS: Ductal carcinoma in situ
Precancer(BRCA1-mut): Precancerous lesion from BRCA1 mutation carriers
EsophagusThe image shows the transcriptomic changes along malignancy continuum.log2FC in expression of this searched gene in stem-like cells from each diseased tissue sample relative to stem-like cells in normal samples in each tissue plotted against the malignancy continuum. Samples are colored based on if they are from different disease stage.
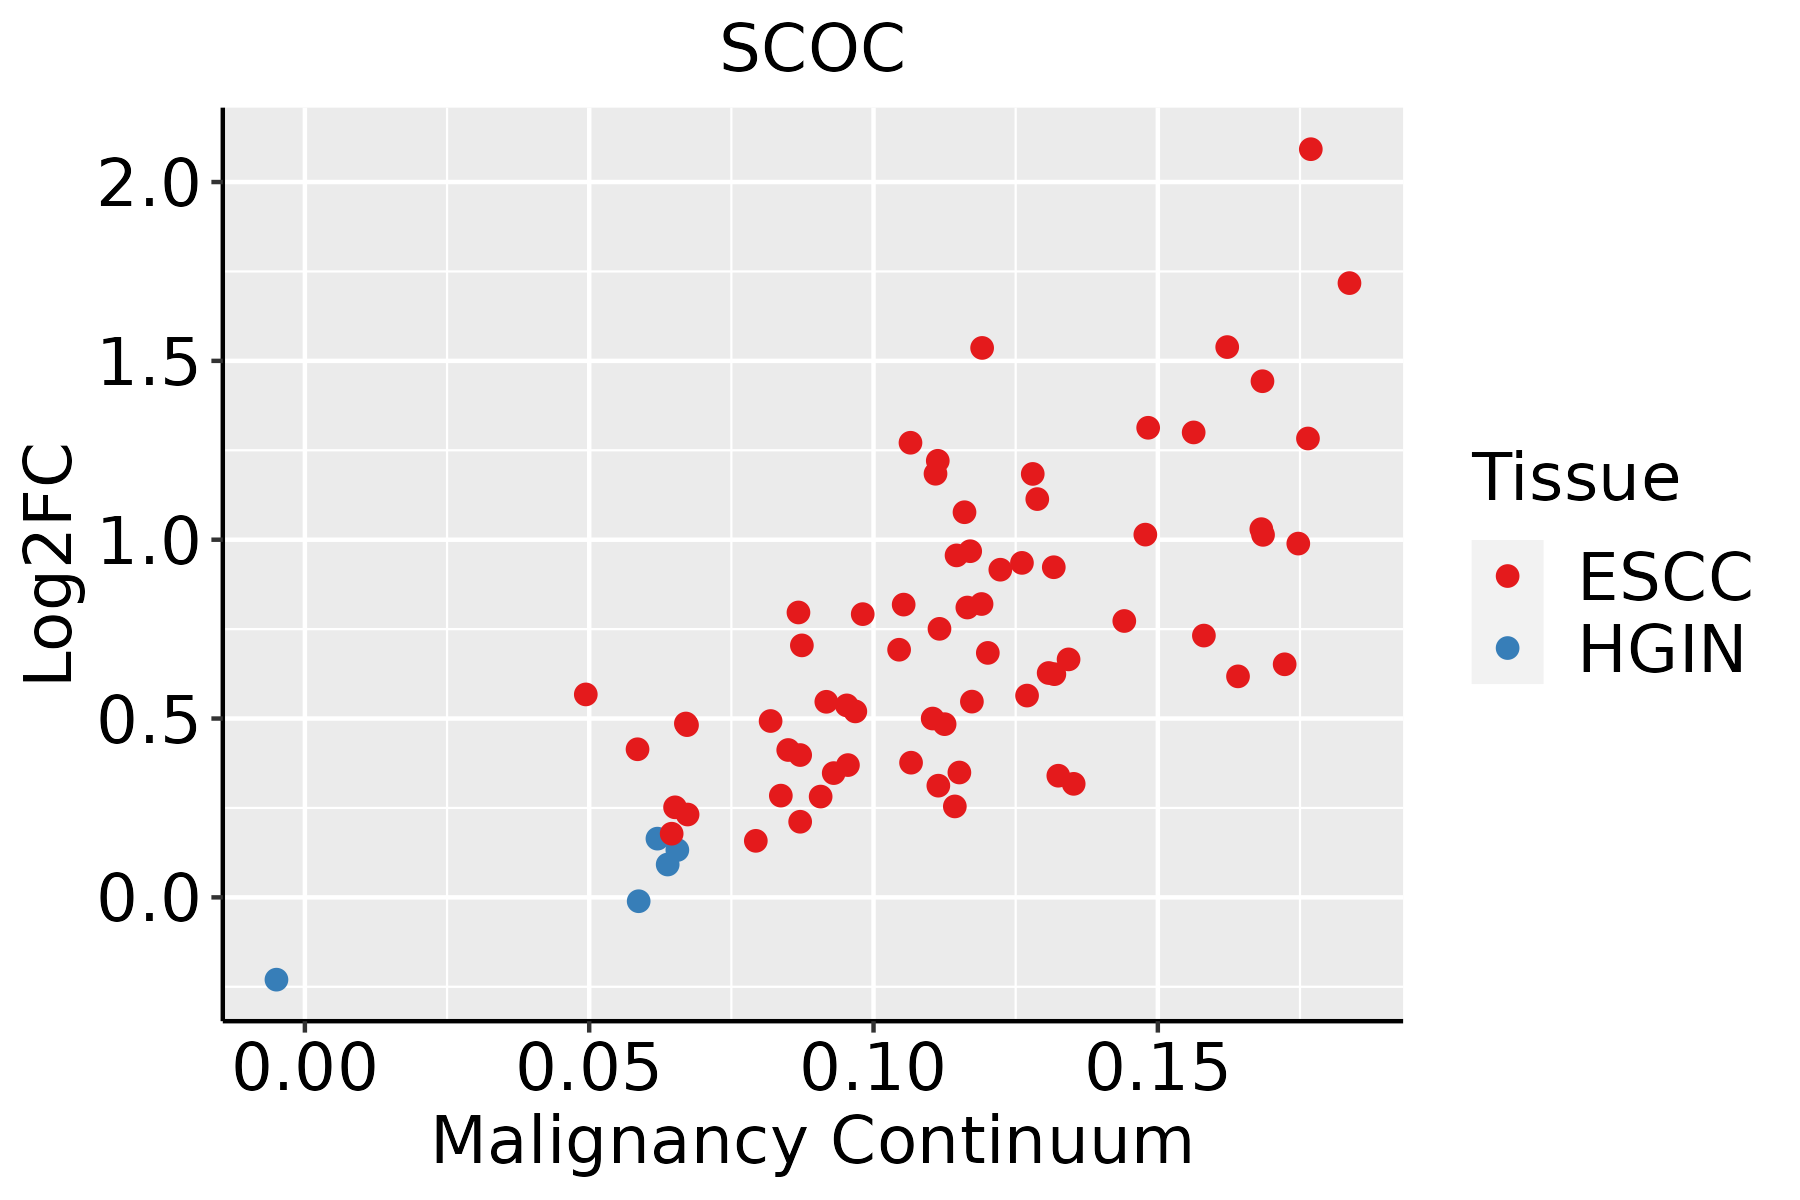
ESCC: Esophageal squamous cell carcinoma
HGIN: High-grade intraepithelial neoplasias
LGIN: Low-grade intraepithelial neoplasias
LiverThe image shows the transcriptomic changes along malignancy continuum.log2FC in expression of this searched gene in stem-like cells from each diseased tissue sample relative to stem-like cells in normal samples in each tissue plotted against the malignancy continuum. Samples are colored based on if they are from different disease stage.
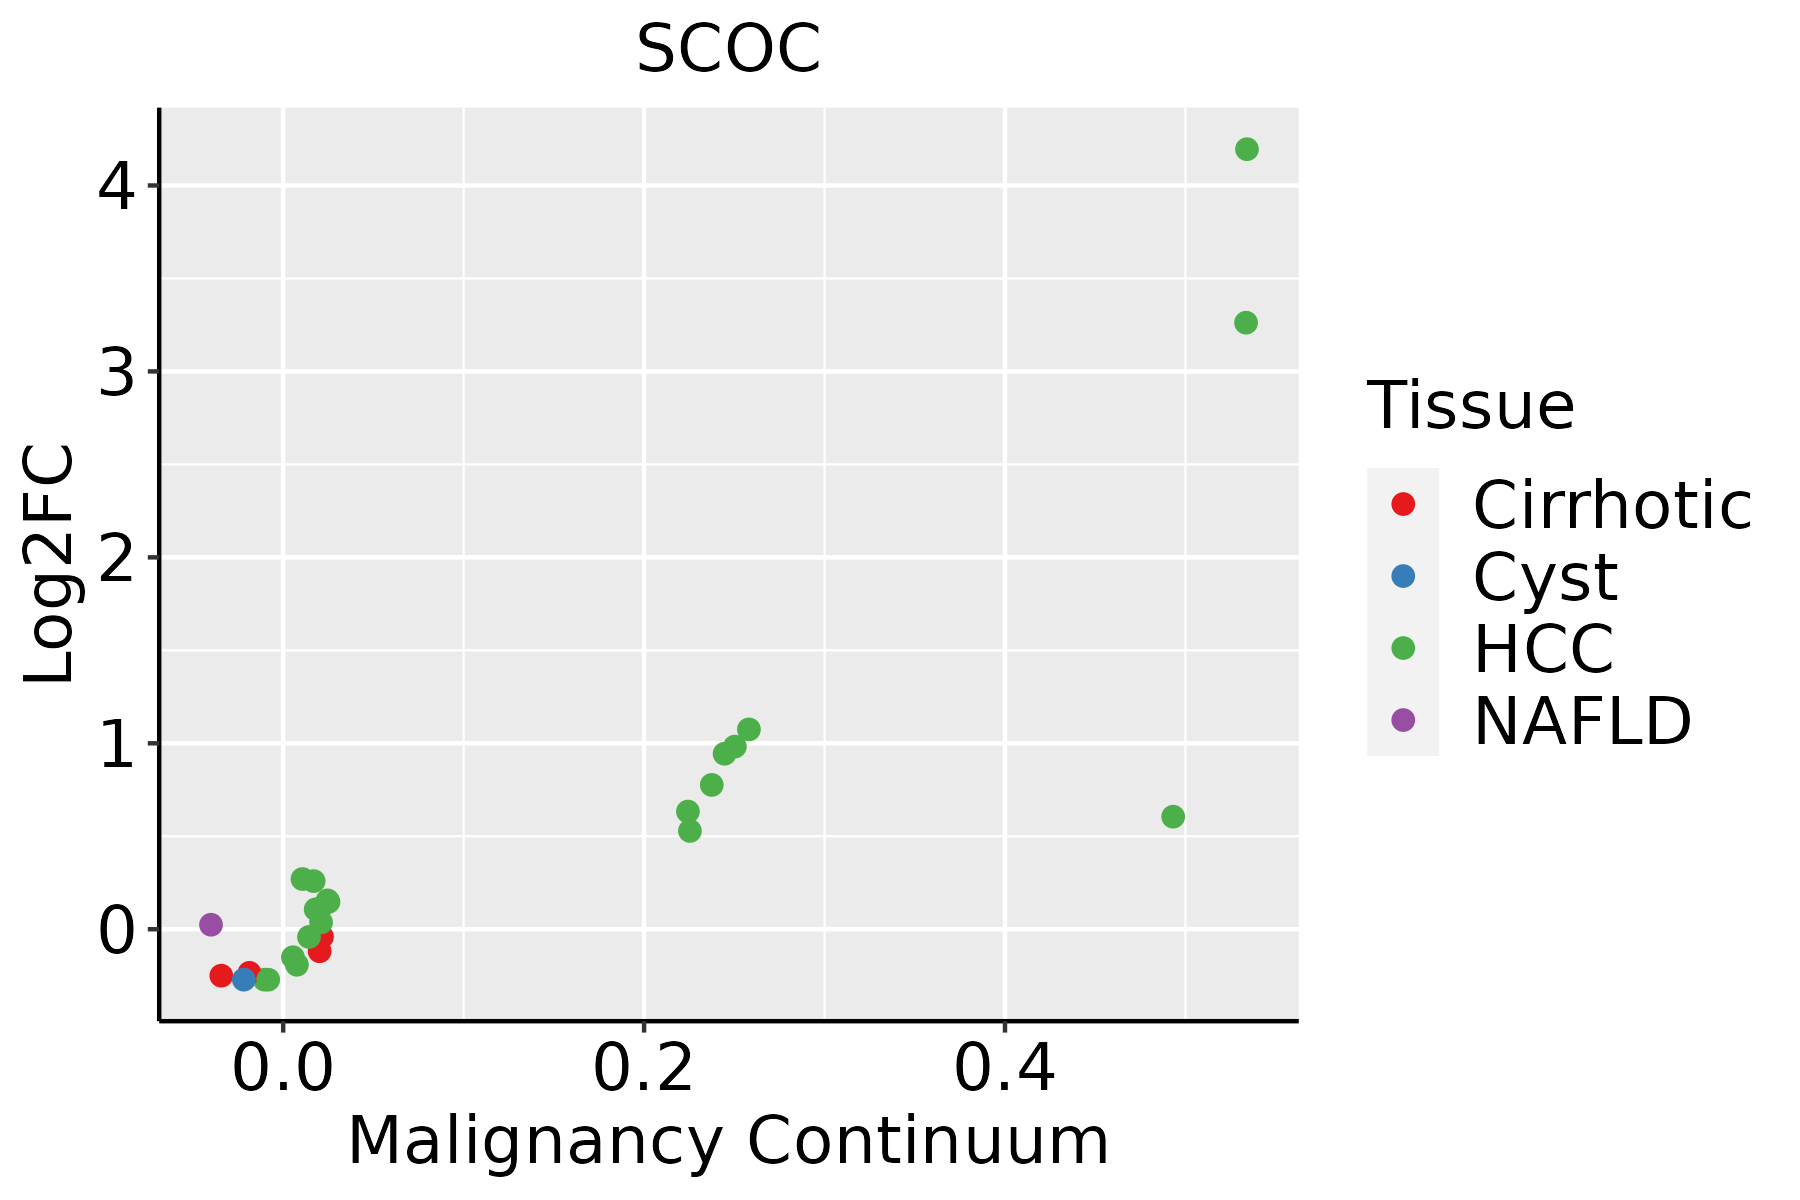
HCC: Hepatocellular carcinoma
NAFLD: Non-alcoholic fatty liver disease
Oral CavityThe image shows the transcriptomic changes along malignancy continuum.log2FC in expression of this searched gene in stem-like cells from each diseased tissue sample relative to stem-like cells in normal samples in each tissue plotted against the malignancy continuum. Samples are colored based on if they are from different disease stage.EOLP: Erosive Oral lichen planus
LP: leukoplakia
NEOLP: Non-erosive oral lichen planus
OSCC: Oral squamous cell carcinoma
ProstateThe image shows the transcriptomic changes along malignancy continuum.log2FC in expression of this searched gene in stem-like cells from each diseased tissue sample relative to stem-like cells in normal samples in each tissue plotted against the malignancy continuum. Samples are colored based on if they are from different disease stage.
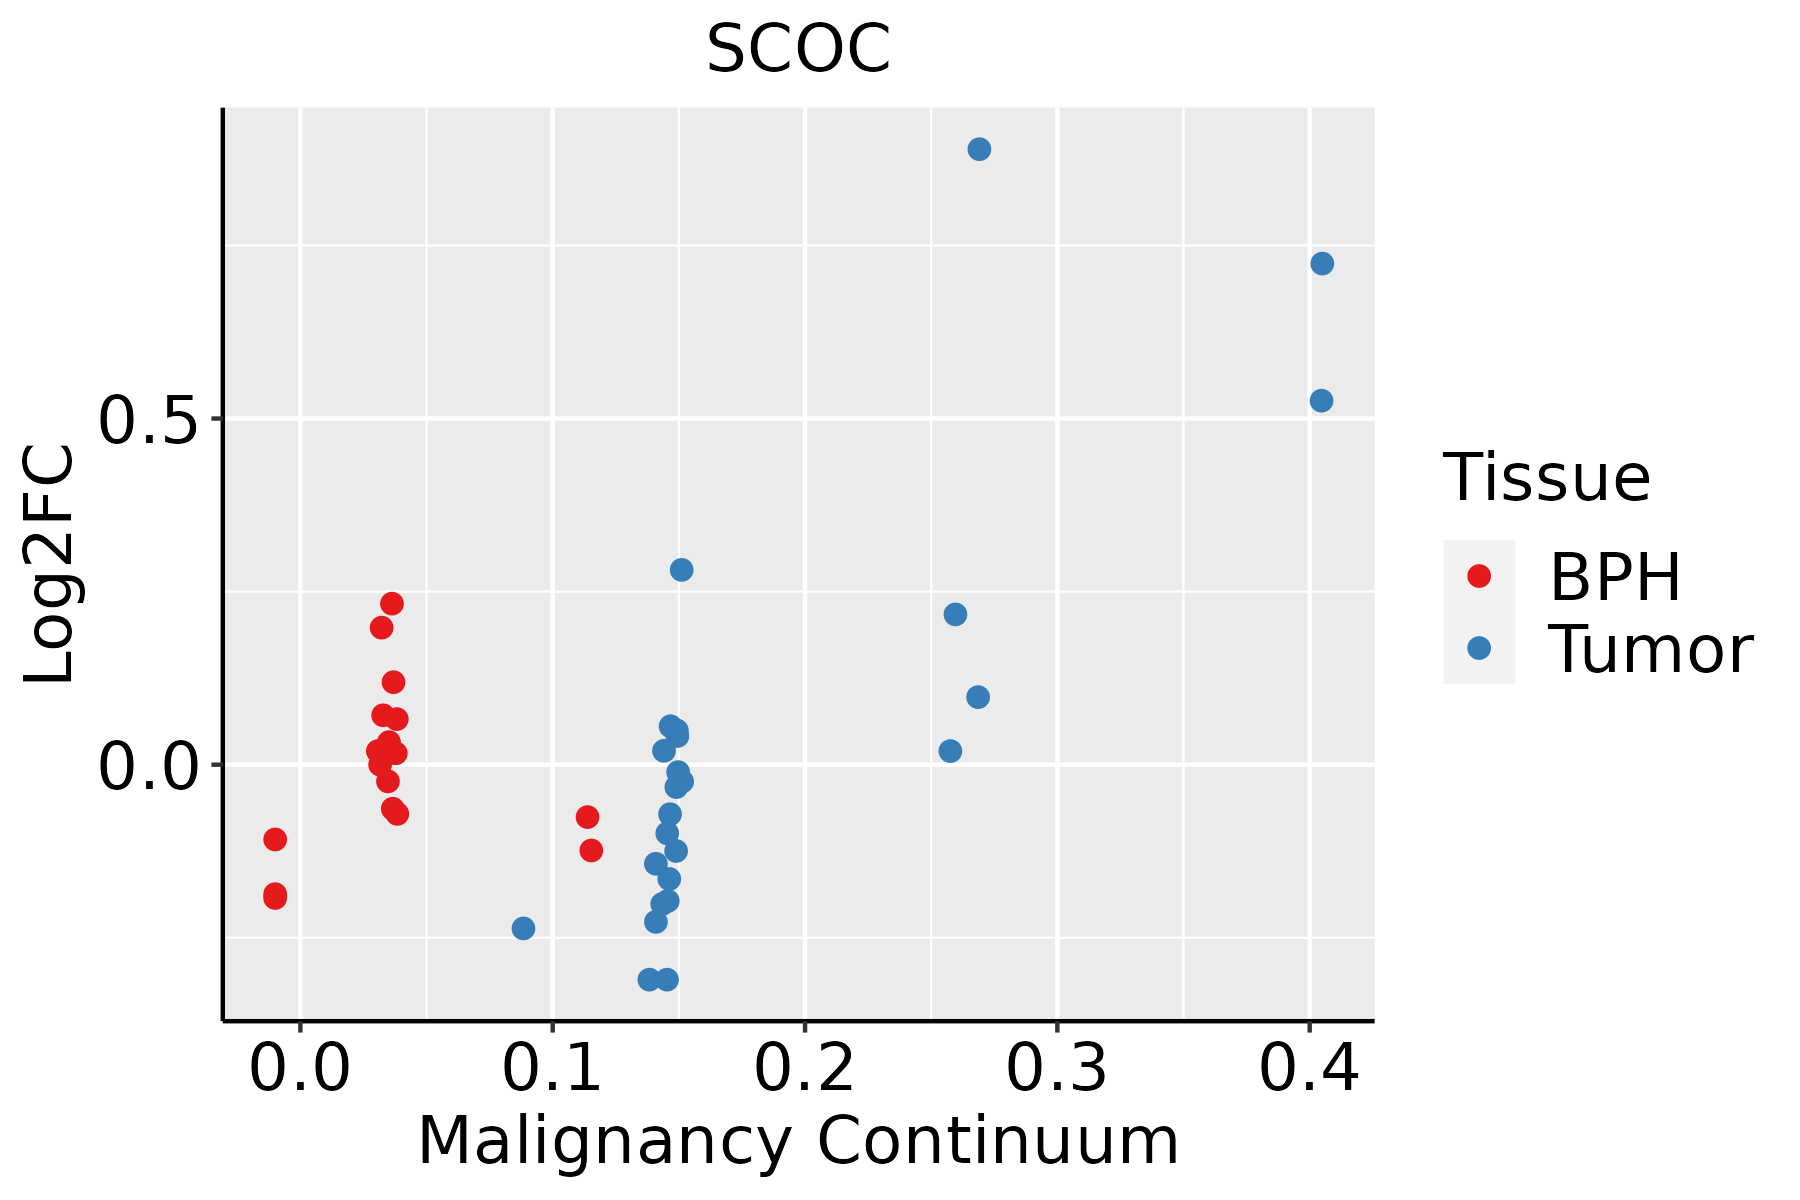
BPH: Benign Prostatic Hyperplasia
SkinThe image shows the transcriptomic changes along malignancy continuum.log2FC in expression of this searched gene in stem-like cells from each diseased tissue sample relative to stem-like cells in normal samples in each tissue plotted against the malignancy continuum. Samples are colored based on if they are from different disease stage.AK: Actinic keratosis
cSCC: Cutaneous squamous cell carcinoma
SCCIS:squamous cell carcinoma in situ
ThyroidThe image shows the transcriptomic changes along malignancy continuum.log2FC in expression of this searched gene in stem-like cells from each diseased tissue sample relative to stem-like cells in normal samples in each tissue plotted against the malignancy continuum. Samples are colored based on if they are from different disease stage.
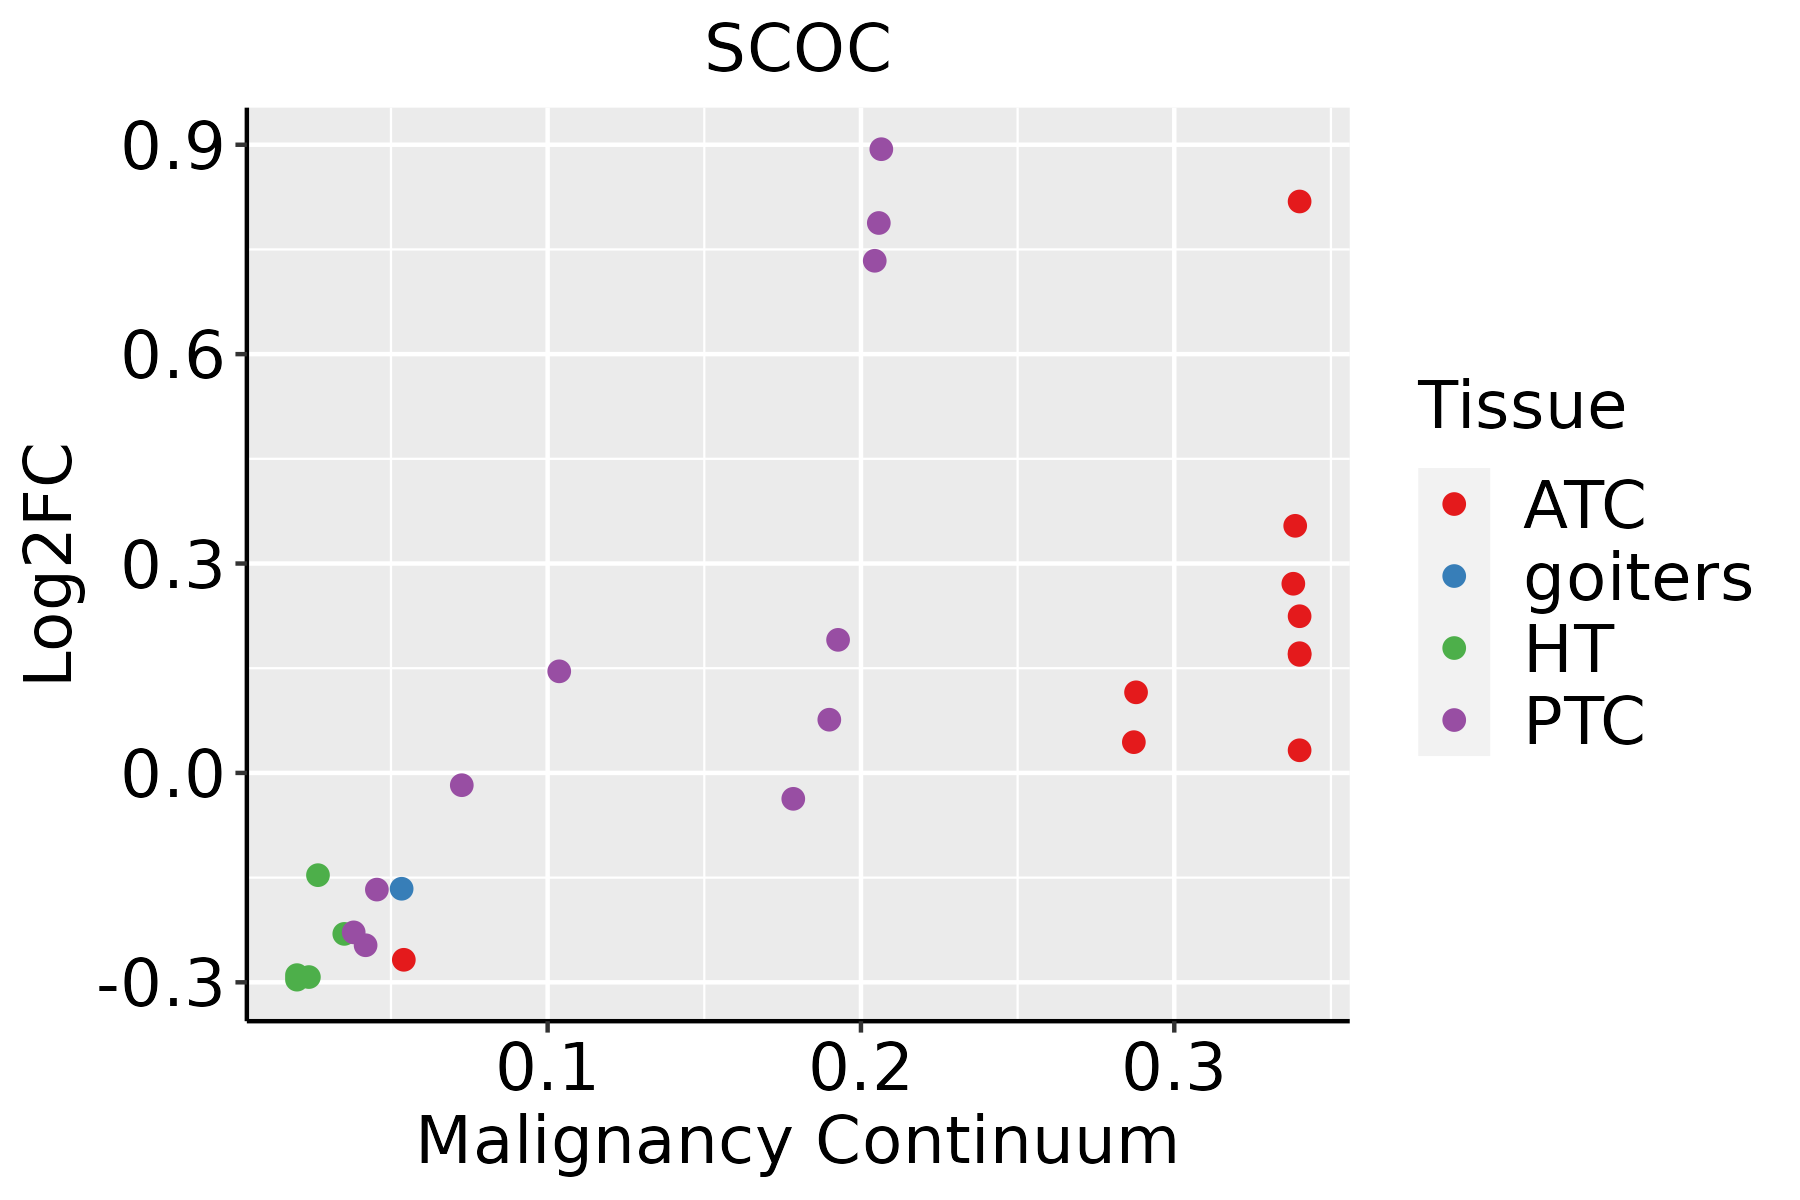
ATC: Anaplastic thyroid cancer
HT: Hashimoto's thyroiditis
PTC: Papillary thyroid cancer
∗log2FC in expression of this searched gene in stem-like cells from each diseased tissue sample relative to stem-like cells in normal samples in each tissue plotted against the malignancy continuum. Samples are colored based on if they are from different disease stage.

Top

Malignant transformation related pathway analysis

check buttonFind out the enriched GO biological processes and KEGG pathways involved in transition from healthy to precancer to cancer
check button Figure of enriched GO biological processes.
TissueDisease StageEnriched GO biological Processes
ColorectumADGO analysis - Figure of enriched GO biological processes: Top 15 enriched GO BP terms are showed in the bar plot of each disease state in each tissue. Each row represents a significant GO biological process which is colored according to the -log10(p.adjust).
ColorectumSERGO analysis - Figure of enriched GO biological processes: Top 15 enriched GO BP terms are showed in the bar plot of each disease state in each tissue. Each row represents a significant GO biological process which is colored according to the -log10(p.adjust).
ColorectumMSSGO analysis - Figure of enriched GO biological processes: Top 15 enriched GO BP terms are showed in the bar plot of each disease state in each tissue. Each row represents a significant GO biological process which is colored according to the -log10(p.adjust).
ColorectumMSI-HGO analysis - Figure of enriched GO biological processes: Top 15 enriched GO BP terms are showed in the bar plot of each disease state in each tissue. Each row represents a significant GO biological process which is colored according to the -log10(p.adjust).
ColorectumFAPGO analysis - Figure of enriched GO biological processes: Top 15 enriched GO BP terms are showed in the bar plot of each disease state in each tissue. Each row represents a significant GO biological process which is colored according to the -log10(p.adjust).
∗Top 15 enriched GO BP terms are showed in the bar plot of each disease state in each tissue. Each row represents a significant GO biological process which is colored according to the -log10(p.adjust).
Page: 1 2 3 4 5 6 7 8 9 

check button Enriched GO biological processes.
GO IDTissueDisease StageDescriptionGene RatioBg Ratiopvaluep.adjustCount
GO:00098969BreastPrecancerpositive regulation of catabolic process48/1080492/187232.62e-043.84e-0348
GO:00313319BreastPrecancerpositive regulation of cellular catabolic process43/1080427/187232.75e-044.00e-0343
GO:000989614BreastIDCpositive regulation of catabolic process62/1434492/187237.06e-051.42e-0362
GO:003133114BreastIDCpositive regulation of cellular catabolic process54/1434427/187231.85e-043.07e-0354
GO:000989624BreastDCISpositive regulation of catabolic process61/1390492/187235.32e-051.09e-0361
GO:003133124BreastDCISpositive regulation of cellular catabolic process54/1390427/187238.34e-051.58e-0354
GO:000989626EsophagusHGINpositive regulation of catabolic process126/2587492/187231.46e-122.09e-10126
GO:003133126EsophagusHGINpositive regulation of cellular catabolic process112/2587427/187235.15e-126.72e-10112
GO:001050616EsophagusHGINregulation of autophagy84/2587317/187231.39e-091.08e-0784
GO:001623616EsophagusHGINmacroautophagy77/2587291/187237.15e-094.61e-0777
GO:00162418EsophagusHGINregulation of macroautophagy38/2587141/187232.80e-057.21e-0438
GO:00105088EsophagusHGINpositive regulation of autophagy28/2587124/187235.34e-034.39e-0228
GO:001623617EsophagusESCCmacroautophagy216/8552291/187231.94e-234.57e-21216
GO:0009896111EsophagusESCCpositive regulation of catabolic process332/8552492/187234.36e-239.22e-21332
GO:0031331111EsophagusESCCpositive regulation of cellular catabolic process292/8552427/187238.67e-221.53e-19292
GO:001050617EsophagusESCCregulation of autophagy220/8552317/187236.72e-186.36e-16220
GO:001624114EsophagusESCCregulation of macroautophagy102/8552141/187231.09e-103.27e-09102
GO:001050816EsophagusESCCpositive regulation of autophagy81/8552124/187237.74e-067.65e-0581
GO:00162394EsophagusESCCpositive regulation of macroautophagy41/855263/187231.48e-036.99e-0341
GO:000989612LiverCirrhoticpositive regulation of catabolic process215/4634492/187231.13e-203.56e-18215
Page: 1 2 3 4 

check button Enriched KEGG pathways.
Pathway IDTissueDisease StageDescriptionGene RatioBg Ratiopvaluep.adjustqvalueCount
Page: 1 

Top

Cell-cell communication analysis

check buttonIdentification of potential cell-cell interactions between two cell types and their ligand-receptor pairs for different disease states
LigandReceptorLRpairPathwayTissueDisease Stage
Page: 1 

Top

Single-cell gene regulatory network inference analysis

check buttonFind out the significant the regulons (TFs) and the target genes of each regulon across cell types for different disease states
TFCell TypeTissueDisease StageTarget GeneRSSRegulon Activity
∗The dot plots of a searched regulon are shown for all cell subpopulations in each disease state of each tissue based on the regulon specific score inferred using pySCENIC and by calculating the average expression.
Page: 1 

Top

Somatic mutation of malignant transformation related genes

check buttonAnnotation of somatic variants for genes involved in malignant transformation
Hugo SymbolVariant ClassVariant ClassificationdbSNP RSHGVScHGVSpHGVSp ShortSWISSPROTBIOTYPESIFTPolyPhenTumor Sample BarcodeTissueHistologySexAgeStageTherapy TypesDrugsOutcome
SCOCSNVMissense_Mutationc.389N>Tp.Ser130Leup.S130LQ9UIL1protein_codingdeleterious(0)probably_damaging(0.998)TCGA-AC-A23H-01Breastbreast invasive carcinomaFemale>=65I/IIUnknownUnknownPD
SCOCSNVMissense_Mutationc.194N>Tp.Arg65Ilep.R65IQ9UIL1protein_codingdeleterious(0.01)benign(0.307)TCGA-AZ-4315-01Colorectumcolon adenocarcinomaMale<65I/IIUnknownUnknownSD
SCOCSNVMissense_Mutationc.145G>Ap.Ala49Thrp.A49TQ9UIL1protein_codingtolerated_low_confidence(0.42)benign(0.011)TCGA-F4-6570-01Colorectumcolon adenocarcinomaFemale>=65I/IIUnknownUnknownSD
SCOCSNVMissense_Mutationc.194N>Tp.Arg65Ilep.R65IQ9UIL1protein_codingdeleterious(0.01)benign(0.307)TCGA-B5-A0JY-01Endometriumuterine corpus endometrioid carcinomaFemale<65III/IVChemotherapydoxorubicinSD
SCOCSNVMissense_Mutationnovelc.424C>Ap.Leu142Ilep.L142IQ9UIL1protein_codingdeleterious(0.01)probably_damaging(0.998)TCGA-B5-A1MR-01Endometriumuterine corpus endometrioid carcinomaFemale>=65III/IVUnknownUnknownSD
SCOCSNVMissense_Mutationc.194G>Tp.Arg65Ilep.R65IQ9UIL1protein_codingdeleterious(0.01)benign(0.307)TCGA-E6-A1LX-01Endometriumuterine corpus endometrioid carcinomaFemale<65I/IIUnknownUnknownSD
SCOCSNVMissense_Mutationnovelc.467N>Ap.Ser156Asnp.S156NQ9UIL1protein_codingdeleterious_low_confidence(0.03)probably_damaging(0.966)TCGA-FI-A2D5-01Endometriumuterine corpus endometrioid carcinomaFemale<65III/IVChemotherapycarboplatinumPD
SCOCSNVMissense_Mutationnovelc.101N>Ap.Ser34Asnp.S34NQ9UIL1protein_codingtolerated_low_confidence(0.15)benign(0.027)TCGA-SJ-A6ZI-01Endometriumuterine corpus endometrioid carcinomaFemale<65I/IIUnknownUnknownSD
SCOCSNVMissense_Mutationnovelc.89N>Ap.Arg30Glnp.R30QQ9UIL1protein_codingtolerated_low_confidence(0.11)benign(0.003)TCGA-DD-AACT-01Liverliver hepatocellular carcinomaFemale>=65I/IIUnknownUnknownSD
SCOCdeletionFrame_Shift_Delnovelc.45_54delCTGGGACGGGp.Gly18SerfsTer58p.G18Sfs*58Q9UIL1protein_codingTCGA-WJ-A86L-01Liverliver hepatocellular carcinomaFemale>=65I/IIUnknownUnknownSD
Page: 1 2 

Top

Related drugs of malignant transformation related genes

check buttonIdentification of chemicals and drugs interact with genes involved in malignant transfromation
(DGIdb 4.0)
Entrez IDSymbolCategoryInteraction TypesDrug Claim NameDrug NamePMIDs
Page: 1