
|
|||||
|
 | |
| |
| |
| |
| |
| |
|
Gene: SCO2 |
Gene summary for SCO2 |
| Gene information | Species | Human | Gene symbol | SCO2 | Gene ID | 9997 |
| Gene name | synthesis of cytochrome C oxidase 2 | |
| Gene Alias | CEMCOX1 | |
| Cytomap | 22q13.33 | |
| Gene Type | protein-coding | GO ID | GO:0001654 | UniProtAcc | O43819 |
Top |
Malignant transformation analysis |
| Identification of the aberrant gene expression in precancerous and cancerous lesions by comparing the gene expression of stem-like cells in diseased tissues with normal stem cells |
| Entrez ID | Symbol | Replicates | Species | Organ | Tissue | Adj P-value | Log2FC | Malignancy |
| 9997 | SCO2 | LZE4T | Human | Esophagus | ESCC | 4.05e-12 | 1.71e-01 | 0.0811 |
| 9997 | SCO2 | LZE7T | Human | Esophagus | ESCC | 2.45e-10 | 3.85e-01 | 0.0667 |
| 9997 | SCO2 | LZE8T | Human | Esophagus | ESCC | 4.21e-08 | 1.62e-01 | 0.067 |
| 9997 | SCO2 | LZE20T | Human | Esophagus | ESCC | 1.15e-07 | 1.87e-01 | 0.0662 |
| 9997 | SCO2 | LZE24T | Human | Esophagus | ESCC | 1.84e-16 | 5.87e-01 | 0.0596 |
| 9997 | SCO2 | LZE21T | Human | Esophagus | ESCC | 3.48e-08 | 5.61e-01 | 0.0655 |
| 9997 | SCO2 | P1T-E | Human | Esophagus | ESCC | 3.23e-16 | 8.46e-01 | 0.0875 |
| 9997 | SCO2 | P2T-E | Human | Esophagus | ESCC | 1.61e-23 | 3.83e-01 | 0.1177 |
| 9997 | SCO2 | P4T-E | Human | Esophagus | ESCC | 3.23e-21 | 6.60e-01 | 0.1323 |
| 9997 | SCO2 | P5T-E | Human | Esophagus | ESCC | 8.50e-20 | 4.12e-01 | 0.1327 |
| 9997 | SCO2 | P8T-E | Human | Esophagus | ESCC | 1.38e-11 | 1.93e-01 | 0.0889 |
| 9997 | SCO2 | P9T-E | Human | Esophagus | ESCC | 1.16e-29 | 7.19e-01 | 0.1131 |
| 9997 | SCO2 | P10T-E | Human | Esophagus | ESCC | 2.96e-15 | 2.69e-01 | 0.116 |
| 9997 | SCO2 | P11T-E | Human | Esophagus | ESCC | 3.90e-16 | 8.36e-01 | 0.1426 |
| 9997 | SCO2 | P12T-E | Human | Esophagus | ESCC | 5.65e-19 | 3.57e-01 | 0.1122 |
| 9997 | SCO2 | P15T-E | Human | Esophagus | ESCC | 1.82e-27 | 3.84e-01 | 0.1149 |
| 9997 | SCO2 | P16T-E | Human | Esophagus | ESCC | 5.17e-21 | 2.99e-01 | 0.1153 |
| 9997 | SCO2 | P17T-E | Human | Esophagus | ESCC | 4.46e-10 | 5.39e-01 | 0.1278 |
| 9997 | SCO2 | P19T-E | Human | Esophagus | ESCC | 1.91e-03 | 5.80e-01 | 0.1662 |
| 9997 | SCO2 | P20T-E | Human | Esophagus | ESCC | 7.45e-18 | 4.75e-01 | 0.1124 |
| Page: 1 2 3 4 5 6 |
| Tissue | Expression Dynamics | Abbreviation |
| Esophagus |  | ESCC: Esophageal squamous cell carcinoma |
| HGIN: High-grade intraepithelial neoplasias | ||
| LGIN: Low-grade intraepithelial neoplasias | ||
| Liver | 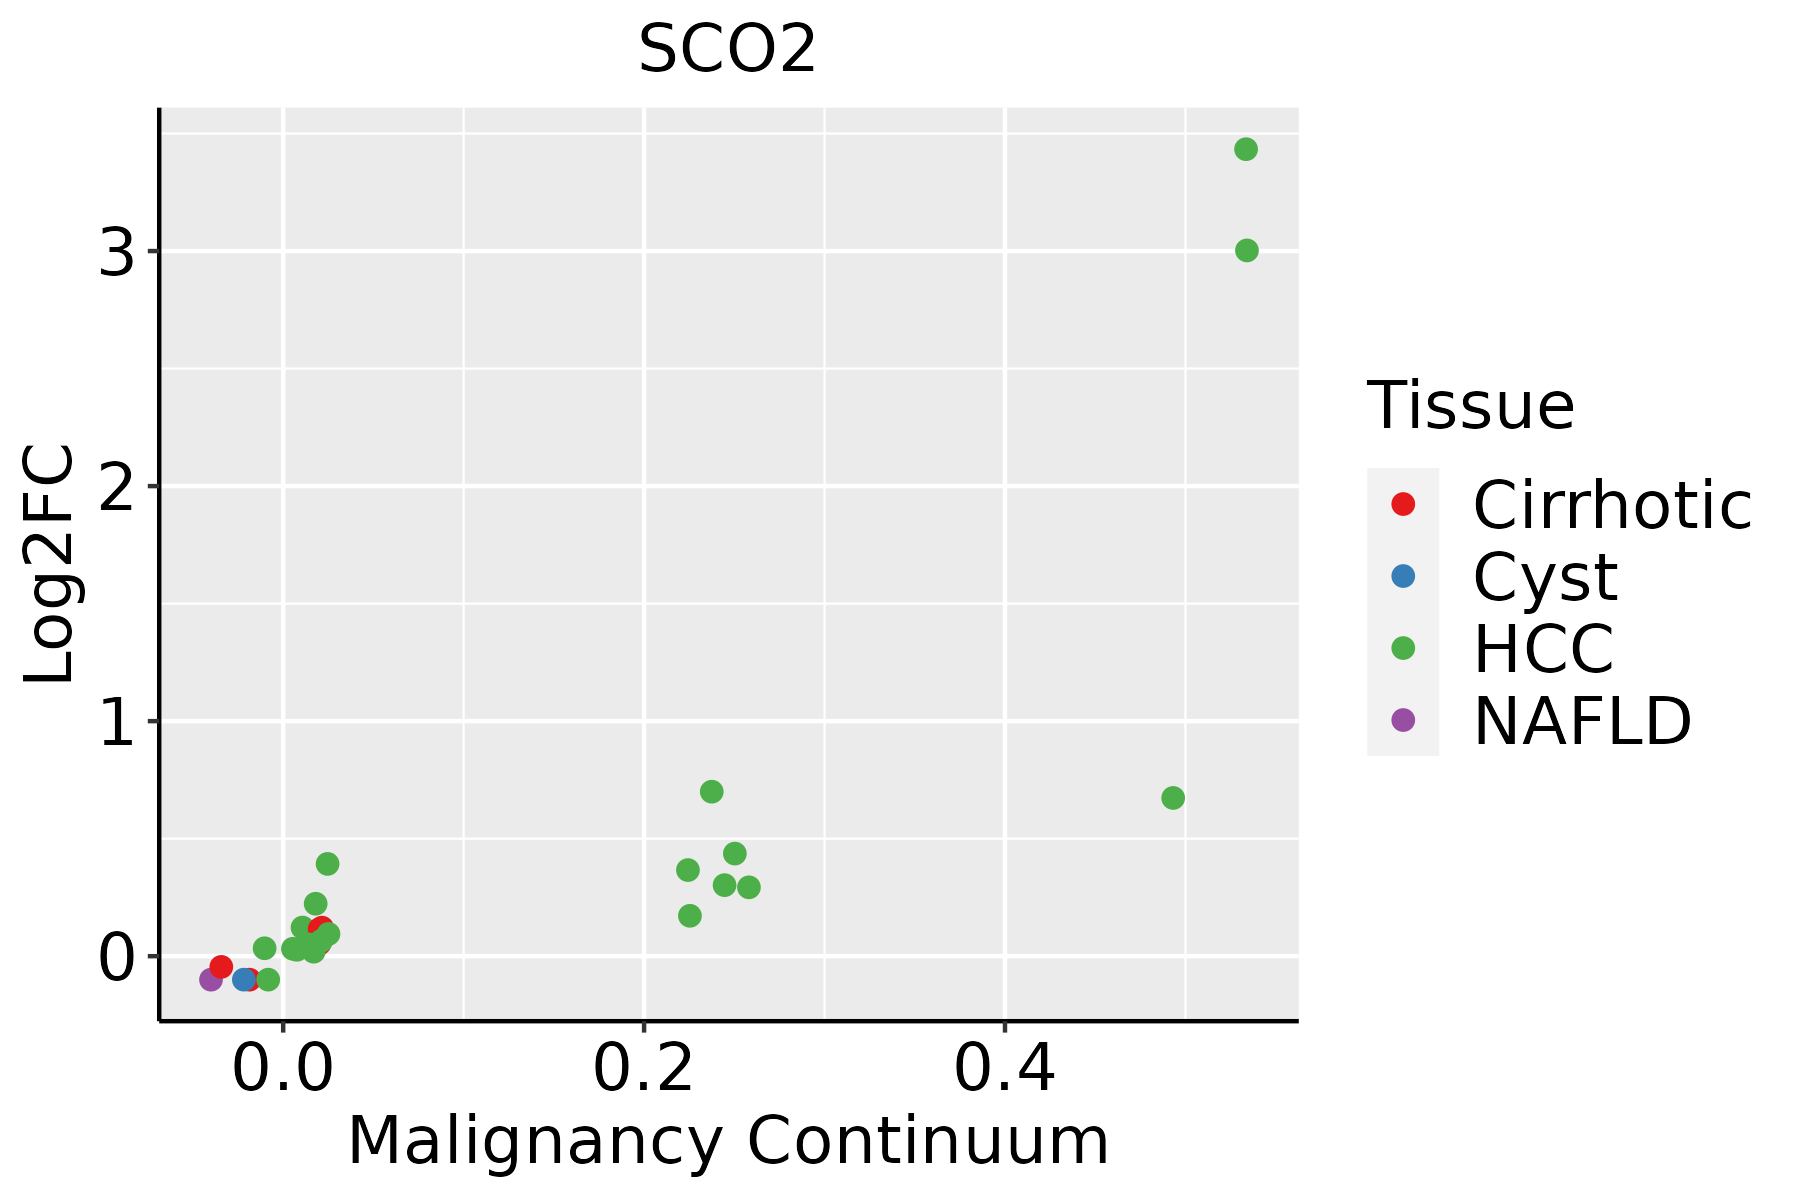 | HCC: Hepatocellular carcinoma |
| NAFLD: Non-alcoholic fatty liver disease | ||
| Oral Cavity | 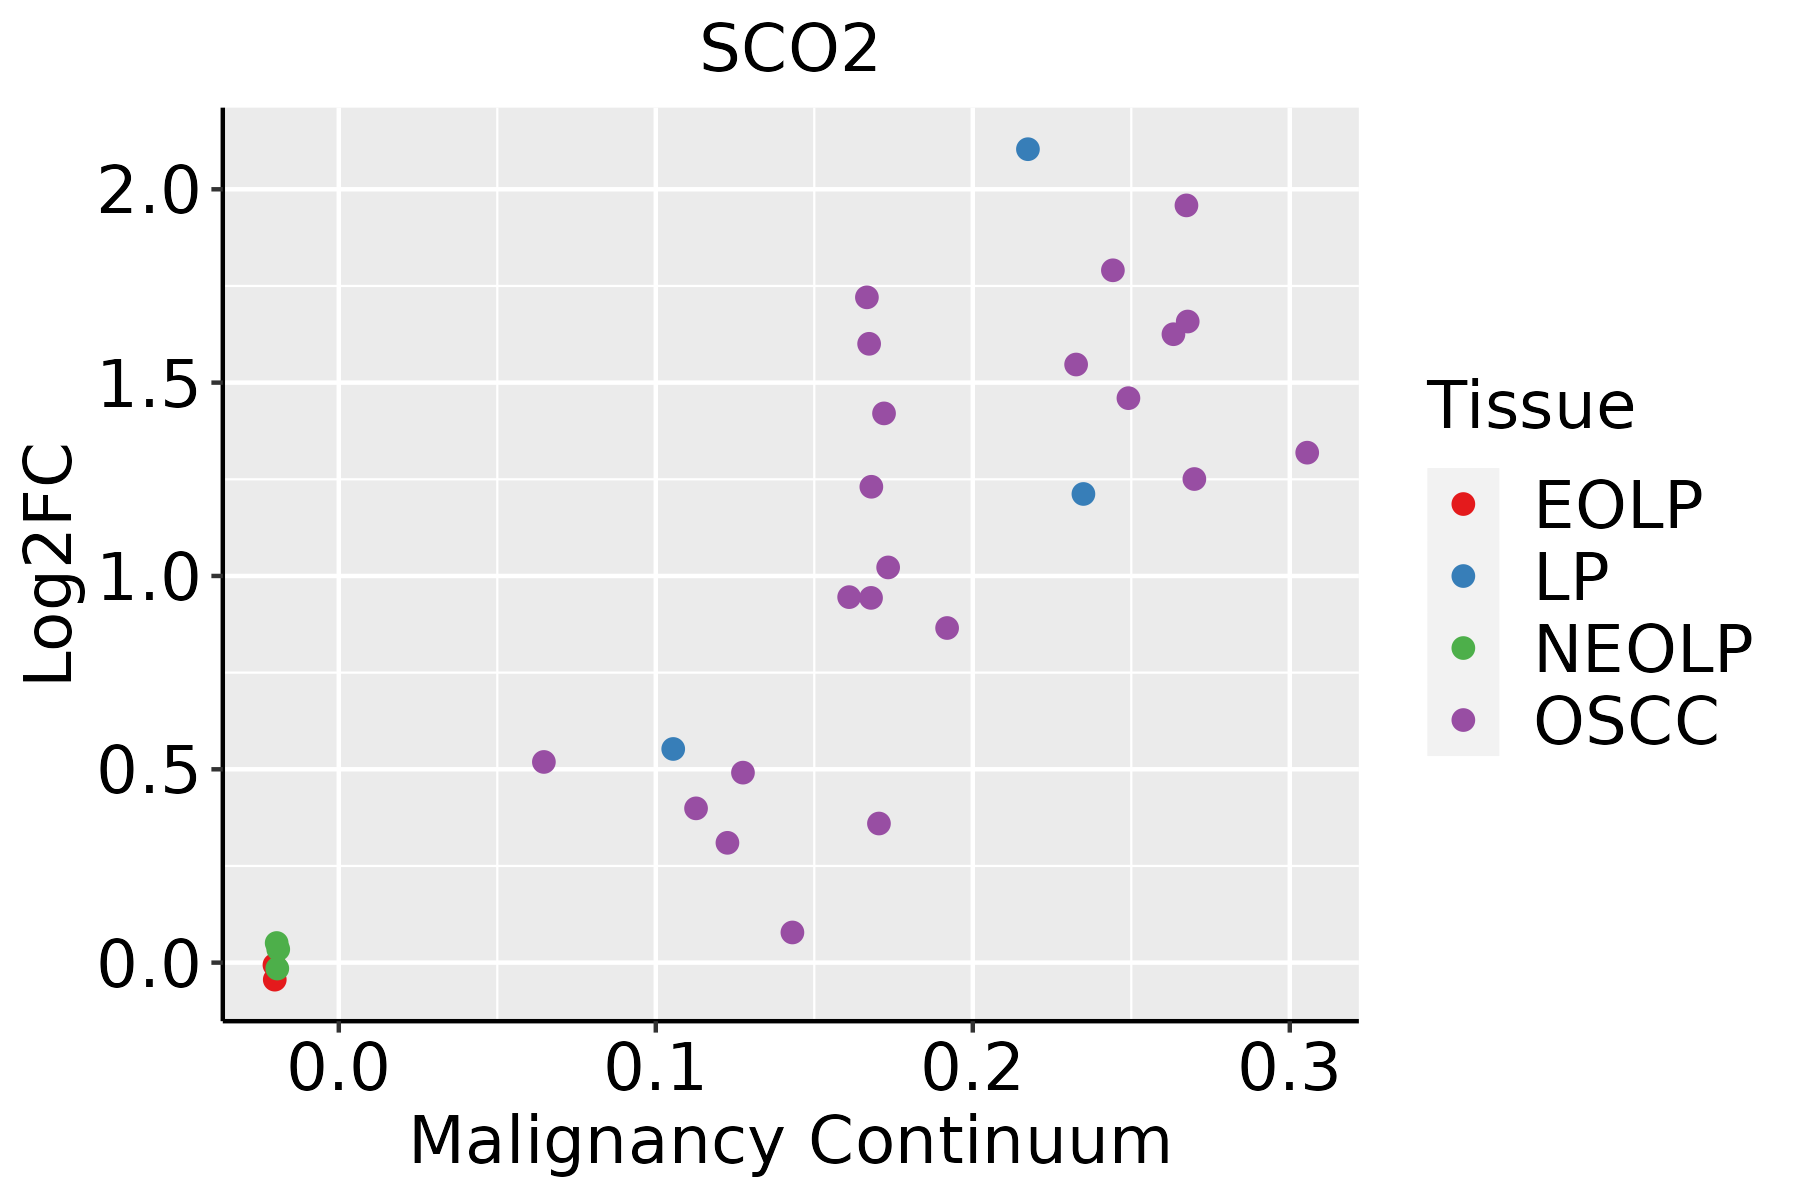 | EOLP: Erosive Oral lichen planus |
| LP: leukoplakia | ||
| NEOLP: Non-erosive oral lichen planus | ||
| OSCC: Oral squamous cell carcinoma | ||
| Skin |  | AK: Actinic keratosis |
| cSCC: Cutaneous squamous cell carcinoma | ||
| SCCIS:squamous cell carcinoma in situ |
| ∗log2FC in expression of this searched gene in stem-like cells from each diseased tissue sample relative to stem-like cells in normal samples in each tissue plotted against the malignancy continuum. Samples are colored based on if they are from different disease stage. |
Top |
Malignant transformation related pathway analysis |
| Find out the enriched GO biological processes and KEGG pathways involved in transition from healthy to precancer to cancer |
| Tissue | Disease Stage | Enriched GO biological Processes |
| Colorectum | AD |  |
| Colorectum | SER |  |
| Colorectum | MSS |  |
| Colorectum | MSI-H |  |
| Colorectum | FAP |  |
| ∗Top 15 enriched GO BP terms are showed in the bar plot of each disease state in each tissue. Each row represents a significant GO biological process which is colored according to the -log10(p.adjust). |
| Page: 1 2 3 4 5 6 7 8 9 |
| GO ID | Tissue | Disease Stage | Description | Gene Ratio | Bg Ratio | pvalue | p.adjust | Count |
| GO:0006091110 | Esophagus | ESCC | generation of precursor metabolites and energy | 331/8552 | 490/18723 | 3.86e-23 | 8.45e-21 | 331 |
| GO:0045333110 | Esophagus | ESCC | cellular respiration | 173/8552 | 230/18723 | 4.53e-20 | 5.99e-18 | 173 |
| GO:0033108110 | Esophagus | ESCC | mitochondrial respiratory chain complex assembly | 83/8552 | 93/18723 | 9.56e-19 | 1.05e-16 | 83 |
| GO:0015980110 | Esophagus | ESCC | energy derivation by oxidation of organic compounds | 220/8552 | 318/18723 | 1.20e-17 | 1.09e-15 | 220 |
| GO:0022900110 | Esophagus | ESCC | electron transport chain | 133/8552 | 175/18723 | 2.18e-16 | 1.67e-14 | 133 |
| GO:000170119 | Esophagus | ESCC | in utero embryonic development | 243/8552 | 367/18723 | 1.00e-15 | 6.86e-14 | 243 |
| GO:0022904110 | Esophagus | ESCC | respiratory electron transport chain | 89/8552 | 114/18723 | 1.36e-12 | 5.80e-11 | 89 |
| GO:001700413 | Esophagus | ESCC | cytochrome complex assembly | 34/8552 | 36/18723 | 5.08e-10 | 1.31e-08 | 34 |
| GO:000853512 | Esophagus | ESCC | respiratory chain complex IV assembly | 24/8552 | 26/18723 | 6.87e-07 | 8.99e-06 | 24 |
| GO:003361712 | Esophagus | ESCC | mitochondrial cytochrome c oxidase assembly | 21/8552 | 22/18723 | 8.75e-07 | 1.13e-05 | 21 |
| GO:005507617 | Esophagus | ESCC | transition metal ion homeostasis | 87/8552 | 138/18723 | 2.85e-05 | 2.37e-04 | 87 |
| GO:00469169 | Esophagus | ESCC | cellular transition metal ion homeostasis | 70/8552 | 115/18723 | 7.28e-04 | 3.79e-03 | 70 |
| GO:00550703 | Esophagus | ESCC | copper ion homeostasis | 15/8552 | 18/18723 | 1.20e-03 | 5.88e-03 | 15 |
| GO:00068781 | Esophagus | ESCC | cellular copper ion homeostasis | 12/8552 | 15/18723 | 7.31e-03 | 2.63e-02 | 12 |
| GO:000609112 | Liver | Cirrhotic | generation of precursor metabolites and energy | 238/4634 | 490/18723 | 6.85e-31 | 1.07e-27 | 238 |
| GO:002290012 | Liver | Cirrhotic | electron transport chain | 111/4634 | 175/18723 | 1.94e-27 | 1.52e-24 | 111 |
| GO:00229047 | Liver | Cirrhotic | respiratory electron transport chain | 77/4634 | 114/18723 | 5.84e-22 | 2.29e-19 | 77 |
| GO:00453337 | Liver | Cirrhotic | cellular respiration | 122/4634 | 230/18723 | 2.15e-20 | 6.43e-18 | 122 |
| GO:001598012 | Liver | Cirrhotic | energy derivation by oxidation of organic compounds | 154/4634 | 318/18723 | 3.11e-20 | 8.87e-18 | 154 |
| GO:00331087 | Liver | Cirrhotic | mitochondrial respiratory chain complex assembly | 64/4634 | 93/18723 | 3.85e-19 | 7.79e-17 | 64 |
| Page: 1 2 3 4 5 |
| Pathway ID | Tissue | Disease Stage | Description | Gene Ratio | Bg Ratio | pvalue | p.adjust | qvalue | Count |
| hsa0523018 | Esophagus | ESCC | Central carbon metabolism in cancer | 50/4205 | 70/8465 | 1.70e-04 | 6.62e-04 | 3.39e-04 | 50 |
| hsa0523019 | Esophagus | ESCC | Central carbon metabolism in cancer | 50/4205 | 70/8465 | 1.70e-04 | 6.62e-04 | 3.39e-04 | 50 |
| hsa052308 | Liver | Cirrhotic | Central carbon metabolism in cancer | 30/2530 | 70/8465 | 1.41e-02 | 4.35e-02 | 2.68e-02 | 30 |
| hsa0523011 | Liver | Cirrhotic | Central carbon metabolism in cancer | 30/2530 | 70/8465 | 1.41e-02 | 4.35e-02 | 2.68e-02 | 30 |
| hsa0523021 | Liver | HCC | Central carbon metabolism in cancer | 43/4020 | 70/8465 | 1.30e-02 | 3.19e-02 | 1.78e-02 | 43 |
| hsa0523031 | Liver | HCC | Central carbon metabolism in cancer | 43/4020 | 70/8465 | 1.30e-02 | 3.19e-02 | 1.78e-02 | 43 |
| hsa0523016 | Oral cavity | OSCC | Central carbon metabolism in cancer | 49/3704 | 70/8465 | 7.57e-06 | 3.59e-05 | 1.83e-05 | 49 |
| hsa0523017 | Oral cavity | OSCC | Central carbon metabolism in cancer | 49/3704 | 70/8465 | 7.57e-06 | 3.59e-05 | 1.83e-05 | 49 |
| hsa0523023 | Oral cavity | LP | Central carbon metabolism in cancer | 31/2418 | 70/8465 | 3.50e-03 | 1.46e-02 | 9.40e-03 | 31 |
| hsa0523033 | Oral cavity | LP | Central carbon metabolism in cancer | 31/2418 | 70/8465 | 3.50e-03 | 1.46e-02 | 9.40e-03 | 31 |
| Page: 1 |
Top |
Cell-cell communication analysis |
| Identification of potential cell-cell interactions between two cell types and their ligand-receptor pairs for different disease states |
| Ligand | Receptor | LRpair | Pathway | Tissue | Disease Stage |
| Page: 1 |
Top |
Single-cell gene regulatory network inference analysis |
| Find out the significant the regulons (TFs) and the target genes of each regulon across cell types for different disease states |
| TF | Cell Type | Tissue | Disease Stage | Target Gene | RSS | Regulon Activity |
| ∗The dot plots of a searched regulon are shown for all cell subpopulations in each disease state of each tissue based on the regulon specific score inferred using pySCENIC and by calculating the average expression. |
| Page: 1 |
Top |
Somatic mutation of malignant transformation related genes |
| Annotation of somatic variants for genes involved in malignant transformation |
| Hugo Symbol | Variant Class | Variant Classification | dbSNP RS | HGVSc | HGVSp | HGVSp Short | SWISSPROT | BIOTYPE | SIFT | PolyPhen | Tumor Sample Barcode | Tissue | Histology | Sex | Age | Stage | Therapy Types | Drugs | Outcome |
| SCO2 | SNV | Missense_Mutation | c.97N>G | p.Leu33Val | p.L33V | O43819 | protein_coding | tolerated(0.62) | benign(0) | TCGA-C5-A1BQ-01 | Cervix | cervical & endocervical cancer | Female | >=65 | III/IV | Chemotherapy | cisplatin | CR | |
| SCO2 | SNV | Missense_Mutation | rs777327176 | c.703N>A | p.Gly235Ser | p.G235S | O43819 | protein_coding | deleterious(0.04) | probably_damaging(1) | TCGA-C5-A7X5-01 | Cervix | cervical & endocervical cancer | Female | >=65 | I/II | Chemotherapy | carboplatin | PD |
| SCO2 | SNV | Missense_Mutation | rs372731740 | c.340N>T | p.Arg114Cys | p.R114C | O43819 | protein_coding | tolerated(0.11) | benign(0.216) | TCGA-DG-A2KJ-01 | Cervix | cervical & endocervical cancer | Female | <65 | III/IV | Chemotherapy | cisplatin | SD |
| SCO2 | SNV | Missense_Mutation | rs764093441 | c.664G>A | p.Val222Met | p.V222M | O43819 | protein_coding | deleterious(0) | probably_damaging(0.996) | TCGA-AA-3710-01 | Colorectum | colon adenocarcinoma | Female | >=65 | I/II | Unknown | Unknown | SD |
| SCO2 | SNV | Missense_Mutation | novel | c.25N>G | p.Thr9Ala | p.T9A | O43819 | protein_coding | tolerated_low_confidence(0.06) | benign(0) | TCGA-AZ-4315-01 | Colorectum | colon adenocarcinoma | Male | <65 | I/II | Unknown | Unknown | SD |
| SCO2 | SNV | Missense_Mutation | rs373674489 | c.284N>A | p.Arg95His | p.R95H | O43819 | protein_coding | tolerated(0.12) | probably_damaging(0.97) | TCGA-D5-6928-01 | Colorectum | colon adenocarcinoma | Male | >=65 | I/II | Unknown | Unknown | SD |
| SCO2 | SNV | Missense_Mutation | rs777154604 | c.617N>A | p.Arg206His | p.R206H | O43819 | protein_coding | deleterious(0) | probably_damaging(0.999) | TCGA-AJ-A2QK-01 | Endometrium | uterine corpus endometrioid carcinoma | Female | >=65 | I/II | Chemotherapy | carboplatin | SD |
| SCO2 | SNV | Missense_Mutation | rs748770403 | c.616C>T | p.Arg206Cys | p.R206C | O43819 | protein_coding | deleterious(0) | probably_damaging(1) | TCGA-AJ-A3BH-01 | Endometrium | uterine corpus endometrioid carcinoma | Female | Unknown | I/II | Unknown | Unknown | SD |
| SCO2 | SNV | Missense_Mutation | rs748362764 | c.520G>A | p.Val174Ile | p.V174I | O43819 | protein_coding | tolerated(0.2) | benign(0.023) | TCGA-AP-A059-01 | Endometrium | uterine corpus endometrioid carcinoma | Female | >=65 | I/II | Unknown | Unknown | SD |
| SCO2 | SNV | Missense_Mutation | novel | c.230N>T | p.Ala77Val | p.A77V | O43819 | protein_coding | tolerated(0.3) | benign(0.005) | TCGA-AP-A1DK-01 | Endometrium | uterine corpus endometrioid carcinoma | Female | <65 | I/II | Unknown | Unknown | SD |
| Page: 1 2 3 |
Top |
Related drugs of malignant transformation related genes |
| Identification of chemicals and drugs interact with genes involved in malignant transfromation |
| (DGIdb 4.0) |
| Entrez ID | Symbol | Category | Interaction Types | Drug Claim Name | Drug Name | PMIDs |
| Page: 1 |

Copyright 2023-Present -The University of Texas Health Science Center at Houston |