Schematic overview of the cellular and molecular mechanisms involved in the cancer progression, including the proposed cellular and molecular mechanisms in cancer cells trajectory. AT1: alveolar type 1 cells; AT2: alveolar type 2 cells; AAH: atypical adenomatous hyperplasia; AIS: adenocarcinoma in situ; MIA: minimally invasive adenocarcinoma; IA: invasive adenocarcinoma; EMT: epithelial-mesenchymal transition

Home

Download

Statistics

Help

Contact

Center for Computational Systems Medicine
leaf

Gene summary

leaf

Malignant transformation analysis

leaf

Malignant transformation related pathway analysis

leaf

Cell-cell communication analysis

leaf

Single-cell gene regulatory network inference analysis

leaf

Somatic mutation of malignant transformation related genes

leaf

Related drugs of malignant transformation related genes

Gene: SCO1

Gene summary for SCO1

check button Gene summary.

Gene informationSpeciesHuman
Gene symbol

SCO1

Gene ID

6341

Gene namesynthesis of cytochrome C oxidase 1
Gene AliasMC4DN4
Cytomap17p13.1
Gene Typeprotein-coding
GO ID

GO:0006873

UniProtAcc

O75880


Top

Malignant transformation analysis

check button Identification of the aberrant gene expression in precancerous and cancerous lesions by comparing the gene expression of stem-like cells in diseased tissues with normal stem cells
check button Malignant transformation involving gene list.
Entrez IDSymbolReplicatesSpeciesOrganTissueAdj P-valueLog2FCMalignancy
6341SCO1HTA11_347_2000001011HumanColorectumAD1.16e-103.28e-01-0.1954
6341SCO1HTA11_1391_2000001011HumanColorectumAD1.76e-021.75e-01-0.059
6341SCO1HTA11_10623_2000001011HumanColorectumAD1.51e-033.92e-01-0.0177
6341SCO1HTA11_99999970781_79442HumanColorectumMSS1.06e-073.92e-010.294
6341SCO1A015-C-203HumanColorectumFAP1.21e-02-8.63e-02-0.1294
6341SCO1LZE2THumanEsophagusESCC1.53e-056.06e-010.082
6341SCO1LZE4THumanEsophagusESCC1.69e-092.15e-010.0811
6341SCO1LZE7THumanEsophagusESCC1.01e-144.30e-010.0667
6341SCO1LZE20THumanEsophagusESCC3.83e-041.51e-010.0662
6341SCO1LZE24THumanEsophagusESCC6.79e-123.57e-010.0596
6341SCO1LZE6THumanEsophagusESCC3.23e-031.58e-010.0845
6341SCO1P1T-EHumanEsophagusESCC1.54e-063.69e-010.0875
6341SCO1P2T-EHumanEsophagusESCC3.27e-173.56e-010.1177
6341SCO1P4T-EHumanEsophagusESCC3.50e-215.74e-010.1323
6341SCO1P5T-EHumanEsophagusESCC2.58e-173.08e-010.1327
6341SCO1P8T-EHumanEsophagusESCC1.99e-163.64e-010.0889
6341SCO1P9T-EHumanEsophagusESCC1.29e-133.10e-010.1131
6341SCO1P10T-EHumanEsophagusESCC1.77e-183.58e-010.116
6341SCO1P11T-EHumanEsophagusESCC1.56e-145.04e-010.1426
6341SCO1P12T-EHumanEsophagusESCC1.80e-214.14e-010.1122
Page: 1 2 3 4 5 6 

check button Transcriptomic changes along malignancy continuum.
TissueExpression DynamicsAbbreviation
Colorectum (GSE201348)The image shows the transcriptomic changes along malignancy continuum.log2FC in expression of this searched gene in stem-like cells from each diseased tissue sample relative to stem-like cells in normal samples in each tissue plotted against the malignancy continuum. Samples are colored based on if they are from different disease stage.FAP: Familial adenomatous polyposis
CRC: Colorectal cancer
Colorectum (HTA11)The image shows the transcriptomic changes along malignancy continuum.log2FC in expression of this searched gene in stem-like cells from each diseased tissue sample relative to stem-like cells in normal samples in each tissue plotted against the malignancy continuum. Samples are colored based on if they are from different disease stage.AD: Adenomas
SER: Sessile serrated lesions
MSI-H: Microsatellite-high colorectal cancer
MSS: Microsatellite stable colorectal cancer
EsophagusThe image shows the transcriptomic changes along malignancy continuum.log2FC in expression of this searched gene in stem-like cells from each diseased tissue sample relative to stem-like cells in normal samples in each tissue plotted against the malignancy continuum. Samples are colored based on if they are from different disease stage.
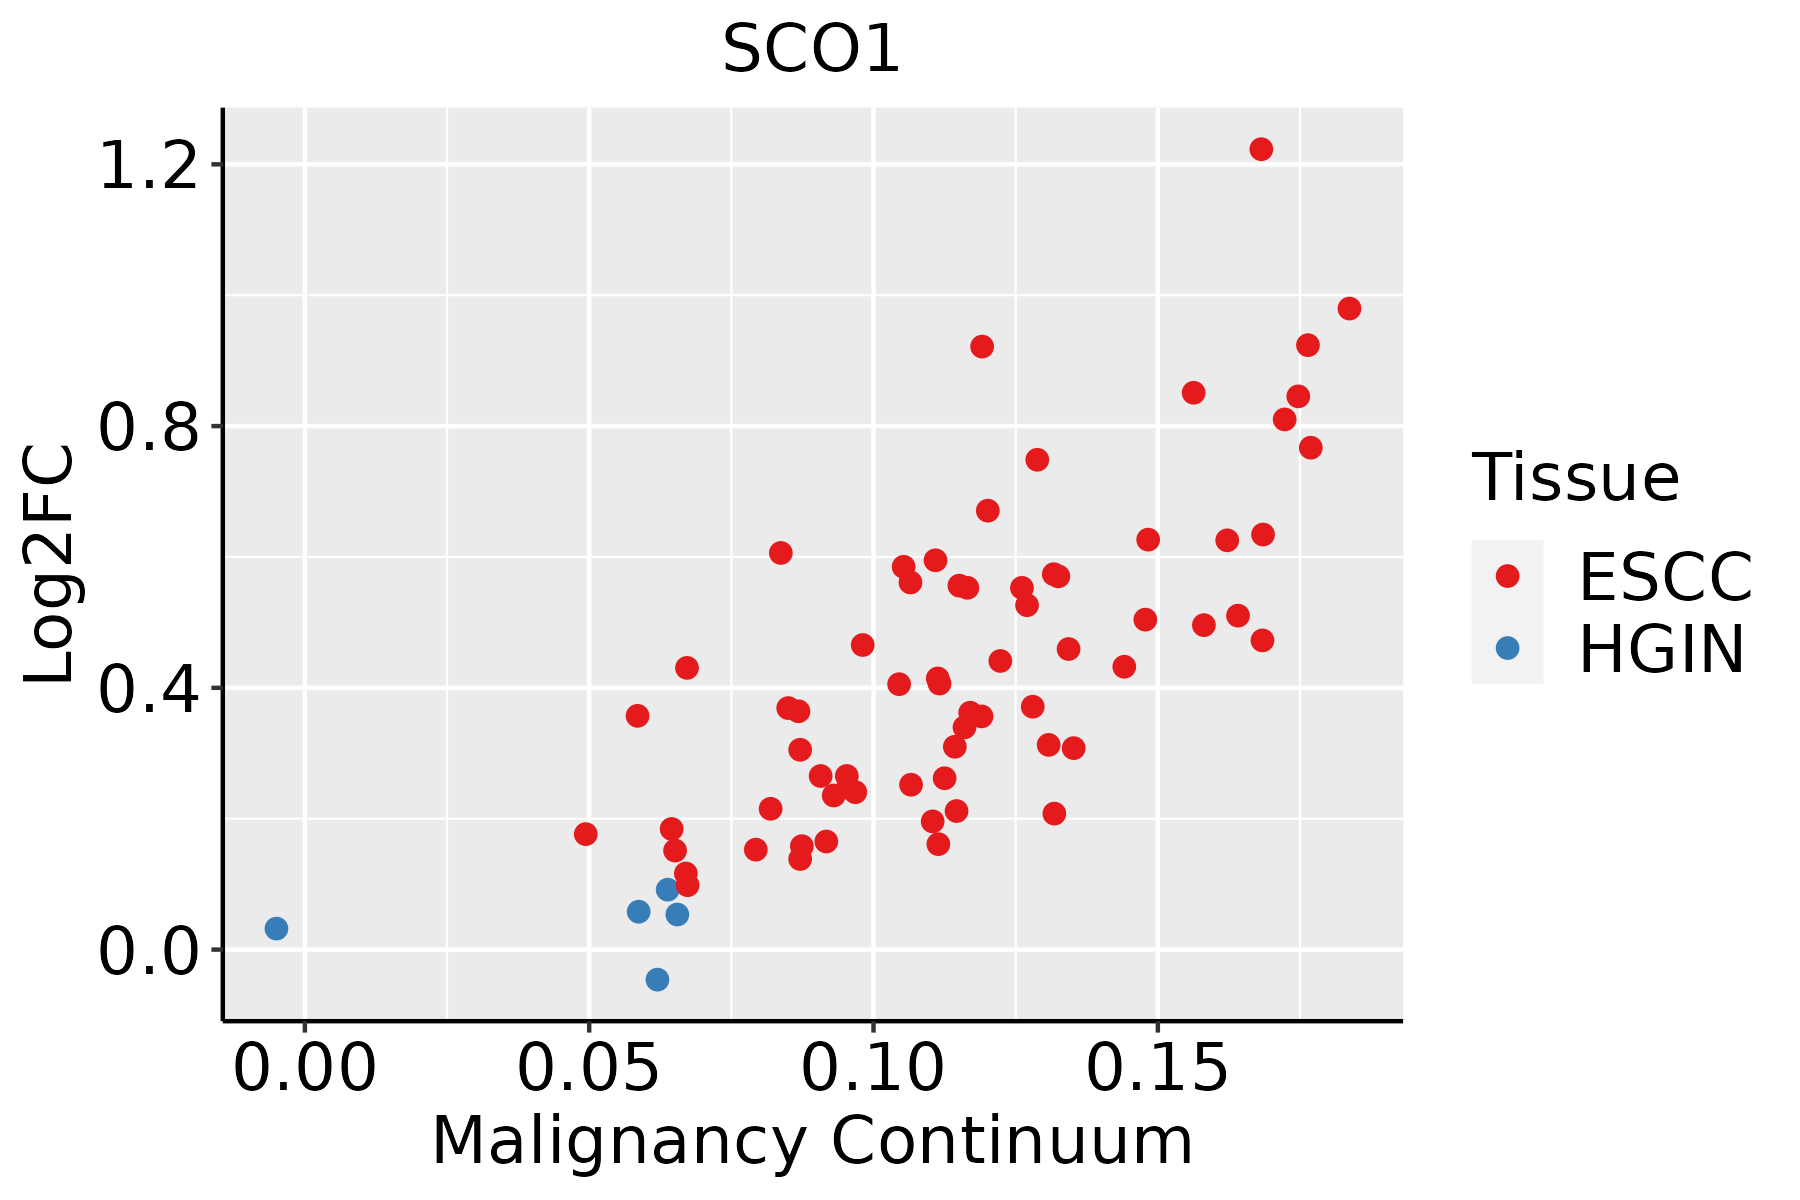
ESCC: Esophageal squamous cell carcinoma
HGIN: High-grade intraepithelial neoplasias
LGIN: Low-grade intraepithelial neoplasias
LiverThe image shows the transcriptomic changes along malignancy continuum.log2FC in expression of this searched gene in stem-like cells from each diseased tissue sample relative to stem-like cells in normal samples in each tissue plotted against the malignancy continuum. Samples are colored based on if they are from different disease stage.
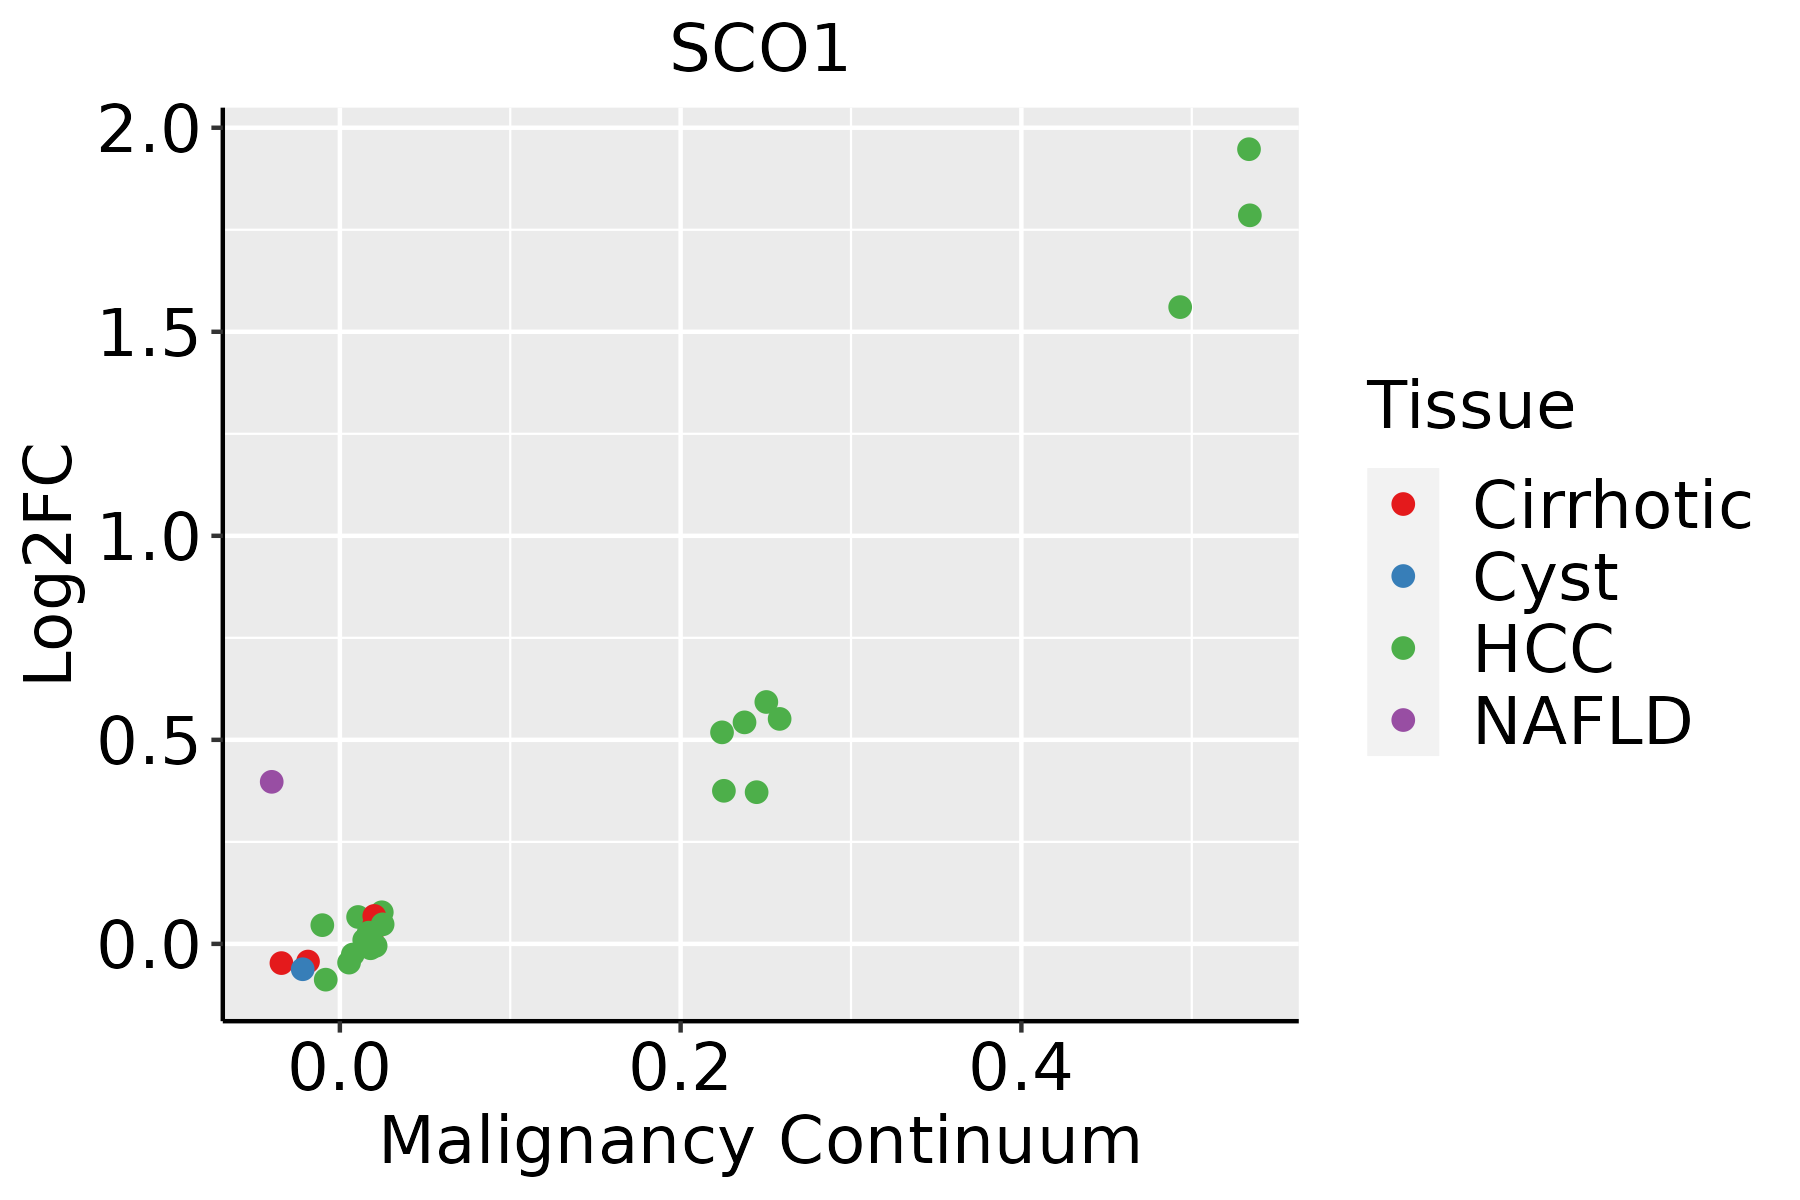
HCC: Hepatocellular carcinoma
NAFLD: Non-alcoholic fatty liver disease
Oral CavityThe image shows the transcriptomic changes along malignancy continuum.log2FC in expression of this searched gene in stem-like cells from each diseased tissue sample relative to stem-like cells in normal samples in each tissue plotted against the malignancy continuum. Samples are colored based on if they are from different disease stage.EOLP: Erosive Oral lichen planus
LP: leukoplakia
NEOLP: Non-erosive oral lichen planus
OSCC: Oral squamous cell carcinoma
SkinThe image shows the transcriptomic changes along malignancy continuum.log2FC in expression of this searched gene in stem-like cells from each diseased tissue sample relative to stem-like cells in normal samples in each tissue plotted against the malignancy continuum. Samples are colored based on if they are from different disease stage.
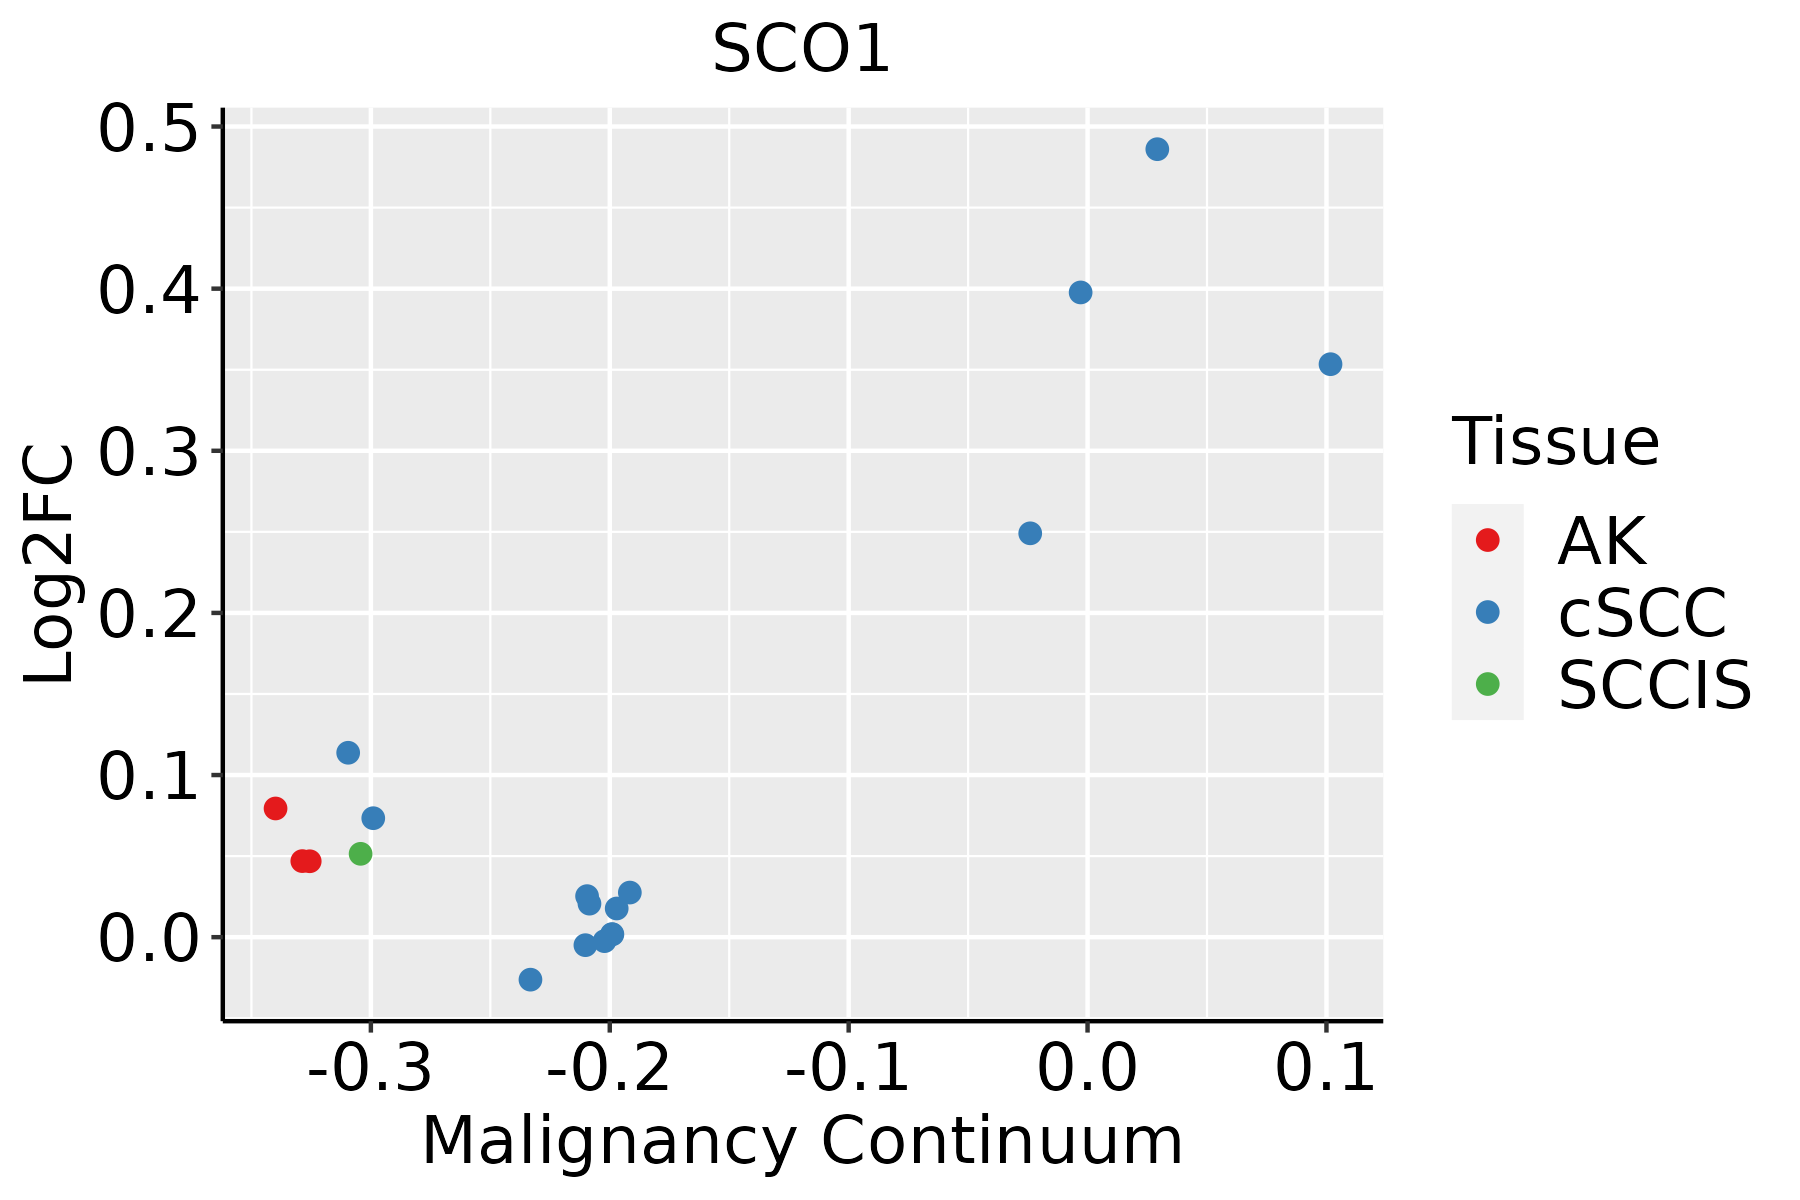
AK: Actinic keratosis
cSCC: Cutaneous squamous cell carcinoma
SCCIS:squamous cell carcinoma in situ
ThyroidThe image shows the transcriptomic changes along malignancy continuum.log2FC in expression of this searched gene in stem-like cells from each diseased tissue sample relative to stem-like cells in normal samples in each tissue plotted against the malignancy continuum. Samples are colored based on if they are from different disease stage.
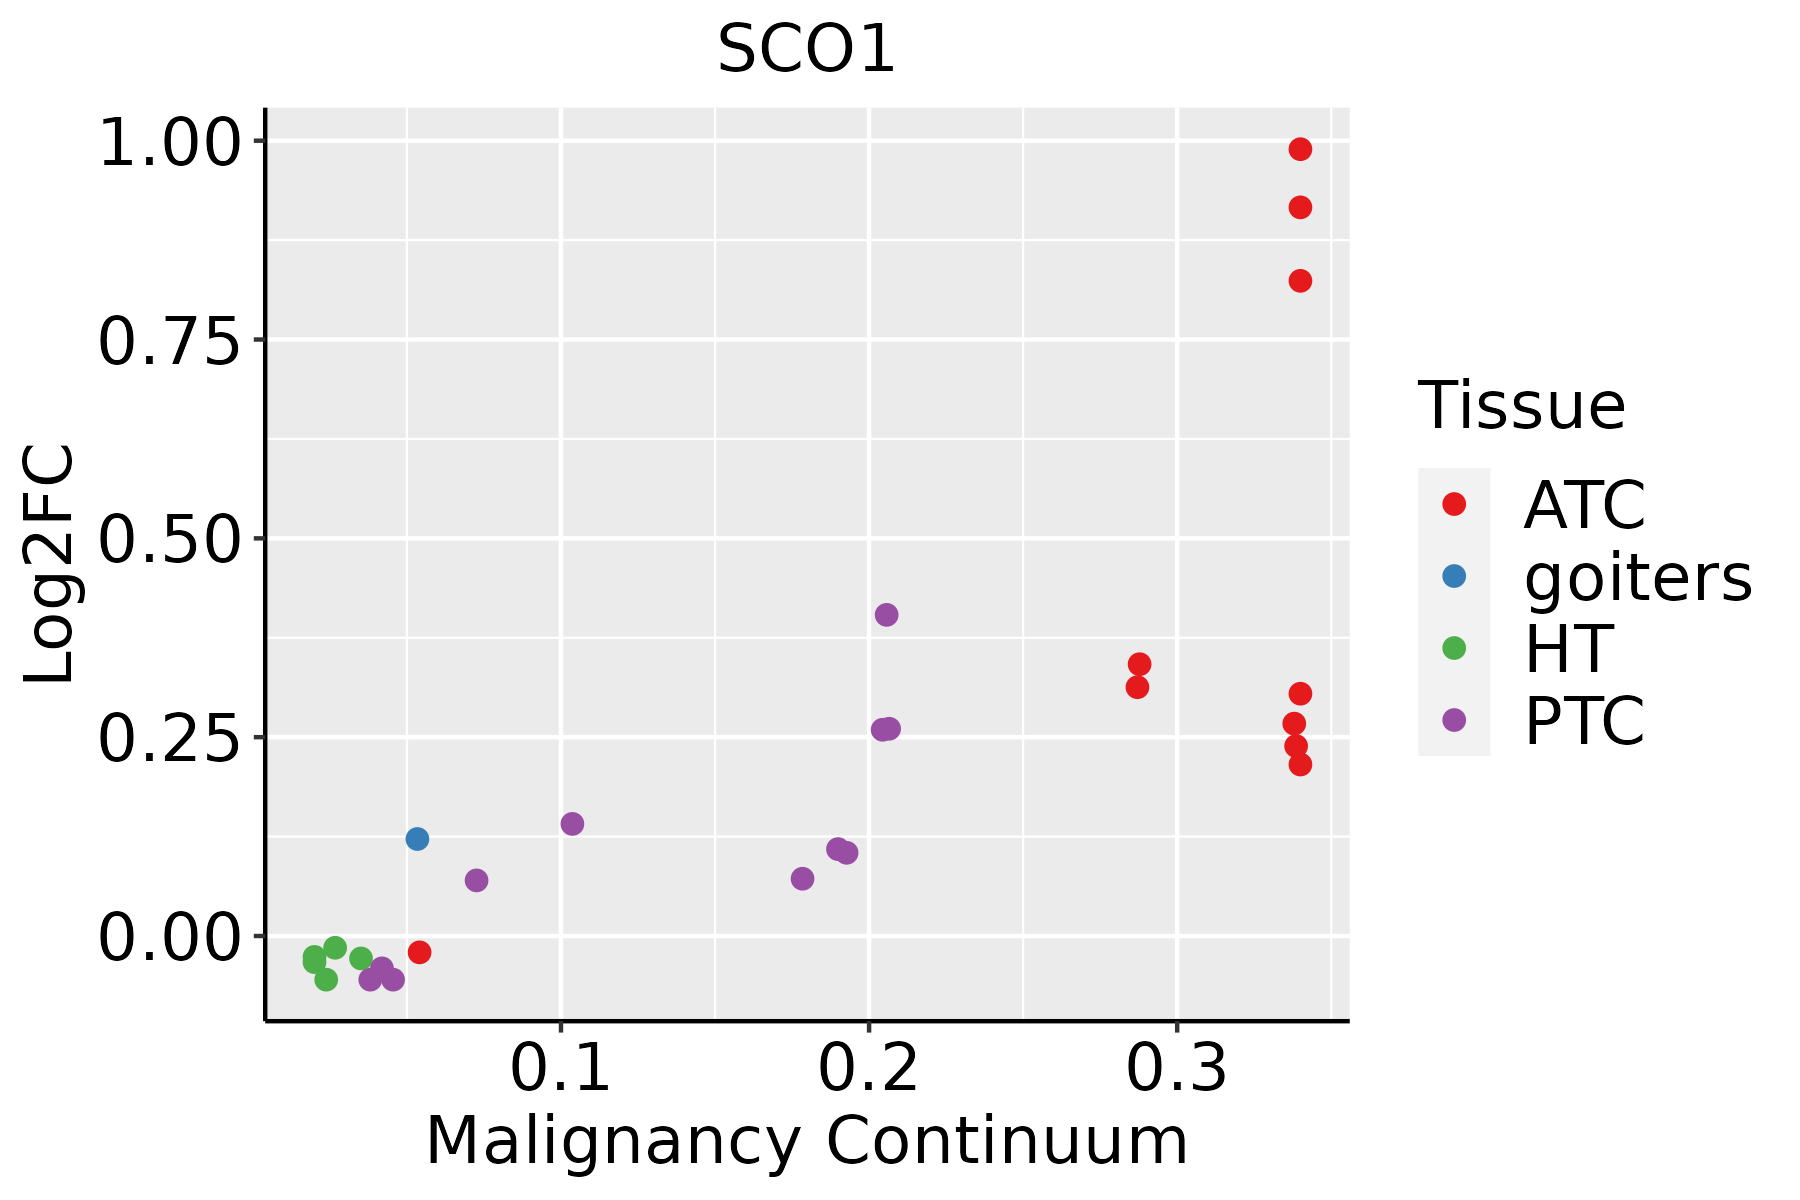
ATC: Anaplastic thyroid cancer
HT: Hashimoto's thyroiditis
PTC: Papillary thyroid cancer
∗log2FC in expression of this searched gene in stem-like cells from each diseased tissue sample relative to stem-like cells in normal samples in each tissue plotted against the malignancy continuum. Samples are colored based on if they are from different disease stage.

Top

Malignant transformation related pathway analysis

check buttonFind out the enriched GO biological processes and KEGG pathways involved in transition from healthy to precancer to cancer
check button Figure of enriched GO biological processes.
TissueDisease StageEnriched GO biological Processes
ColorectumADGO analysis - Figure of enriched GO biological processes: Top 15 enriched GO BP terms are showed in the bar plot of each disease state in each tissue. Each row represents a significant GO biological process which is colored according to the -log10(p.adjust).
ColorectumSERGO analysis - Figure of enriched GO biological processes: Top 15 enriched GO BP terms are showed in the bar plot of each disease state in each tissue. Each row represents a significant GO biological process which is colored according to the -log10(p.adjust).
ColorectumMSSGO analysis - Figure of enriched GO biological processes: Top 15 enriched GO BP terms are showed in the bar plot of each disease state in each tissue. Each row represents a significant GO biological process which is colored according to the -log10(p.adjust).
ColorectumMSI-HGO analysis - Figure of enriched GO biological processes: Top 15 enriched GO BP terms are showed in the bar plot of each disease state in each tissue. Each row represents a significant GO biological process which is colored according to the -log10(p.adjust).
ColorectumFAPGO analysis - Figure of enriched GO biological processes: Top 15 enriched GO BP terms are showed in the bar plot of each disease state in each tissue. Each row represents a significant GO biological process which is colored according to the -log10(p.adjust).
∗Top 15 enriched GO BP terms are showed in the bar plot of each disease state in each tissue. Each row represents a significant GO biological process which is colored according to the -log10(p.adjust).
Page: 1 2 3 4 5 6 7 8 9 

check button Enriched GO biological processes.
GO IDTissueDisease StageDescriptionGene RatioBg Ratiopvaluep.adjustCount
GO:0033108ColorectumADmitochondrial respiratory chain complex assembly46/391893/187238.95e-106.91e-0846
GO:0055076ColorectumADtransition metal ion homeostasis53/3918138/187231.89e-065.65e-0553
GO:0046916ColorectumADcellular transition metal ion homeostasis43/3918115/187233.62e-056.56e-0443
GO:00331082ColorectumMSSmitochondrial respiratory chain complex assembly44/346793/187232.17e-102.09e-0844
GO:00550762ColorectumMSStransition metal ion homeostasis45/3467138/187234.99e-059.02e-0445
GO:00469162ColorectumMSScellular transition metal ion homeostasis35/3467115/187231.33e-031.26e-0235
GO:00550764ColorectumFAPtransition metal ion homeostasis33/2622138/187231.22e-031.14e-0233
GO:00008194EsophagusESCCsister chromatid segregation157/8552202/187238.41e-211.33e-18157
GO:001820514EsophagusESCCpeptidyl-lysine modification259/8552376/187233.90e-205.26e-18259
GO:0033108110EsophagusESCCmitochondrial respiratory chain complex assembly83/855293/187239.56e-191.05e-1683
GO:000705911EsophagusESCCchromosome segregation238/8552346/187231.72e-181.82e-16238
GO:00062604EsophagusESCCDNA replication181/8552260/187233.55e-152.05e-13181
GO:001839413EsophagusESCCpeptidyl-lysine acetylation123/8552169/187236.58e-132.94e-11123
GO:00988133EsophagusESCCnuclear chromosome segregation187/8552281/187231.00e-124.36e-11187
GO:004354313EsophagusESCCprotein acylation165/8552243/187231.69e-127.14e-11165
GO:000647313EsophagusESCCprotein acetylation140/8552201/187234.37e-121.69e-10140
GO:001700413EsophagusESCCcytochrome complex assembly34/855236/187235.08e-101.31e-0834
GO:000853512EsophagusESCCrespiratory chain complex IV assembly24/855226/187236.87e-078.99e-0624
GO:003361712EsophagusESCCmitochondrial cytochrome c oxidase assembly21/855222/187238.75e-071.13e-0521
GO:00062754EsophagusESCCregulation of DNA replication73/8552107/187231.97e-062.28e-0573
Page: 1 2 3 4 5 6 7 

check button Enriched KEGG pathways.
Pathway IDTissueDisease StageDescriptionGene RatioBg Ratiopvaluep.adjustqvalueCount
Page: 1 

Top

Cell-cell communication analysis

check buttonIdentification of potential cell-cell interactions between two cell types and their ligand-receptor pairs for different disease states
LigandReceptorLRpairPathwayTissueDisease Stage
Page: 1 

Top

Single-cell gene regulatory network inference analysis

check buttonFind out the significant the regulons (TFs) and the target genes of each regulon across cell types for different disease states
TFCell TypeTissueDisease StageTarget GeneRSSRegulon Activity
∗The dot plots of a searched regulon are shown for all cell subpopulations in each disease state of each tissue based on the regulon specific score inferred using pySCENIC and by calculating the average expression.
Page: 1 

Top

Somatic mutation of malignant transformation related genes

check buttonAnnotation of somatic variants for genes involved in malignant transformation
Hugo SymbolVariant ClassVariant ClassificationdbSNP RSHGVScHGVSpHGVSp ShortSWISSPROTBIOTYPESIFTPolyPhenTumor Sample BarcodeTissueHistologySexAgeStageTherapy TypesDrugsOutcome
SCO1SNVMissense_Mutationnovelc.742N>Tp.Gly248Cysp.G248CO75880protein_codingdeleterious(0)probably_damaging(1)TCGA-EA-A3HU-01Cervixcervical & endocervical cancerFemale<65I/IIUnknownUnknownSD
SCO1SNVMissense_Mutationc.73C>Gp.Arg25Glyp.R25GO75880protein_codingdeleterious_low_confidence(0.01)benign(0.07)TCGA-FU-A23K-01Cervixcervical & endocervical cancerFemale<65III/IVUnknownUnknownSD
SCO1SNVMissense_Mutationrs776887702c.100G>Ap.Glu34Lysp.E34KO75880protein_codingtolerated_low_confidence(0.27)benign(0)TCGA-Q1-A6DT-01Cervixcervical & endocervical cancerFemale<65I/IIUnknownUnknownPD
SCO1SNVMissense_Mutationc.616N>Ap.Glu206Lysp.E206KO75880protein_codingdeleterious(0)possibly_damaging(0.763)TCGA-AA-3952-01Colorectumcolon adenocarcinomaMale>=65III/IVUnknownUnknownPD
SCO1SNVMissense_Mutationnovelc.358N>Ap.Ala120Thrp.A120TO75880protein_codingtolerated(0.58)benign(0.003)TCGA-CA-6717-01Colorectumcolon adenocarcinomaMale<65I/IIChemotherapyoxaliplatinCR
SCO1SNVMissense_Mutationnovelc.626N>Tp.Thr209Ilep.T209IO75880protein_codingdeleterious(0.03)possibly_damaging(0.724)TCGA-AJ-A3EK-01Endometriumuterine corpus endometrioid carcinomaFemale<65I/IIChemotherapycarboplatinCR
SCO1SNVMissense_Mutationnovelc.244G>Ap.Gly82Argp.G82RO75880protein_codingtolerated(0.68)benign(0)TCGA-AJ-A3OJ-01Endometriumuterine corpus endometrioid carcinomaFemale<65I/IIChemotherapycarboplatinCR
SCO1SNVMissense_Mutationrs145764824c.640N>Ap.Ala214Thrp.A214TO75880protein_codingdeleterious(0.01)possibly_damaging(0.861)TCGA-AP-A051-01Endometriumuterine corpus endometrioid carcinomaFemale>=65I/IIUnknownUnknownSD
SCO1SNVMissense_Mutationnovelc.11T>Ap.Leu4Glnp.L4QO75880protein_codingdeleterious_low_confidence(0.01)benign(0.083)TCGA-B5-A11P-01Endometriumuterine corpus endometrioid carcinomaFemale>=65I/IIUnknownUnknownSD
SCO1SNVMissense_Mutationrs774730754c.620G>Ap.Arg207Lysp.R207KO75880protein_codingdeleterious(0)probably_damaging(1)TCGA-B5-A3FC-01Endometriumuterine corpus endometrioid carcinomaFemale<65I/IIUnknownUnknownSD
Page: 1 2 3 

Top

Related drugs of malignant transformation related genes

check buttonIdentification of chemicals and drugs interact with genes involved in malignant transfromation
(DGIdb 4.0)
Entrez IDSymbolCategoryInteraction TypesDrug Claim NameDrug NamePMIDs
Page: 1