
|
|||||
|
 | |
| |
| |
| |
| |
| |
|
Gene: SCNN1B |
Gene summary for SCNN1B |
| Gene information | Species | Human | Gene symbol | SCNN1B | Gene ID | 6338 |
| Gene name | sodium channel epithelial 1 subunit beta | |
| Gene Alias | BESC1 | |
| Cytomap | 16p12.2 | |
| Gene Type | protein-coding | GO ID | GO:0001775 | UniProtAcc | B2R812 |
Top |
Malignant transformation analysis |
| Identification of the aberrant gene expression in precancerous and cancerous lesions by comparing the gene expression of stem-like cells in diseased tissues with normal stem cells |
| Entrez ID | Symbol | Replicates | Species | Organ | Tissue | Adj P-value | Log2FC | Malignancy |
| 6338 | SCNN1B | HTA11_3410_2000001011 | Human | Colorectum | AD | 1.91e-24 | -6.37e-01 | 0.0155 |
| 6338 | SCNN1B | HTA11_2951_2000001011 | Human | Colorectum | AD | 2.48e-03 | -6.43e-01 | 0.0216 |
| 6338 | SCNN1B | HTA11_1938_2000001011 | Human | Colorectum | AD | 2.92e-05 | -5.41e-01 | -0.0811 |
| 6338 | SCNN1B | HTA11_78_2000001011 | Human | Colorectum | AD | 1.31e-04 | -4.60e-01 | -0.1088 |
| 6338 | SCNN1B | HTA11_83_2000001011 | Human | Colorectum | SER | 2.38e-02 | -4.94e-01 | -0.1526 |
| 6338 | SCNN1B | HTA11_866_2000001011 | Human | Colorectum | AD | 1.34e-02 | -3.53e-01 | -0.1001 |
| 6338 | SCNN1B | HTA11_1391_2000001011 | Human | Colorectum | AD | 2.59e-07 | -4.74e-01 | -0.059 |
| 6338 | SCNN1B | HTA11_7862_2000001011 | Human | Colorectum | AD | 4.78e-07 | -6.43e-01 | -0.0179 |
| 6338 | SCNN1B | HTA11_866_3004761011 | Human | Colorectum | AD | 4.84e-24 | -6.43e-01 | 0.096 |
| 6338 | SCNN1B | HTA11_8622_2000001021 | Human | Colorectum | SER | 8.44e-06 | -6.43e-01 | 0.0528 |
| 6338 | SCNN1B | HTA11_10623_2000001011 | Human | Colorectum | AD | 6.57e-03 | -5.78e-01 | -0.0177 |
| 6338 | SCNN1B | HTA11_10711_2000001011 | Human | Colorectum | AD | 4.47e-15 | -6.43e-01 | 0.0338 |
| 6338 | SCNN1B | HTA11_7696_3000711011 | Human | Colorectum | AD | 2.57e-18 | -6.06e-01 | 0.0674 |
| 6338 | SCNN1B | HTA11_6818_2000001011 | Human | Colorectum | AD | 1.30e-02 | -5.59e-01 | 0.0112 |
| 6338 | SCNN1B | HTA11_6818_2000001021 | Human | Colorectum | AD | 8.82e-07 | -5.88e-01 | 0.0588 |
| 6338 | SCNN1B | HTA11_99999970781_79442 | Human | Colorectum | MSS | 1.39e-20 | -6.16e-01 | 0.294 |
| 6338 | SCNN1B | HTA11_99999965104_69814 | Human | Colorectum | MSS | 2.68e-09 | -6.17e-01 | 0.281 |
| 6338 | SCNN1B | HTA11_99999971662_82457 | Human | Colorectum | MSS | 6.56e-26 | -6.35e-01 | 0.3859 |
| 6338 | SCNN1B | HTA11_99999973899_84307 | Human | Colorectum | MSS | 1.09e-09 | -6.43e-01 | 0.2585 |
| 6338 | SCNN1B | HTA11_99999974143_84620 | Human | Colorectum | MSS | 1.06e-23 | -6.34e-01 | 0.3005 |
| Page: 1 2 3 4 5 |
| Tissue | Expression Dynamics | Abbreviation |
| Colorectum (GSE201348) | 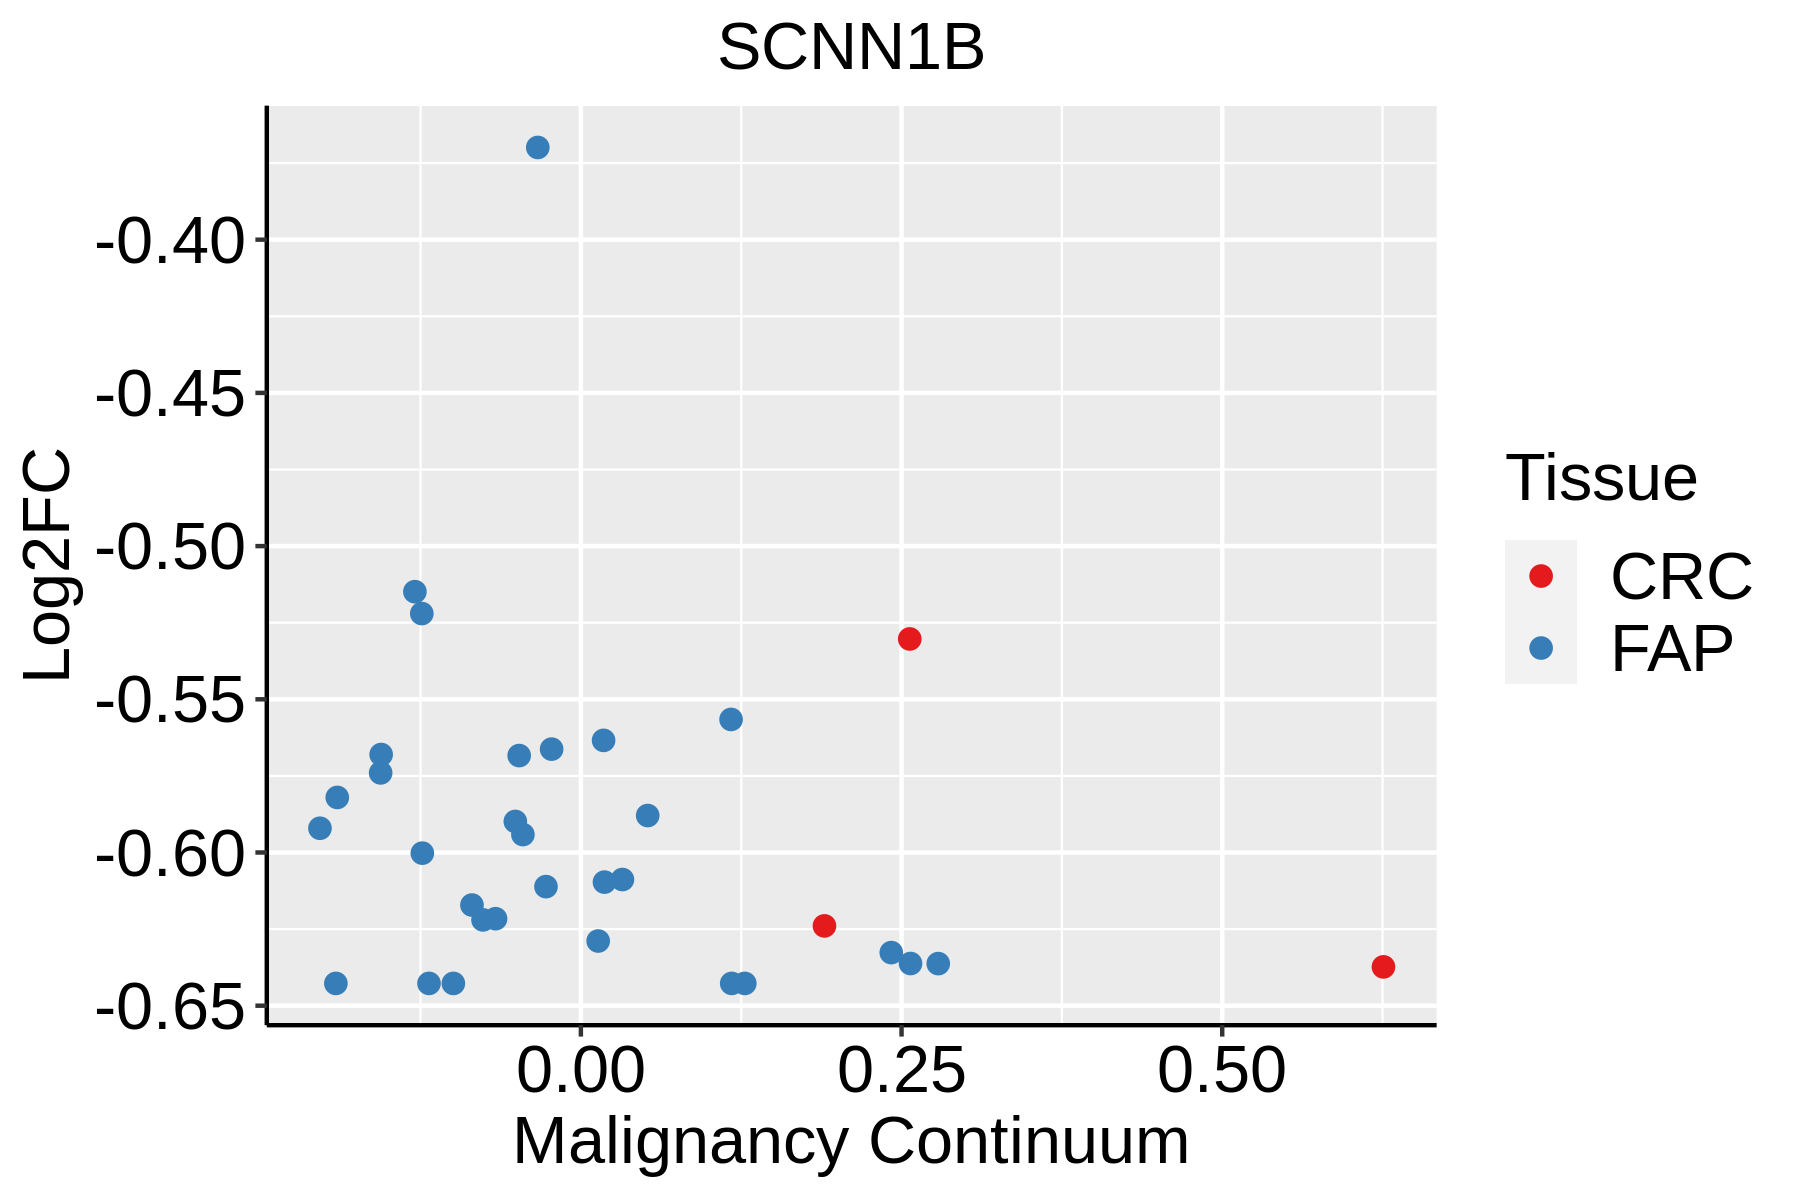 | FAP: Familial adenomatous polyposis |
| CRC: Colorectal cancer | ||
| Colorectum (HTA11) |  | AD: Adenomas |
| SER: Sessile serrated lesions | ||
| MSI-H: Microsatellite-high colorectal cancer | ||
| MSS: Microsatellite stable colorectal cancer | ||
| Esophagus |  | ESCC: Esophageal squamous cell carcinoma |
| HGIN: High-grade intraepithelial neoplasias | ||
| LGIN: Low-grade intraepithelial neoplasias | ||
| Oral Cavity | 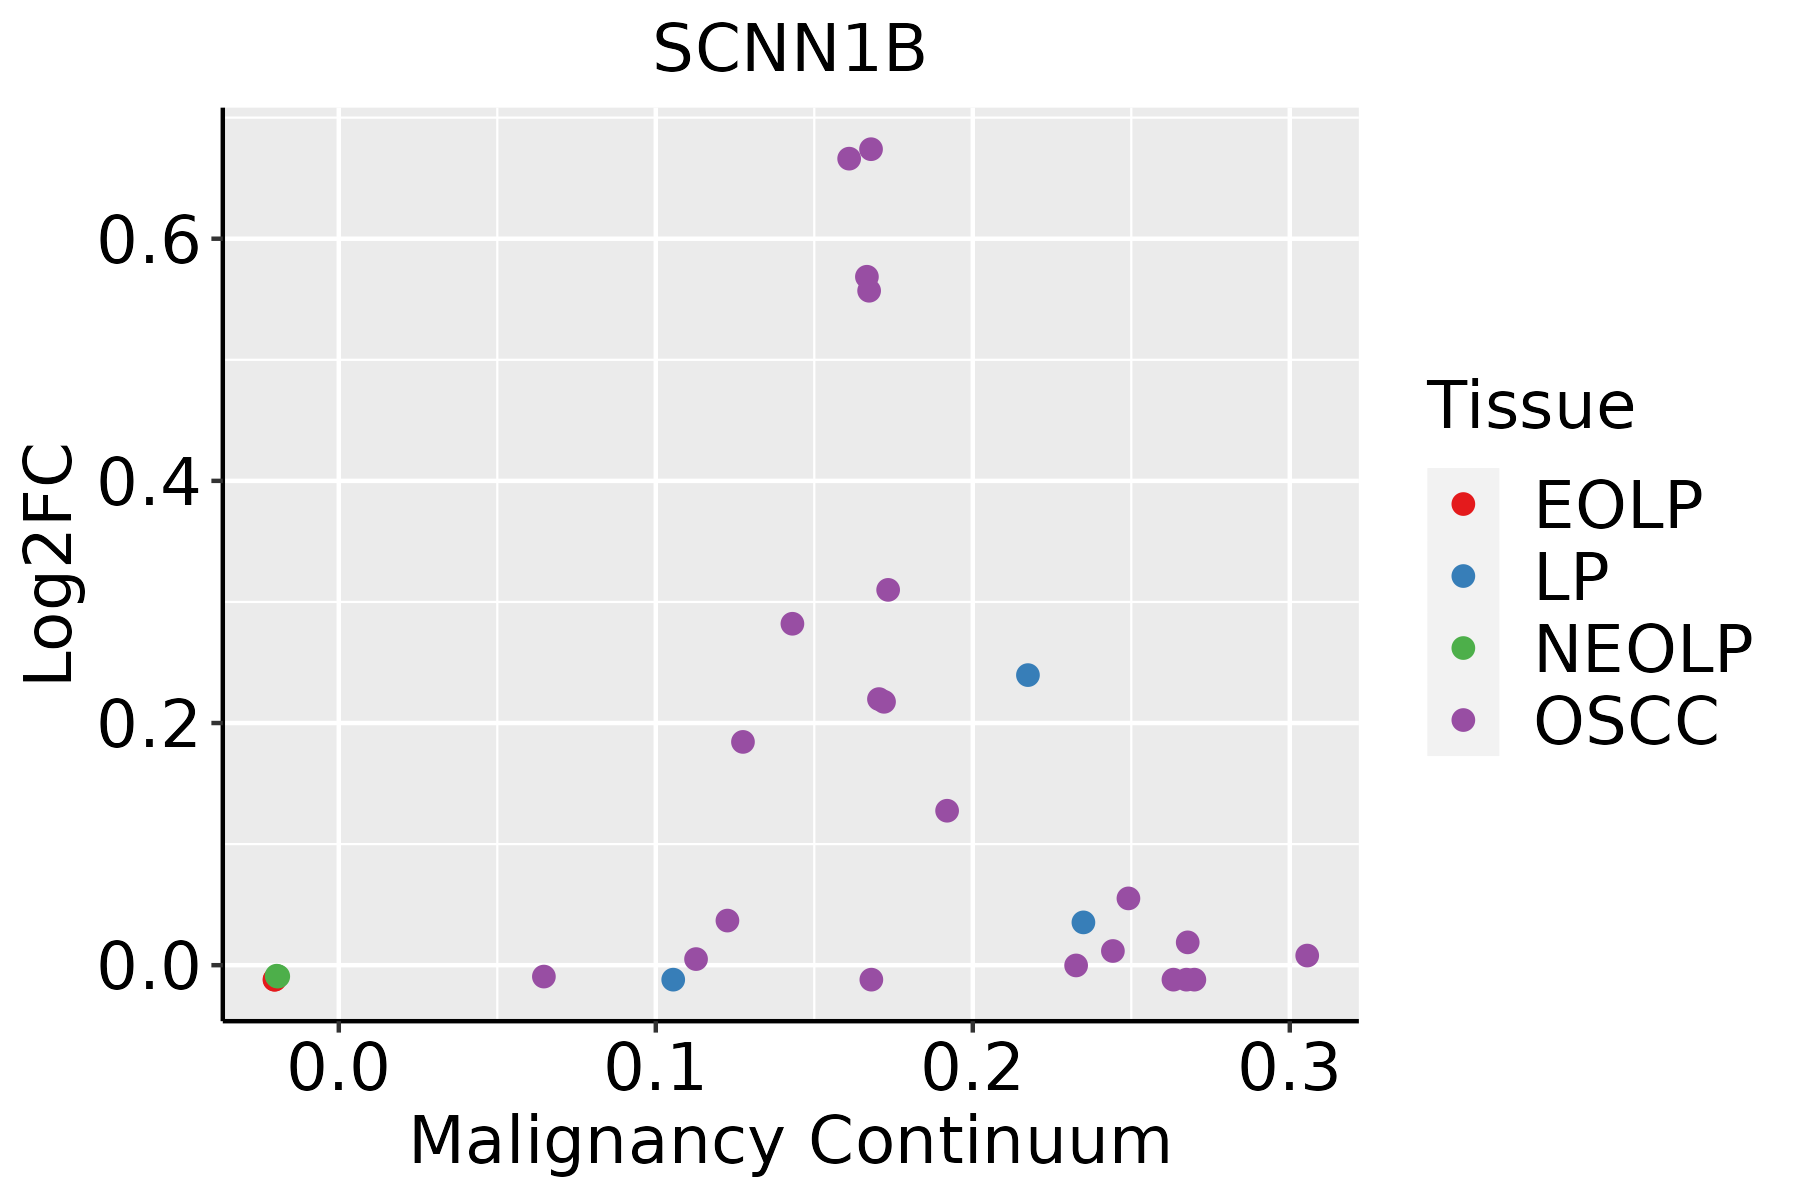 | EOLP: Erosive Oral lichen planus |
| LP: leukoplakia | ||
| NEOLP: Non-erosive oral lichen planus | ||
| OSCC: Oral squamous cell carcinoma |
| ∗log2FC in expression of this searched gene in stem-like cells from each diseased tissue sample relative to stem-like cells in normal samples in each tissue plotted against the malignancy continuum. Samples are colored based on if they are from different disease stage. |
Top |
Malignant transformation related pathway analysis |
| Find out the enriched GO biological processes and KEGG pathways involved in transition from healthy to precancer to cancer |
| Tissue | Disease Stage | Enriched GO biological Processes |
| Colorectum | AD |  |
| Colorectum | SER |  |
| Colorectum | MSS |  |
| Colorectum | MSI-H |  |
| Colorectum | FAP |  |
| ∗Top 15 enriched GO BP terms are showed in the bar plot of each disease state in each tissue. Each row represents a significant GO biological process which is colored according to the -log10(p.adjust). |
| Page: 1 2 3 4 5 6 7 8 9 |
| GO ID | Tissue | Disease Stage | Description | Gene Ratio | Bg Ratio | pvalue | p.adjust | Count |
| GO:0044403 | Colorectum | AD | biological process involved in symbiotic interaction | 99/3918 | 290/18723 | 1.02e-07 | 4.93e-06 | 99 |
| GO:0071383 | Colorectum | AD | cellular response to steroid hormone stimulus | 73/3918 | 204/18723 | 6.31e-07 | 2.24e-05 | 73 |
| GO:0034101 | Colorectum | AD | erythrocyte homeostasis | 51/3918 | 129/18723 | 1.07e-06 | 3.59e-05 | 51 |
| GO:0002262 | Colorectum | AD | myeloid cell homeostasis | 57/3918 | 157/18723 | 6.17e-06 | 1.56e-04 | 57 |
| GO:0048872 | Colorectum | AD | homeostasis of number of cells | 87/3918 | 272/18723 | 1.16e-05 | 2.61e-04 | 87 |
| GO:0031667 | Colorectum | AD | response to nutrient levels | 138/3918 | 474/18723 | 1.22e-05 | 2.68e-04 | 138 |
| GO:0048545 | Colorectum | AD | response to steroid hormone | 104/3918 | 339/18723 | 1.33e-05 | 2.90e-04 | 104 |
| GO:0006066 | Colorectum | AD | alcohol metabolic process | 106/3918 | 353/18723 | 3.02e-05 | 5.57e-04 | 106 |
| GO:0050878 | Colorectum | AD | regulation of body fluid levels | 108/3918 | 379/18723 | 2.54e-04 | 3.20e-03 | 108 |
| GO:0009410 | Colorectum | AD | response to xenobiotic stimulus | 128/3918 | 462/18723 | 2.69e-04 | 3.31e-03 | 128 |
| GO:0007589 | Colorectum | AD | body fluid secretion | 33/3918 | 93/18723 | 8.26e-04 | 8.13e-03 | 33 |
| GO:1901654 | Colorectum | AD | response to ketone | 59/3918 | 194/18723 | 1.14e-03 | 1.04e-02 | 59 |
| GO:0034308 | Colorectum | AD | primary alcohol metabolic process | 35/3918 | 102/18723 | 1.16e-03 | 1.05e-02 | 35 |
| GO:0006081 | Colorectum | AD | cellular aldehyde metabolic process | 22/3918 | 60/18723 | 3.64e-03 | 2.60e-02 | 22 |
| GO:0097305 | Colorectum | AD | response to alcohol | 71/3918 | 253/18723 | 4.01e-03 | 2.80e-02 | 71 |
| GO:0055067 | Colorectum | AD | monovalent inorganic cation homeostasis | 45/3918 | 151/18723 | 6.19e-03 | 3.88e-02 | 45 |
| GO:0008202 | Colorectum | AD | steroid metabolic process | 85/3918 | 319/18723 | 8.07e-03 | 4.75e-02 | 85 |
| GO:00713831 | Colorectum | SER | cellular response to steroid hormone stimulus | 55/2897 | 204/18723 | 1.66e-05 | 5.05e-04 | 55 |
| GO:00341011 | Colorectum | SER | erythrocyte homeostasis | 39/2897 | 129/18723 | 1.70e-05 | 5.11e-04 | 39 |
| GO:00444031 | Colorectum | SER | biological process involved in symbiotic interaction | 72/2897 | 290/18723 | 2.08e-05 | 6.02e-04 | 72 |
| Page: 1 2 3 4 5 6 7 |
| Pathway ID | Tissue | Disease Stage | Description | Gene Ratio | Bg Ratio | pvalue | p.adjust | qvalue | Count |
| hsa04960 | Colorectum | FAP | Aldosterone-regulated sodium reabsorption | 13/1404 | 37/8465 | 4.79e-03 | 1.91e-02 | 1.16e-02 | 13 |
| hsa049601 | Colorectum | FAP | Aldosterone-regulated sodium reabsorption | 13/1404 | 37/8465 | 4.79e-03 | 1.91e-02 | 1.16e-02 | 13 |
| hsa049602 | Colorectum | CRC | Aldosterone-regulated sodium reabsorption | 12/1091 | 37/8465 | 1.66e-03 | 1.20e-02 | 8.16e-03 | 12 |
| hsa049603 | Colorectum | CRC | Aldosterone-regulated sodium reabsorption | 12/1091 | 37/8465 | 1.66e-03 | 1.20e-02 | 8.16e-03 | 12 |
| Page: 1 |
Top |
Cell-cell communication analysis |
| Identification of potential cell-cell interactions between two cell types and their ligand-receptor pairs for different disease states |
| Ligand | Receptor | LRpair | Pathway | Tissue | Disease Stage |
| Page: 1 |
Top |
Single-cell gene regulatory network inference analysis |
| Find out the significant the regulons (TFs) and the target genes of each regulon across cell types for different disease states |
| TF | Cell Type | Tissue | Disease Stage | Target Gene | RSS | Regulon Activity |
| ∗The dot plots of a searched regulon are shown for all cell subpopulations in each disease state of each tissue based on the regulon specific score inferred using pySCENIC and by calculating the average expression. |
| Page: 1 |
Top |
Somatic mutation of malignant transformation related genes |
| Annotation of somatic variants for genes involved in malignant transformation |
| Hugo Symbol | Variant Class | Variant Classification | dbSNP RS | HGVSc | HGVSp | HGVSp Short | SWISSPROT | BIOTYPE | SIFT | PolyPhen | Tumor Sample Barcode | Tissue | Histology | Sex | Age | Stage | Therapy Types | Drugs | Outcome |
| SCNN1B | SNV | Missense_Mutation | rs72654326 | c.775C>T | p.Arg259Trp | p.R259W | P51168 | protein_coding | deleterious(0) | probably_damaging(0.971) | TCGA-BH-A0DH-01 | Breast | breast invasive carcinoma | Female | <65 | I/II | Chemotherapy | cyclophosphamide | SD |
| SCNN1B | SNV | Missense_Mutation | c.1604T>G | p.Leu535Arg | p.L535R | P51168 | protein_coding | deleterious(0) | probably_damaging(0.999) | TCGA-BH-A18G-01 | Breast | breast invasive carcinoma | Female | >=65 | I/II | Unknown | Unknown | SD | |
| SCNN1B | SNV | Missense_Mutation | c.1391N>T | p.Ser464Phe | p.S464F | P51168 | protein_coding | deleterious(0.02) | probably_damaging(0.999) | TCGA-BH-A18P-01 | Breast | breast invasive carcinoma | Female | <65 | I/II | Unknown | Unknown | PD | |
| SCNN1B | SNV | Missense_Mutation | rs370777535 | c.91G>A | p.Asp31Asn | p.D31N | P51168 | protein_coding | tolerated(0.9) | benign(0.029) | TCGA-D8-A1XK-01 | Breast | breast invasive carcinoma | Female | <65 | I/II | Chemotherapy | doxorubicine+cyclophosphamide | SD |
| SCNN1B | insertion | Frame_Shift_Ins | novel | c.1271_1272insAATACTGCAACAACCGGGACTT | p.His425IlefsTer33 | p.H425Ifs*33 | P51168 | protein_coding | TCGA-A2-A0CP-01 | Breast | breast invasive carcinoma | Female | <65 | I/II | Chemotherapy | cytoxan | SD | ||
| SCNN1B | SNV | Missense_Mutation | rs368632136 | c.562G>A | p.Gly188Arg | p.G188R | P51168 | protein_coding | tolerated(0.5) | benign(0.012) | TCGA-2W-A8YY-01 | Cervix | cervical & endocervical cancer | Female | <65 | I/II | Chemotherapy | cisplatin | CR |
| SCNN1B | SNV | Missense_Mutation | c.632C>T | p.Ala211Val | p.A211V | P51168 | protein_coding | deleterious(0.02) | probably_damaging(0.957) | TCGA-A6-6781-01 | Colorectum | colon adenocarcinoma | Male | <65 | III/IV | Chemotherapy | oxaliplatin | SD | |
| SCNN1B | SNV | Missense_Mutation | c.1304N>T | p.Ala435Val | p.A435V | P51168 | protein_coding | tolerated(0.34) | benign(0.007) | TCGA-AA-3811-01 | Colorectum | colon adenocarcinoma | Female | >=65 | III/IV | Unknown | Unknown | PD | |
| SCNN1B | SNV | Missense_Mutation | rs751021743 | c.1457N>T | p.Thr486Ile | p.T486I | P51168 | protein_coding | tolerated(0.07) | probably_damaging(0.999) | TCGA-AA-3930-01 | Colorectum | colon adenocarcinoma | Male | >=65 | III/IV | Chemotherapy | capecitabine | PD |
| SCNN1B | SNV | Missense_Mutation | rs776860505 | c.1472N>A | p.Gly491Glu | p.G491E | P51168 | protein_coding | deleterious(0.02) | probably_damaging(0.991) | TCGA-AA-A01I-01 | Colorectum | colon adenocarcinoma | Male | >=65 | I/II | Unknown | Unknown | SD |
| Page: 1 2 3 4 5 6 7 |
Top |
Related drugs of malignant transformation related genes |
| Identification of chemicals and drugs interact with genes involved in malignant transfromation |
| (DGIdb 4.0) |
| Entrez ID | Symbol | Category | Interaction Types | Drug Claim Name | Drug Name | PMIDs |
| 6338 | SCNN1B | DRUGGABLE GENOME, ION CHANNEL, EXTERNAL SIDE OF PLASMA MEMBRANE | TRIAMTERENE | TRIAMTERENE | ||
| 6338 | SCNN1B | DRUGGABLE GENOME, ION CHANNEL, EXTERNAL SIDE OF PLASMA MEMBRANE | AMILORIDE | AMILORIDE | ||
| 6338 | SCNN1B | DRUGGABLE GENOME, ION CHANNEL, EXTERNAL SIDE OF PLASMA MEMBRANE | triamterene | TRIAMTERENE | 23788015 | |
| 6338 | SCNN1B | DRUGGABLE GENOME, ION CHANNEL, EXTERNAL SIDE OF PLASMA MEMBRANE | amiloride | AMILORIDE | 23788015 | |
| 6338 | SCNN1B | DRUGGABLE GENOME, ION CHANNEL, EXTERNAL SIDE OF PLASMA MEMBRANE | P-552 | |||
| 6338 | SCNN1B | DRUGGABLE GENOME, ION CHANNEL, EXTERNAL SIDE OF PLASMA MEMBRANE | blocker | CHEMBL1398126 | AMILORIDE HYDROCHLORIDE | |
| 6338 | SCNN1B | DRUGGABLE GENOME, ION CHANNEL, EXTERNAL SIDE OF PLASMA MEMBRANE | Farglitazar | FARGLITAZAR | 18004211 | |
| 6338 | SCNN1B | DRUGGABLE GENOME, ION CHANNEL, EXTERNAL SIDE OF PLASMA MEMBRANE | AMILORIDE | AMILORIDE | ||
| 6338 | SCNN1B | DRUGGABLE GENOME, ION CHANNEL, EXTERNAL SIDE OF PLASMA MEMBRANE | GS-9411 | |||
| 6338 | SCNN1B | DRUGGABLE GENOME, ION CHANNEL, EXTERNAL SIDE OF PLASMA MEMBRANE | blocker | CHEMBL3545352 | P-1037 |
| Page: 1 2 |

Copyright 2023-Present -The University of Texas Health Science Center at Houston |