Schematic overview of the cellular and molecular mechanisms involved in the cancer progression, including the proposed cellular and molecular mechanisms in cancer cells trajectory. AT1: alveolar type 1 cells; AT2: alveolar type 2 cells; AAH: atypical adenomatous hyperplasia; AIS: adenocarcinoma in situ; MIA: minimally invasive adenocarcinoma; IA: invasive adenocarcinoma; EMT: epithelial-mesenchymal transition

Home

Download

Statistics

Help

Contact

Center for Computational Systems Medicine
leaf

Gene summary

leaf

Malignant transformation analysis

leaf

Malignant transformation related pathway analysis

leaf

Cell-cell communication analysis

leaf

Single-cell gene regulatory network inference analysis

leaf

Somatic mutation of malignant transformation related genes

leaf

Related drugs of malignant transformation related genes

Gene: SCNN1A

Gene summary for SCNN1A

check button Gene summary.

Gene informationSpeciesHuman
Gene symbol

SCNN1A

Gene ID

6337

Gene namesodium channel epithelial 1 subunit alpha
Gene AliasBESC2
Cytomap12p13.31
Gene Typeprotein-coding
GO ID

GO:0003008

UniProtAcc

P37088


Top

Malignant transformation analysis

check button Identification of the aberrant gene expression in precancerous and cancerous lesions by comparing the gene expression of stem-like cells in diseased tissues with normal stem cells
check button Malignant transformation involving gene list.
Entrez IDSymbolReplicatesSpeciesOrganTissueAdj P-valueLog2FCMalignancy
6337SCNN1AHTA11_3410_2000001011HumanColorectumAD1.05e-021.49e-010.0155
6337SCNN1AHTA11_2487_2000001011HumanColorectumSER1.46e-097.93e-01-0.1808
6337SCNN1AHTA11_411_2000001011HumanColorectumSER6.50e-101.84e+00-0.2602
6337SCNN1AHTA11_2112_2000001011HumanColorectumSER4.66e-061.20e+00-0.2196
6337SCNN1AHTA11_3361_2000001011HumanColorectumAD9.64e-067.15e-01-0.1207
6337SCNN1AHTA11_696_2000001011HumanColorectumAD1.65e-208.70e-01-0.1464
6337SCNN1AHTA11_866_2000001011HumanColorectumAD1.82e-065.56e-01-0.1001
6337SCNN1AHTA11_1391_2000001011HumanColorectumAD2.23e-045.17e-01-0.059
6337SCNN1AHTA11_5212_2000001011HumanColorectumAD7.69e-121.25e+00-0.2061
6337SCNN1AHTA11_866_3004761011HumanColorectumAD3.49e-075.20e-010.096
6337SCNN1AHTA11_10711_2000001011HumanColorectumAD8.33e-033.70e-010.0338
6337SCNN1AHTA11_7696_3000711011HumanColorectumAD8.48e-074.62e-010.0674
6337SCNN1AHTA11_99999970781_79442HumanColorectumMSS2.04e-115.25e-010.294
6337SCNN1AHTA11_99999965062_69753HumanColorectumMSI-H1.86e-202.11e+000.3487
6337SCNN1AHTA11_99999965104_69814HumanColorectumMSS1.42e-054.74e-010.281
6337SCNN1AHTA11_99999971662_82457HumanColorectumMSS8.30e-168.43e-010.3859
6337SCNN1AA015-C-203HumanColorectumFAP7.55e-081.63e-01-0.1294
6337SCNN1AA002-C-201HumanColorectumFAP1.02e-022.36e-010.0324
6337SCNN1AA001-C-119HumanColorectumFAP3.21e-044.51e-01-0.1557
6337SCNN1AA001-C-108HumanColorectumFAP2.49e-021.22e-01-0.0272
Page: 1 2 3 4 5 

check button Transcriptomic changes along malignancy continuum.
TissueExpression DynamicsAbbreviation
Colorectum (GSE201348)The image shows the transcriptomic changes along malignancy continuum.log2FC in expression of this searched gene in stem-like cells from each diseased tissue sample relative to stem-like cells in normal samples in each tissue plotted against the malignancy continuum. Samples are colored based on if they are from different disease stage.FAP: Familial adenomatous polyposis
CRC: Colorectal cancer
Colorectum (HTA11)The image shows the transcriptomic changes along malignancy continuum.log2FC in expression of this searched gene in stem-like cells from each diseased tissue sample relative to stem-like cells in normal samples in each tissue plotted against the malignancy continuum. Samples are colored based on if they are from different disease stage.AD: Adenomas
SER: Sessile serrated lesions
MSI-H: Microsatellite-high colorectal cancer
MSS: Microsatellite stable colorectal cancer
EsophagusThe image shows the transcriptomic changes along malignancy continuum.log2FC in expression of this searched gene in stem-like cells from each diseased tissue sample relative to stem-like cells in normal samples in each tissue plotted against the malignancy continuum. Samples are colored based on if they are from different disease stage.
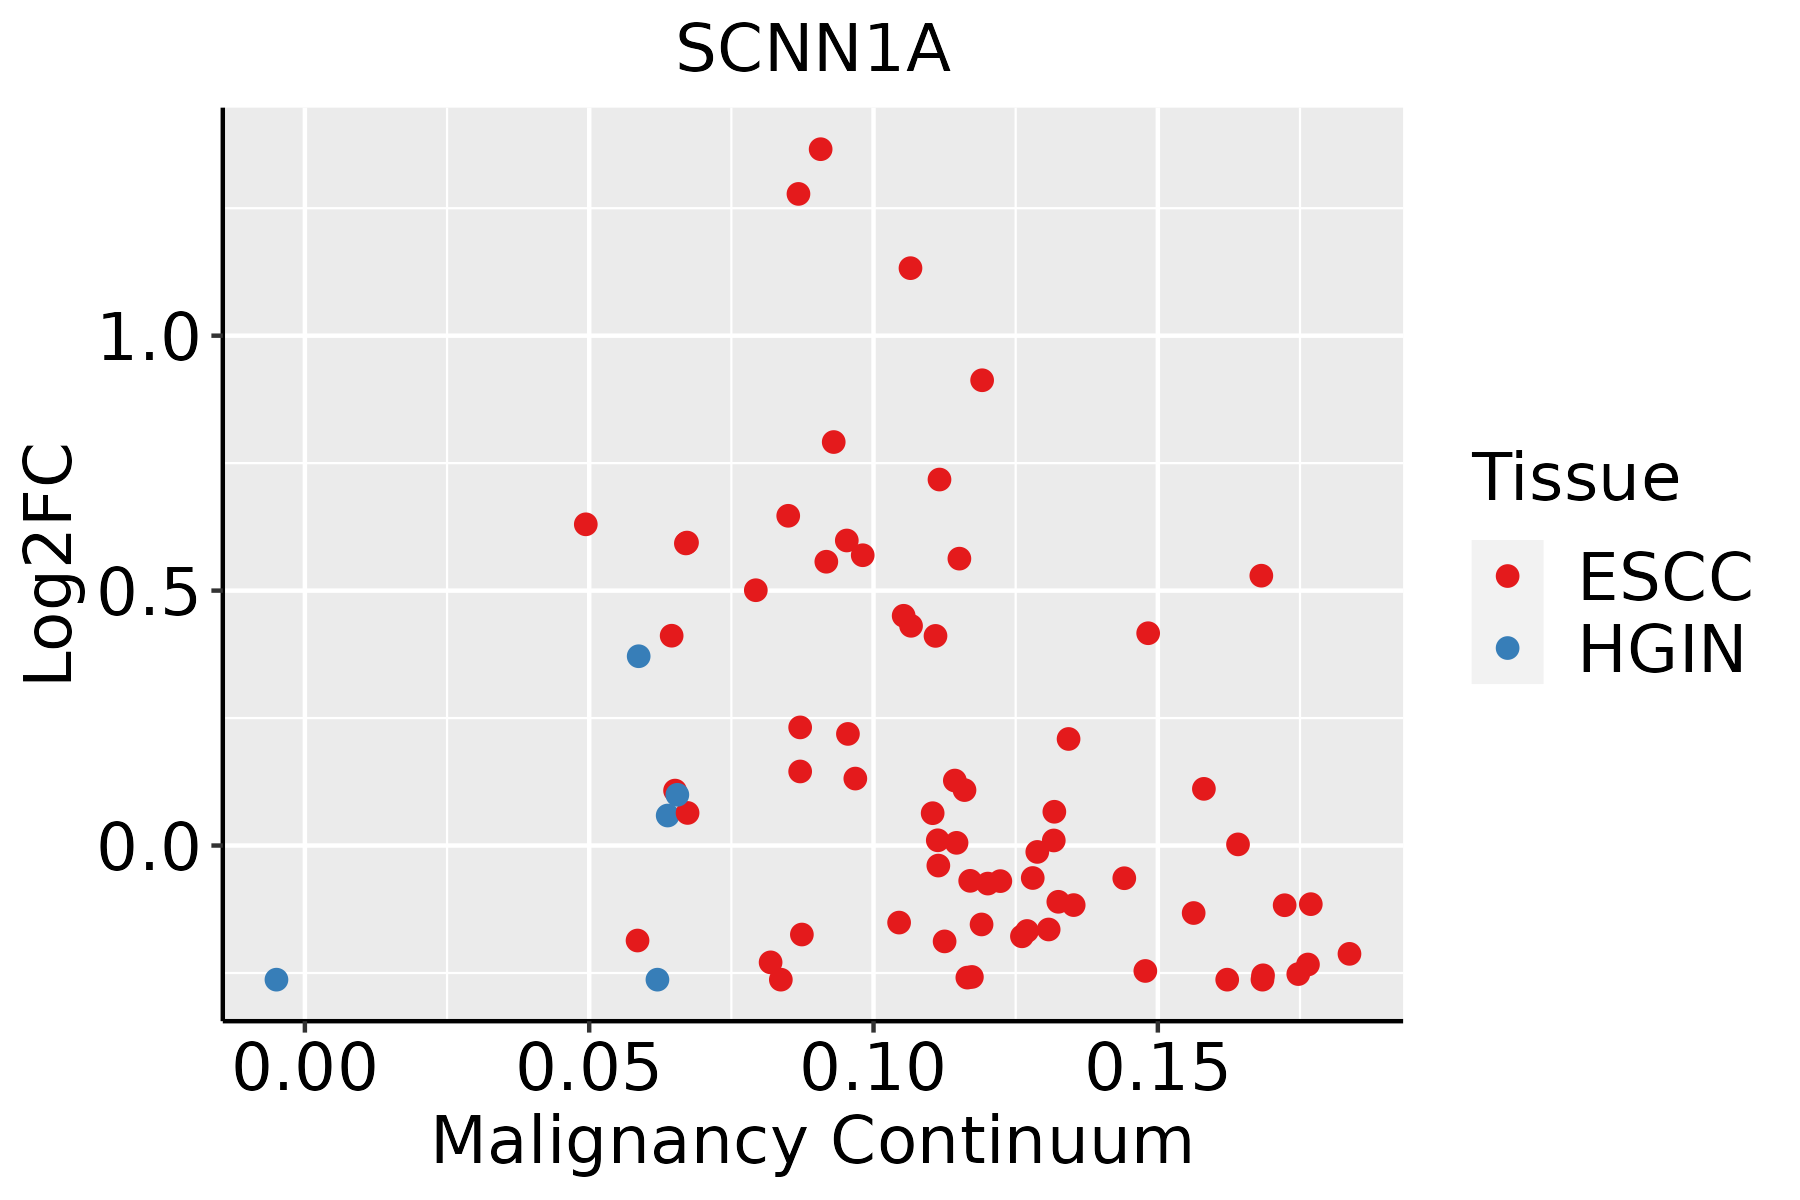
ESCC: Esophageal squamous cell carcinoma
HGIN: High-grade intraepithelial neoplasias
LGIN: Low-grade intraepithelial neoplasias
LiverThe image shows the transcriptomic changes along malignancy continuum.log2FC in expression of this searched gene in stem-like cells from each diseased tissue sample relative to stem-like cells in normal samples in each tissue plotted against the malignancy continuum. Samples are colored based on if they are from different disease stage.
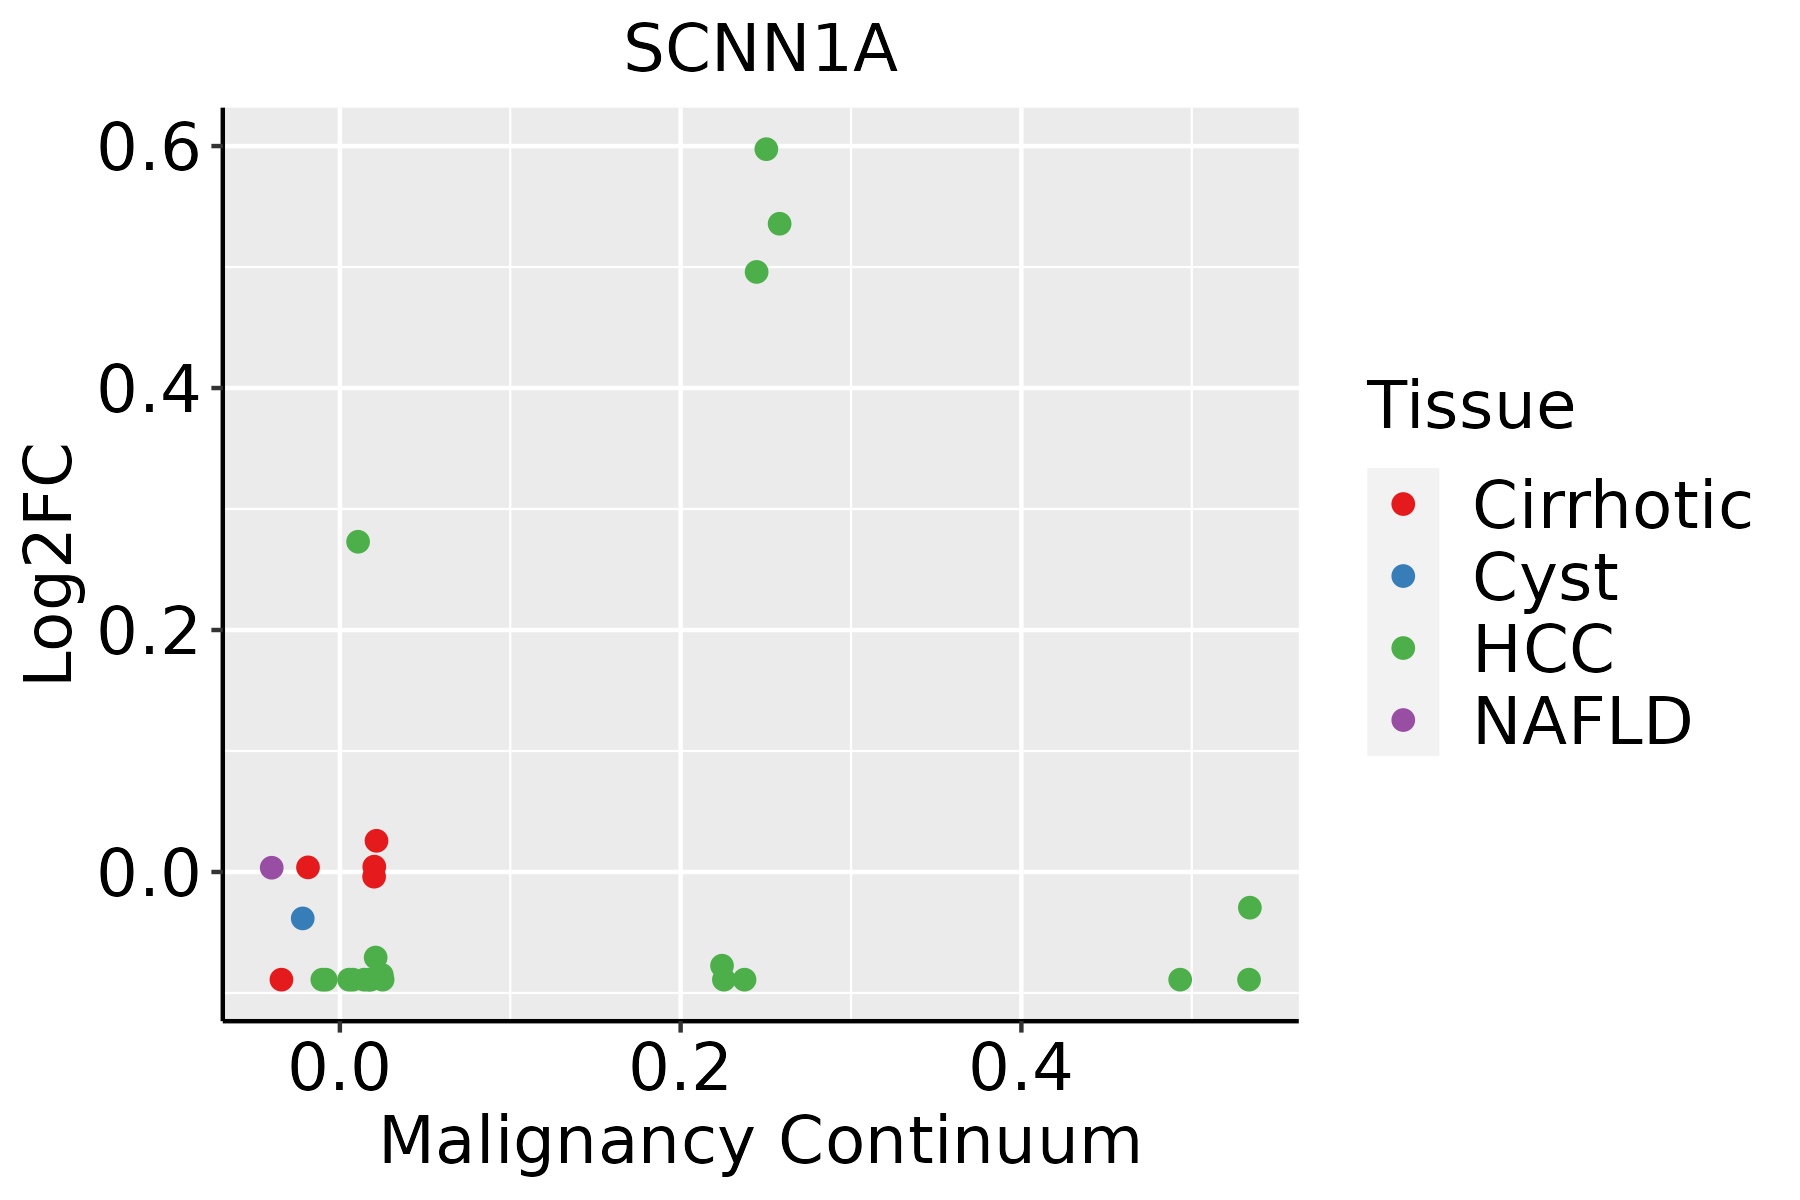
HCC: Hepatocellular carcinoma
NAFLD: Non-alcoholic fatty liver disease
Oral CavityThe image shows the transcriptomic changes along malignancy continuum.log2FC in expression of this searched gene in stem-like cells from each diseased tissue sample relative to stem-like cells in normal samples in each tissue plotted against the malignancy continuum. Samples are colored based on if they are from different disease stage.EOLP: Erosive Oral lichen planus
LP: leukoplakia
NEOLP: Non-erosive oral lichen planus
OSCC: Oral squamous cell carcinoma
ProstateThe image shows the transcriptomic changes along malignancy continuum.log2FC in expression of this searched gene in stem-like cells from each diseased tissue sample relative to stem-like cells in normal samples in each tissue plotted against the malignancy continuum. Samples are colored based on if they are from different disease stage.
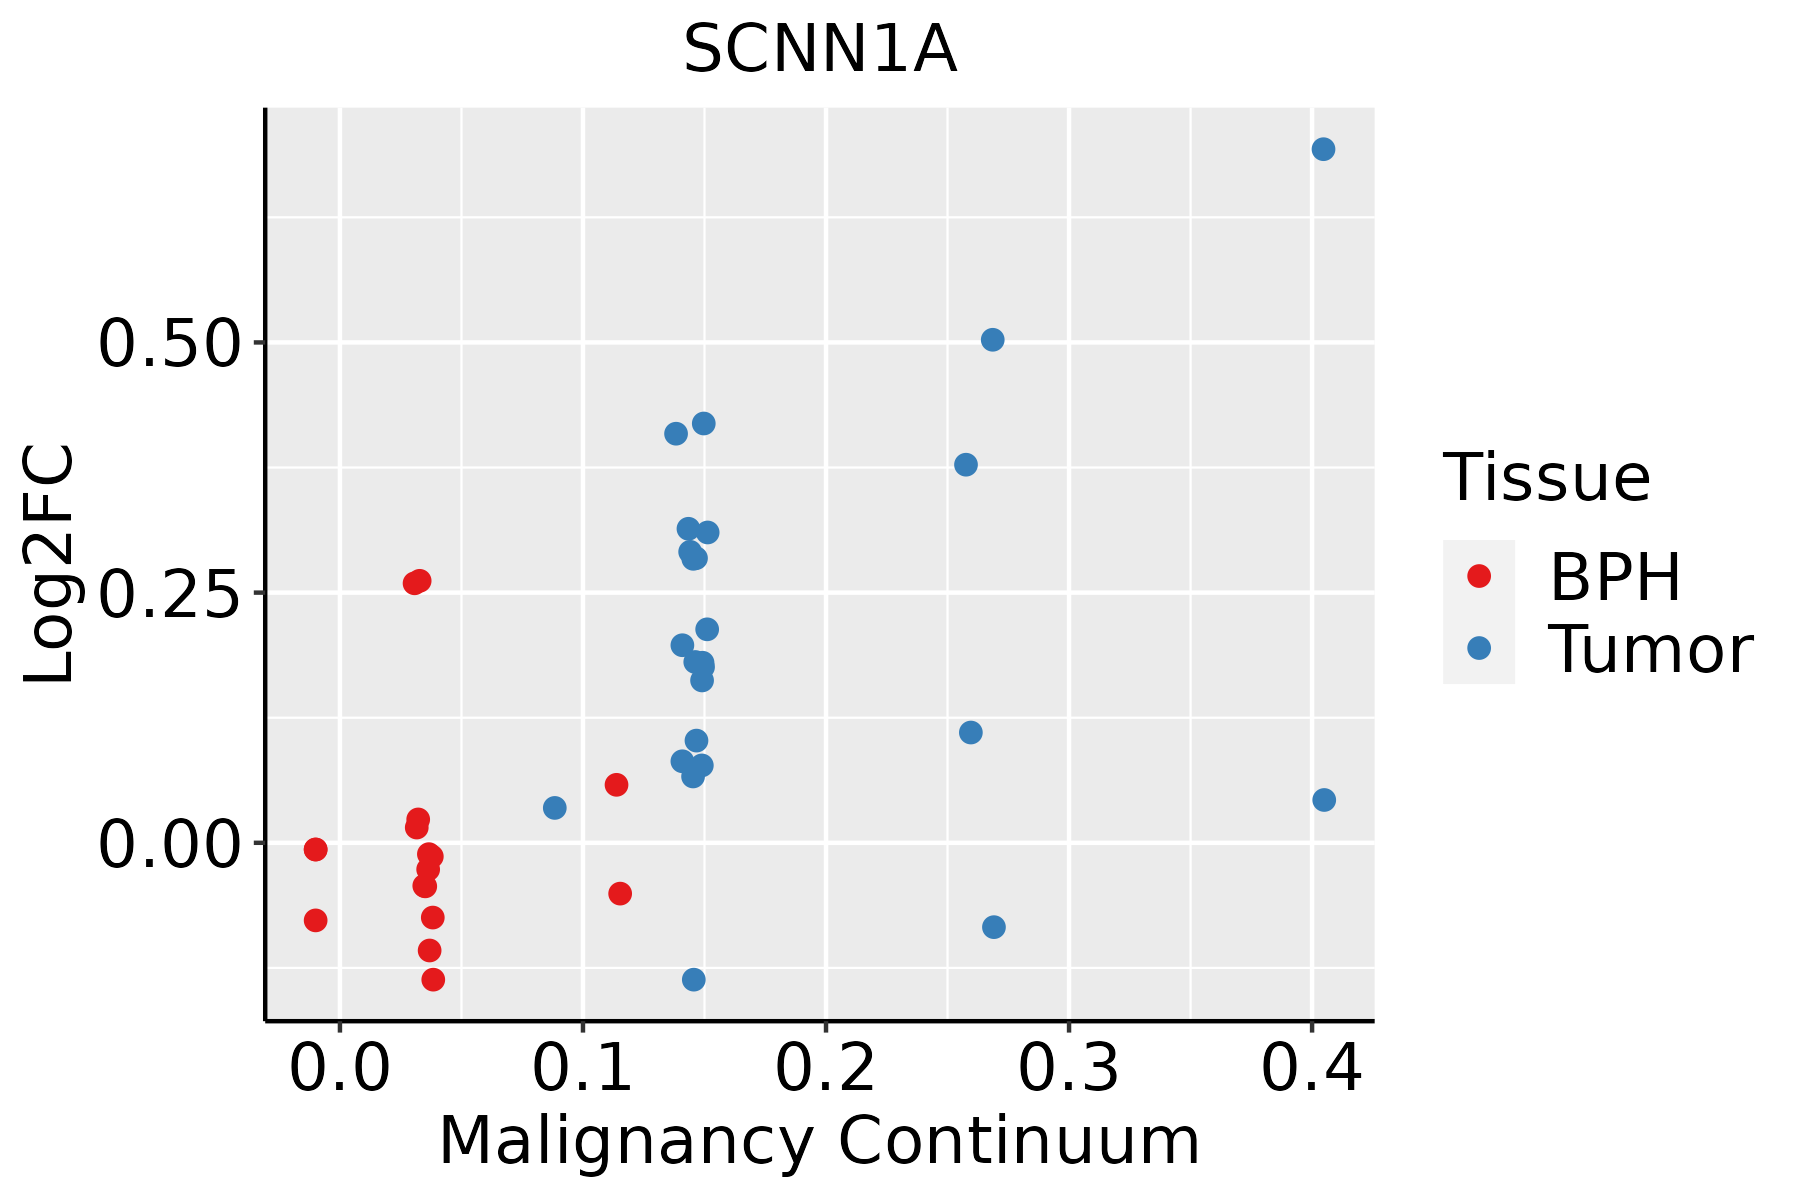
BPH: Benign Prostatic Hyperplasia
ThyroidThe image shows the transcriptomic changes along malignancy continuum.log2FC in expression of this searched gene in stem-like cells from each diseased tissue sample relative to stem-like cells in normal samples in each tissue plotted against the malignancy continuum. Samples are colored based on if they are from different disease stage.ATC: Anaplastic thyroid cancer
HT: Hashimoto's thyroiditis
PTC: Papillary thyroid cancer
∗log2FC in expression of this searched gene in stem-like cells from each diseased tissue sample relative to stem-like cells in normal samples in each tissue plotted against the malignancy continuum. Samples are colored based on if they are from different disease stage.

Top

Malignant transformation related pathway analysis

check buttonFind out the enriched GO biological processes and KEGG pathways involved in transition from healthy to precancer to cancer
check button Figure of enriched GO biological processes.
TissueDisease StageEnriched GO biological Processes
ColorectumADGO analysis - Figure of enriched GO biological processes: Top 15 enriched GO BP terms are showed in the bar plot of each disease state in each tissue. Each row represents a significant GO biological process which is colored according to the -log10(p.adjust).
ColorectumSERGO analysis - Figure of enriched GO biological processes: Top 15 enriched GO BP terms are showed in the bar plot of each disease state in each tissue. Each row represents a significant GO biological process which is colored according to the -log10(p.adjust).
ColorectumMSSGO analysis - Figure of enriched GO biological processes: Top 15 enriched GO BP terms are showed in the bar plot of each disease state in each tissue. Each row represents a significant GO biological process which is colored according to the -log10(p.adjust).
ColorectumMSI-HGO analysis - Figure of enriched GO biological processes: Top 15 enriched GO BP terms are showed in the bar plot of each disease state in each tissue. Each row represents a significant GO biological process which is colored according to the -log10(p.adjust).
ColorectumFAPGO analysis - Figure of enriched GO biological processes: Top 15 enriched GO BP terms are showed in the bar plot of each disease state in each tissue. Each row represents a significant GO biological process which is colored according to the -log10(p.adjust).
∗Top 15 enriched GO BP terms are showed in the bar plot of each disease state in each tissue. Each row represents a significant GO biological process which is colored according to the -log10(p.adjust).
Page: 1 2 3 4 5 6 7 8 9 

check button Enriched GO biological processes.
GO IDTissueDisease StageDescriptionGene RatioBg Ratiopvaluep.adjustCount
GO:0050878ColorectumADregulation of body fluid levels108/3918379/187232.54e-043.20e-03108
GO:0055067ColorectumADmonovalent inorganic cation homeostasis45/3918151/187236.19e-033.88e-0245
GO:00508781ColorectumSERregulation of body fluid levels81/2897379/187231.28e-031.43e-0281
GO:00550671ColorectumSERmonovalent inorganic cation homeostasis37/2897151/187232.48e-032.33e-0237
GO:00508782ColorectumMSSregulation of body fluid levels99/3467379/187231.40e-042.07e-0399
GO:00508783ColorectumMSI-Hregulation of body fluid levels41/1319379/187234.10e-034.67e-0241
GO:0035725ColorectumFAPsodium ion transmembrane transport44/2622178/187239.31e-051.60e-0344
GO:00508784ColorectumFAPregulation of body fluid levels79/2622379/187231.52e-042.35e-0379
GO:0006814ColorectumFAPsodium ion transport54/2622245/187233.98e-044.85e-0354
GO:00550672ColorectumFAPmonovalent inorganic cation homeostasis35/2622151/187231.58e-031.40e-0235
GO:00357251ColorectumCRCsodium ion transmembrane transport39/2078178/187232.30e-056.60e-0439
GO:00068141ColorectumCRCsodium ion transport49/2078245/187233.01e-057.86e-0449
GO:00508785ColorectumCRCregulation of body fluid levels65/2078379/187232.38e-043.96e-0365
GO:005087822LiverHCCregulation of body fluid levels191/7958379/187231.06e-036.11e-03191
GO:005087819Oral cavityOSCCregulation of body fluid levels179/7305379/187236.19e-043.50e-03179
GO:005087818ProstateTumorregulation of body fluid levels91/3246379/187235.37e-043.91e-0391
GO:0050878112ThyroidATCregulation of body fluid levels149/6293379/187231.08e-023.90e-02149
Page: 1 

check button Enriched KEGG pathways.
Pathway IDTissueDisease StageDescriptionGene RatioBg Ratiopvaluep.adjustqvalueCount
hsa04960ColorectumFAPAldosterone-regulated sodium reabsorption13/140437/84654.79e-031.91e-021.16e-0213
hsa049601ColorectumFAPAldosterone-regulated sodium reabsorption13/140437/84654.79e-031.91e-021.16e-0213
hsa049602ColorectumCRCAldosterone-regulated sodium reabsorption12/109137/84651.66e-031.20e-028.16e-0312
hsa049603ColorectumCRCAldosterone-regulated sodium reabsorption12/109137/84651.66e-031.20e-028.16e-0312
Page: 1 

Top

Cell-cell communication analysis

check buttonIdentification of potential cell-cell interactions between two cell types and their ligand-receptor pairs for different disease states
LigandReceptorLRpairPathwayTissueDisease Stage
Page: 1 

Top

Single-cell gene regulatory network inference analysis

check buttonFind out the significant the regulons (TFs) and the target genes of each regulon across cell types for different disease states
TFCell TypeTissueDisease StageTarget GeneRSSRegulon Activity
∗The dot plots of a searched regulon are shown for all cell subpopulations in each disease state of each tissue based on the regulon specific score inferred using pySCENIC and by calculating the average expression.
Page: 1 

Top

Somatic mutation of malignant transformation related genes

check buttonAnnotation of somatic variants for genes involved in malignant transformation
Hugo SymbolVariant ClassVariant ClassificationdbSNP RSHGVScHGVSpHGVSp ShortSWISSPROTBIOTYPESIFTPolyPhenTumor Sample BarcodeTissueHistologySexAgeStageTherapy TypesDrugsOutcome
SCNN1ASNVMissense_Mutationc.1637N>Gp.Ser546Cysp.S546CP37088protein_codingdeleterious(0)probably_damaging(0.996)TCGA-A8-A09G-01Breastbreast invasive carcinomaFemale>=65III/IVUnknownUnknownSD
SCNN1ASNVMissense_Mutationc.344N>Ap.Arg115Glnp.R115QP37088protein_codingtolerated(0.18)benign(0.329)TCGA-AC-A23H-01Breastbreast invasive carcinomaFemale>=65I/IIUnknownUnknownPD
SCNN1ASNVMissense_Mutationc.2009N>Tp.Ser670Phep.S670FP37088protein_codingdeleterious(0)possibly_damaging(0.66)TCGA-BH-A18G-01Breastbreast invasive carcinomaFemale>=65I/IIUnknownUnknownSD
SCNN1ASNVMissense_Mutationrs779507200c.1019N>Tp.Ala340Valp.A340VP37088protein_codingdeleterious(0)benign(0.373)TCGA-D8-A1JP-01Breastbreast invasive carcinomaFemale>=65I/IIHormone TherapytamoxiphenSD
SCNN1AinsertionIn_Frame_Insnovelc.475_476insTATGGAGAAAGCAAAGAGGGGGATCGTGGAGGTTAGp.Trp159delinsLeuTrpArgLysGlnArgGlyGlySerTrpArgLeuGlyp.W159delinsLWRKQRGGSWRLGP37088protein_codingTCGA-B6-A0IA-01Breastbreast invasive carcinomaFemale<65I/IIUnknownUnknownSD
SCNN1ASNVMissense_Mutationnovelc.2092N>Ap.Ala698Thrp.A698TP37088protein_codingtolerated_low_confidence(0.19)benign(0.135)TCGA-2W-A8YY-01Cervixcervical & endocervical cancerFemale<65I/IIChemotherapycisplatinCR
SCNN1ASNVMissense_Mutationrs755217190c.1076N>Tp.Pro359Leup.P359LP37088protein_codingdeleterious(0.01)possibly_damaging(0.844)TCGA-2W-A8YY-01Cervixcervical & endocervical cancerFemale<65I/IIChemotherapycisplatinCR
SCNN1ASNVMissense_Mutationc.1301N>Ap.Thr434Asnp.T434NP37088protein_codingdeleterious(0.02)possibly_damaging(0.477)TCGA-C5-A2LX-01Cervixcervical & endocervical cancerFemale<65I/IIChemotherapycisplatinSD
SCNN1ASNVMissense_Mutationc.2023C>Tp.His675Tyrp.H675YP37088protein_codingtolerated(0.68)benign(0.253)TCGA-JW-A5VL-01Cervixcervical & endocervical cancerFemale<65I/IIUnknownUnknownSD
SCNN1ASNVMissense_Mutationc.613N>Cp.Glu205Glnp.E205QP37088protein_codingtolerated(0.28)benign(0.012)TCGA-Q1-A73O-01Cervixcervical & endocervical cancerFemale<65I/IIChemotherapycisplatinCR
Page: 1 2 3 4 5 

Top

Related drugs of malignant transformation related genes

check buttonIdentification of chemicals and drugs interact with genes involved in malignant transfromation
(DGIdb 4.0)
Entrez IDSymbolCategoryInteraction TypesDrug Claim NameDrug NamePMIDs
6337SCNN1ADRUGGABLE GENOME, ION CHANNELtriamtereneTRIAMTERENE23788015
6337SCNN1ADRUGGABLE GENOME, ION CHANNELblockerCHEMBL585TRIAMTERENE
6337SCNN1ADRUGGABLE GENOME, ION CHANNELTRIAMTERENETRIAMTERENE
6337SCNN1ADRUGGABLE GENOME, ION CHANNELGS-9411
6337SCNN1ADRUGGABLE GENOME, ION CHANNELAMILORIDEAMILORIDE
6337SCNN1ADRUGGABLE GENOME, ION CHANNELamilorideAMILORIDE23788015
6337SCNN1ADRUGGABLE GENOME, ION CHANNELblockerCHEMBL1398126AMILORIDE HYDROCHLORIDE
6337SCNN1ADRUGGABLE GENOME, ION CHANNELP-552
6337SCNN1ADRUGGABLE GENOME, ION CHANNELTRIAMTERENETRIAMTERENE
Page: 1 2