| Tissue | Expression Dynamics | Abbreviation |
| Colorectum (GSE201348) |  | FAP: Familial adenomatous polyposis |
| CRC: Colorectal cancer |
| Colorectum (HTA11) |  | AD: Adenomas |
| SER: Sessile serrated lesions |
| MSI-H: Microsatellite-high colorectal cancer |
| MSS: Microsatellite stable colorectal cancer |
| Esophagus | 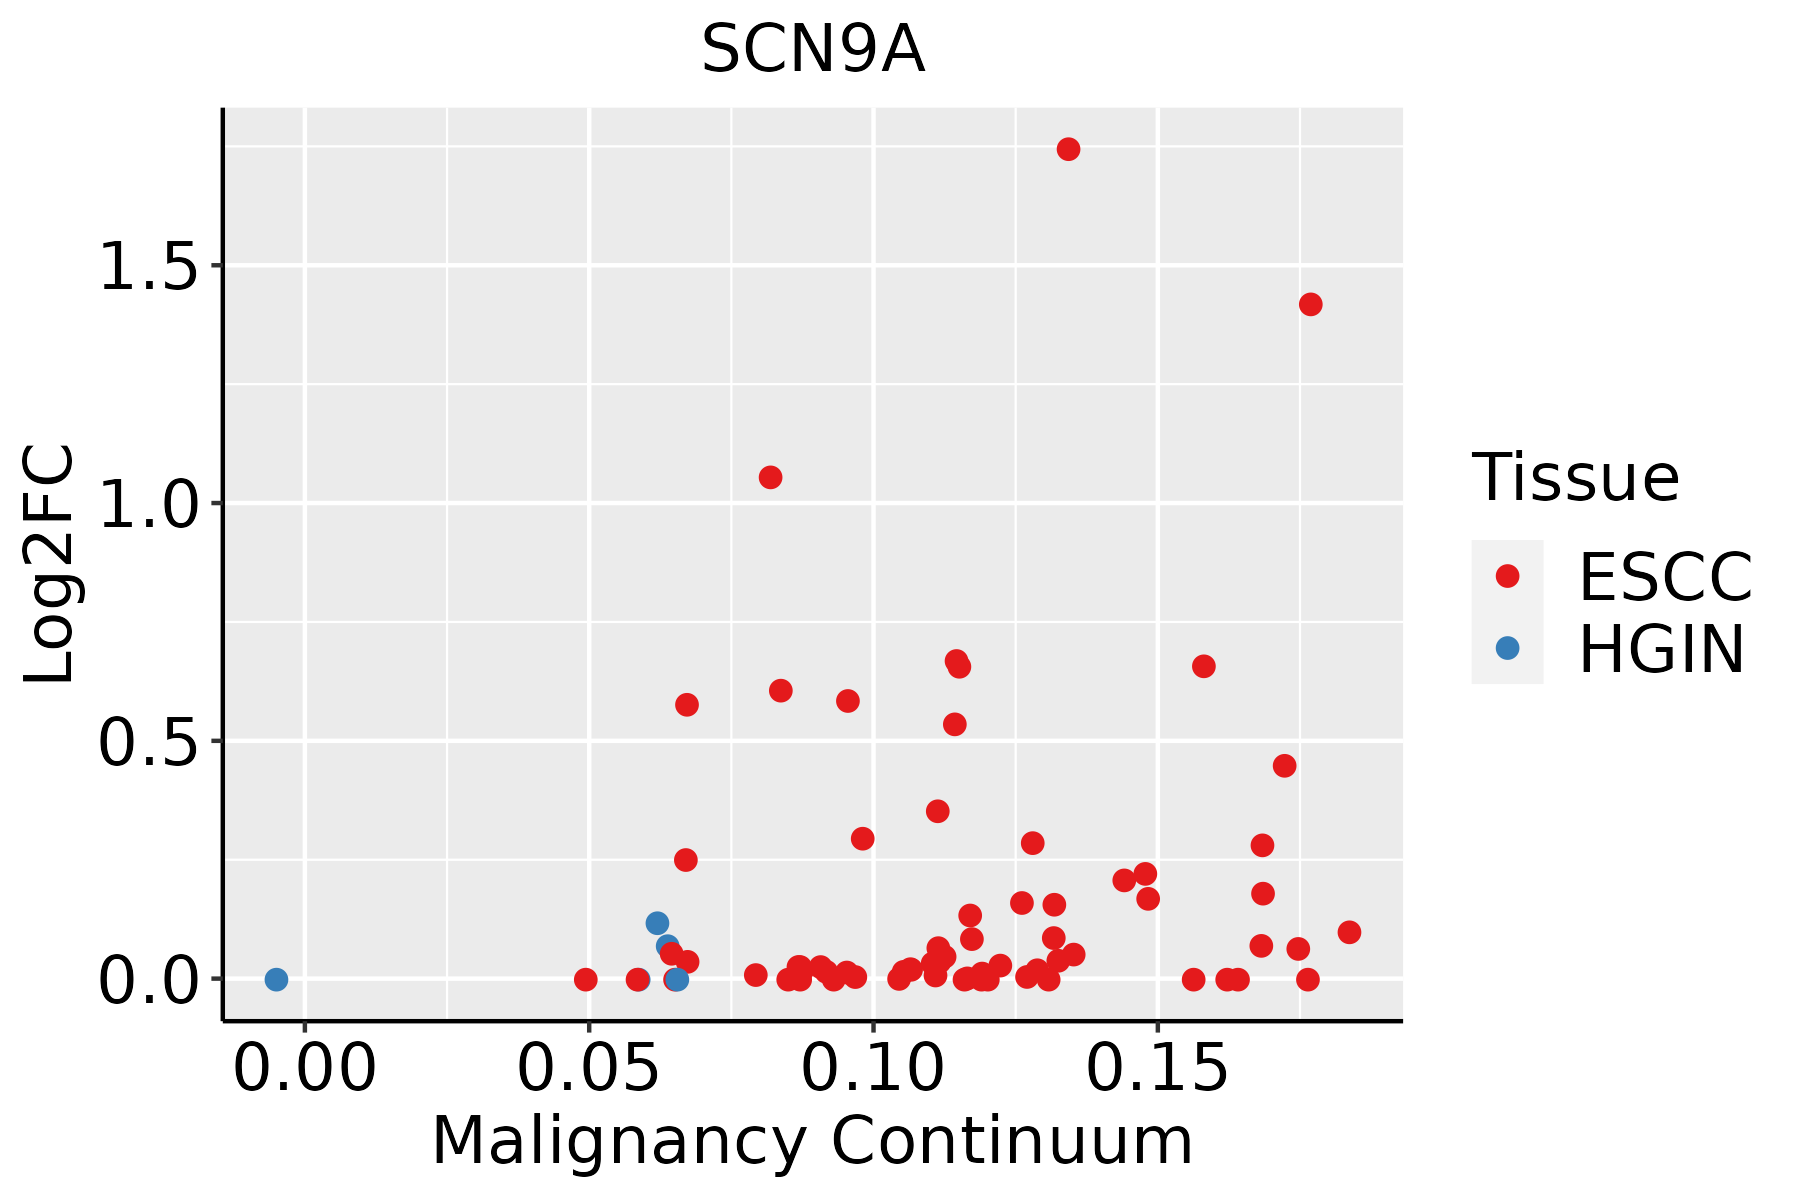 | ESCC: Esophageal squamous cell carcinoma |
| HGIN: High-grade intraepithelial neoplasias |
| LGIN: Low-grade intraepithelial neoplasias |
| Thyroid | 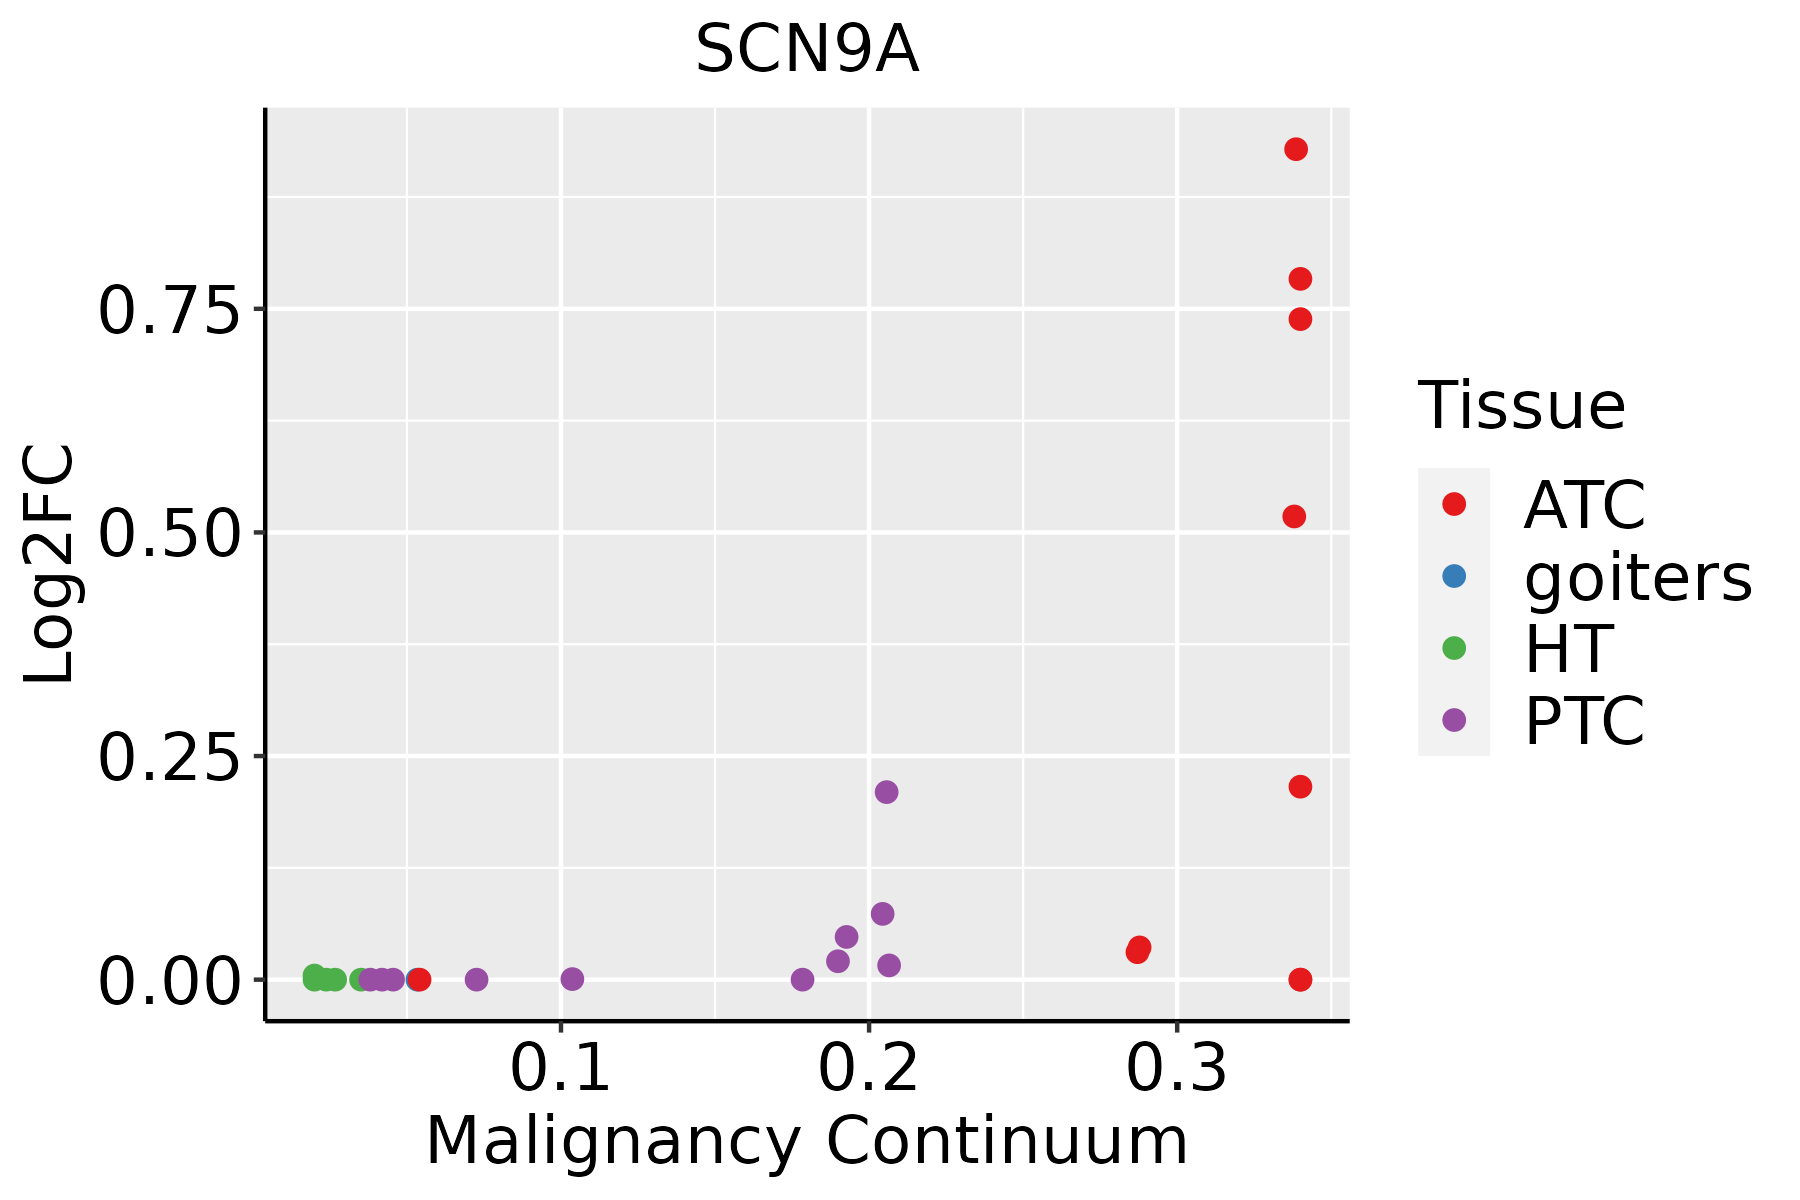 | ATC: Anaplastic thyroid cancer |
| HT: Hashimoto's thyroiditis |
| PTC: Papillary thyroid cancer |
| GO ID | Tissue | Disease Stage | Description | Gene Ratio | Bg Ratio | pvalue | p.adjust | Count |
| GO:0009636 | Colorectum | AD | response to toxic substance | 88/3918 | 262/18723 | 1.12e-06 | 3.72e-05 | 88 |
| GO:0009791 | Colorectum | AD | post-embryonic development | 29/3918 | 80/18723 | 1.13e-03 | 1.03e-02 | 29 |
| GO:00096361 | Colorectum | SER | response to toxic substance | 71/2897 | 262/18723 | 8.63e-07 | 4.07e-05 | 71 |
| GO:00097911 | Colorectum | SER | post-embryonic development | 22/2897 | 80/18723 | 4.12e-03 | 3.36e-02 | 22 |
| GO:00096362 | Colorectum | MSS | response to toxic substance | 73/3467 | 262/18723 | 1.26e-04 | 1.94e-03 | 73 |
| GO:00097912 | Colorectum | MSS | post-embryonic development | 26/3467 | 80/18723 | 1.91e-03 | 1.66e-02 | 26 |
| GO:0035725 | Colorectum | FAP | sodium ion transmembrane transport | 44/2622 | 178/18723 | 9.31e-05 | 1.60e-03 | 44 |
| GO:0001508 | Colorectum | FAP | action potential | 34/2622 | 134/18723 | 3.30e-04 | 4.22e-03 | 34 |
| GO:0006814 | Colorectum | FAP | sodium ion transport | 54/2622 | 245/18723 | 3.98e-04 | 4.85e-03 | 54 |
| GO:00097913 | Colorectum | FAP | post-embryonic development | 23/2622 | 80/18723 | 4.51e-04 | 5.32e-03 | 23 |
| GO:00096363 | Colorectum | FAP | response to toxic substance | 53/2622 | 262/18723 | 3.35e-03 | 2.46e-02 | 53 |
| GO:00015081 | Colorectum | CRC | action potential | 32/2078 | 134/18723 | 2.02e-05 | 5.90e-04 | 32 |
| GO:00357251 | Colorectum | CRC | sodium ion transmembrane transport | 39/2078 | 178/18723 | 2.30e-05 | 6.60e-04 | 39 |
| GO:00068141 | Colorectum | CRC | sodium ion transport | 49/2078 | 245/18723 | 3.01e-05 | 7.86e-04 | 49 |
| GO:00097914 | Colorectum | CRC | post-embryonic development | 20/2078 | 80/18723 | 3.62e-04 | 5.45e-03 | 20 |
| GO:0035637 | Colorectum | CRC | multicellular organismal signaling | 31/2078 | 160/18723 | 1.39e-03 | 1.52e-02 | 31 |
| GO:0042391 | Colorectum | CRC | regulation of membrane potential | 67/2078 | 434/18723 | 3.27e-03 | 2.81e-02 | 67 |
| GO:00097919 | Esophagus | ESCC | post-embryonic development | 56/8552 | 80/18723 | 9.08e-06 | 8.71e-05 | 56 |
| GO:000963620 | Esophagus | ESCC | response to toxic substance | 150/8552 | 262/18723 | 1.00e-04 | 7.12e-04 | 150 |
| GO:000979114 | Thyroid | PTC | post-embryonic development | 48/5968 | 80/18723 | 1.99e-07 | 3.56e-06 | 48 |
| Hugo Symbol | Variant Class | Variant Classification | dbSNP RS | HGVSc | HGVSp | HGVSp Short | SWISSPROT | BIOTYPE | SIFT | PolyPhen | Tumor Sample Barcode | Tissue | Histology | Sex | Age | Stage | Therapy Types | Drugs | Outcome |
| SCN9A | SNV | Missense_Mutation | | c.2632G>T | p.Gly878Cys | p.G878C | Q15858 | protein_coding | deleterious(0) | probably_damaging(0.997) | TCGA-A2-A04W-01 | Breast | breast invasive carcinoma | Female | <65 | I/II | Chemotherapy | cytoxan | SD |
| SCN9A | SNV | Missense_Mutation | rs766441372 | c.1954C>G | p.Gln652Glu | p.Q652E | Q15858 | protein_coding | tolerated(1) | benign(0.001) | TCGA-A8-A095-01 | Breast | breast invasive carcinoma | Female | <65 | I/II | Chemotherapy | 5-fluorouracil | CR |
| SCN9A | SNV | Missense_Mutation | novel | c.2260N>T | p.His754Tyr | p.H754Y | Q15858 | protein_coding | tolerated(0.05) | possibly_damaging(0.888) | TCGA-A8-A09Q-01 | Breast | breast invasive carcinoma | Female | >=65 | III/IV | Hormone Therapy | anastrozole | SD |
| SCN9A | SNV | Missense_Mutation | novel | c.4168N>G | p.Gln1390Glu | p.Q1390E | Q15858 | protein_coding | deleterious(0) | probably_damaging(0.995) | TCGA-AC-A23H-01 | Breast | breast invasive carcinoma | Female | >=65 | I/II | Unknown | Unknown | PD |
| SCN9A | SNV | Missense_Mutation | | c.3542N>C | p.Ser1181Thr | p.S1181T | Q15858 | protein_coding | deleterious(0.03) | benign(0.05) | TCGA-AC-A23H-01 | Breast | breast invasive carcinoma | Female | >=65 | I/II | Unknown | Unknown | PD |
| SCN9A | SNV | Missense_Mutation | | c.3436N>A | p.Asp1146Asn | p.D1146N | Q15858 | protein_coding | deleterious(0) | possibly_damaging(0.728) | TCGA-AC-A23H-01 | Breast | breast invasive carcinoma | Female | >=65 | I/II | Unknown | Unknown | PD |
| SCN9A | SNV | Missense_Mutation | | c.2668N>A | p.Asp890Asn | p.D890N | Q15858 | protein_coding | tolerated(0.42) | benign(0.006) | TCGA-AC-A23H-01 | Breast | breast invasive carcinoma | Female | >=65 | I/II | Unknown | Unknown | PD |
| SCN9A | SNV | Missense_Mutation | novel | c.4009T>C | p.Tyr1337His | p.Y1337H | Q15858 | protein_coding | tolerated(0.34) | benign(0.274) | TCGA-AC-A3TM-01 | Breast | breast invasive carcinoma | Female | <65 | III/IV | Chemotherapy | cytoxan | CR |
| SCN9A | SNV | Missense_Mutation | novel | c.5503N>G | p.Thr1835Ala | p.T1835A | Q15858 | protein_coding | deleterious(0.03) | possibly_damaging(0.66) | TCGA-AN-A046-01 | Breast | breast invasive carcinoma | Female | >=65 | I/II | Unknown | Unknown | SD |
| SCN9A | SNV | Missense_Mutation | rs202083986 | c.553N>T | p.Arg185Cys | p.R185C | Q15858 | protein_coding | deleterious(0) | probably_damaging(1) | TCGA-AN-A046-01 | Breast | breast invasive carcinoma | Female | >=65 | I/II | Unknown | Unknown | SD |
| Entrez ID | Symbol | Category | Interaction Types | Drug Claim Name | Drug Name | PMIDs |
| 6335 | SCN9A | DRUGGABLE GENOME, ION CHANNEL | | DWJ-208 | | |
| 6335 | SCN9A | DRUGGABLE GENOME, ION CHANNEL | blocker | CHEMBL16 | PHENYTOIN | |
| 6335 | SCN9A | DRUGGABLE GENOME, ION CHANNEL | blocker | 135652722 | TETRODOTOXIN | |
| 6335 | SCN9A | DRUGGABLE GENOME, ION CHANNEL | | Benzene sulfonamide derivative 11 | | |
| 6335 | SCN9A | DRUGGABLE GENOME, ION CHANNEL | blocker | CHEMBL1200773 | TOCAINIDE HYDROCHLORIDE | |
| 6335 | SCN9A | DRUGGABLE GENOME, ION CHANNEL | | Benzene sulfonamide derivative 15 | | |
| 6335 | SCN9A | DRUGGABLE GENOME, ION CHANNEL | blocker | CHEMBL1200597 | ETIDOCAINE HYDROCHLORIDE | |
| 6335 | SCN9A | DRUGGABLE GENOME, ION CHANNEL | blocker | CHEMBL2107771 | RALFINAMIDE | |
| 6335 | SCN9A | DRUGGABLE GENOME, ION CHANNEL | | Aryl carboxamide derivative 4 | | |
| 6335 | SCN9A | DRUGGABLE GENOME, ION CHANNEL | | RANOLAZINE | RANOLAZINE | |


