
|
|||||
|
 | |
| |
| |
| |
| |
| |
|
Gene: SCML1 |
Gene summary for SCML1 |
| Gene information | Species | Human | Gene symbol | SCML1 | Gene ID | 6322 |
| Gene name | Scm polycomb group protein like 1 | |
| Gene Alias | SCML1 | |
| Cytomap | Xp22.13 | |
| Gene Type | protein-coding | GO ID | GO:0006139 | UniProtAcc | A0A024RBY0 |
Top |
Malignant transformation analysis |
| Identification of the aberrant gene expression in precancerous and cancerous lesions by comparing the gene expression of stem-like cells in diseased tissues with normal stem cells |
| Entrez ID | Symbol | Replicates | Species | Organ | Tissue | Adj P-value | Log2FC | Malignancy |
| 6322 | SCML1 | HTA11_347_2000001011 | Human | Colorectum | AD | 2.58e-07 | 3.21e-01 | -0.1954 |
| 6322 | SCML1 | HTA11_99999970781_79442 | Human | Colorectum | MSS | 1.03e-18 | 8.85e-01 | 0.294 |
| 6322 | SCML1 | HTA11_99999965104_69814 | Human | Colorectum | MSS | 1.23e-21 | 1.03e+00 | 0.281 |
| 6322 | SCML1 | HTA11_99999971662_82457 | Human | Colorectum | MSS | 8.91e-11 | 7.16e-01 | 0.3859 |
| 6322 | SCML1 | HTA11_99999974143_84620 | Human | Colorectum | MSS | 4.37e-07 | 4.86e-01 | 0.3005 |
| 6322 | SCML1 | A015-C-203 | Human | Colorectum | FAP | 1.04e-05 | -1.46e-02 | -0.1294 |
| 6322 | SCML1 | A015-C-104 | Human | Colorectum | FAP | 2.19e-05 | -1.30e-02 | -0.1899 |
| 6322 | SCML1 | A015-C-202 | Human | Colorectum | FAP | 1.28e-04 | 2.80e-01 | -0.0849 |
| 6322 | SCML1 | A002-C-016 | Human | Colorectum | FAP | 1.08e-03 | 3.99e-02 | 0.0521 |
| 6322 | SCML1 | A002-C-116 | Human | Colorectum | FAP | 4.36e-08 | -2.22e-01 | -0.0452 |
| 6322 | SCML1 | F034 | Human | Colorectum | FAP | 3.09e-02 | -2.05e-02 | -0.0665 |
| 6322 | SCML1 | LZE4T | Human | Esophagus | ESCC | 5.52e-07 | 3.62e-01 | 0.0811 |
| 6322 | SCML1 | LZE24T | Human | Esophagus | ESCC | 9.82e-04 | 6.23e-02 | 0.0596 |
| 6322 | SCML1 | LZE21T | Human | Esophagus | ESCC | 2.42e-06 | 2.57e-01 | 0.0655 |
| 6322 | SCML1 | P1T-E | Human | Esophagus | ESCC | 8.69e-08 | 3.28e-01 | 0.0875 |
| 6322 | SCML1 | P2T-E | Human | Esophagus | ESCC | 9.76e-29 | 4.59e-01 | 0.1177 |
| 6322 | SCML1 | P4T-E | Human | Esophagus | ESCC | 1.13e-07 | 2.82e-01 | 0.1323 |
| 6322 | SCML1 | P5T-E | Human | Esophagus | ESCC | 2.65e-06 | 1.65e-01 | 0.1327 |
| 6322 | SCML1 | P8T-E | Human | Esophagus | ESCC | 2.19e-10 | 1.94e-01 | 0.0889 |
| 6322 | SCML1 | P9T-E | Human | Esophagus | ESCC | 1.18e-04 | 1.72e-01 | 0.1131 |
| Page: 1 2 3 4 5 |
| Tissue | Expression Dynamics | Abbreviation |
| Colorectum (GSE201348) |  | FAP: Familial adenomatous polyposis |
| CRC: Colorectal cancer | ||
| Colorectum (HTA11) |  | AD: Adenomas |
| SER: Sessile serrated lesions | ||
| MSI-H: Microsatellite-high colorectal cancer | ||
| MSS: Microsatellite stable colorectal cancer | ||
| Esophagus |  | ESCC: Esophageal squamous cell carcinoma |
| HGIN: High-grade intraepithelial neoplasias | ||
| LGIN: Low-grade intraepithelial neoplasias | ||
| Liver | 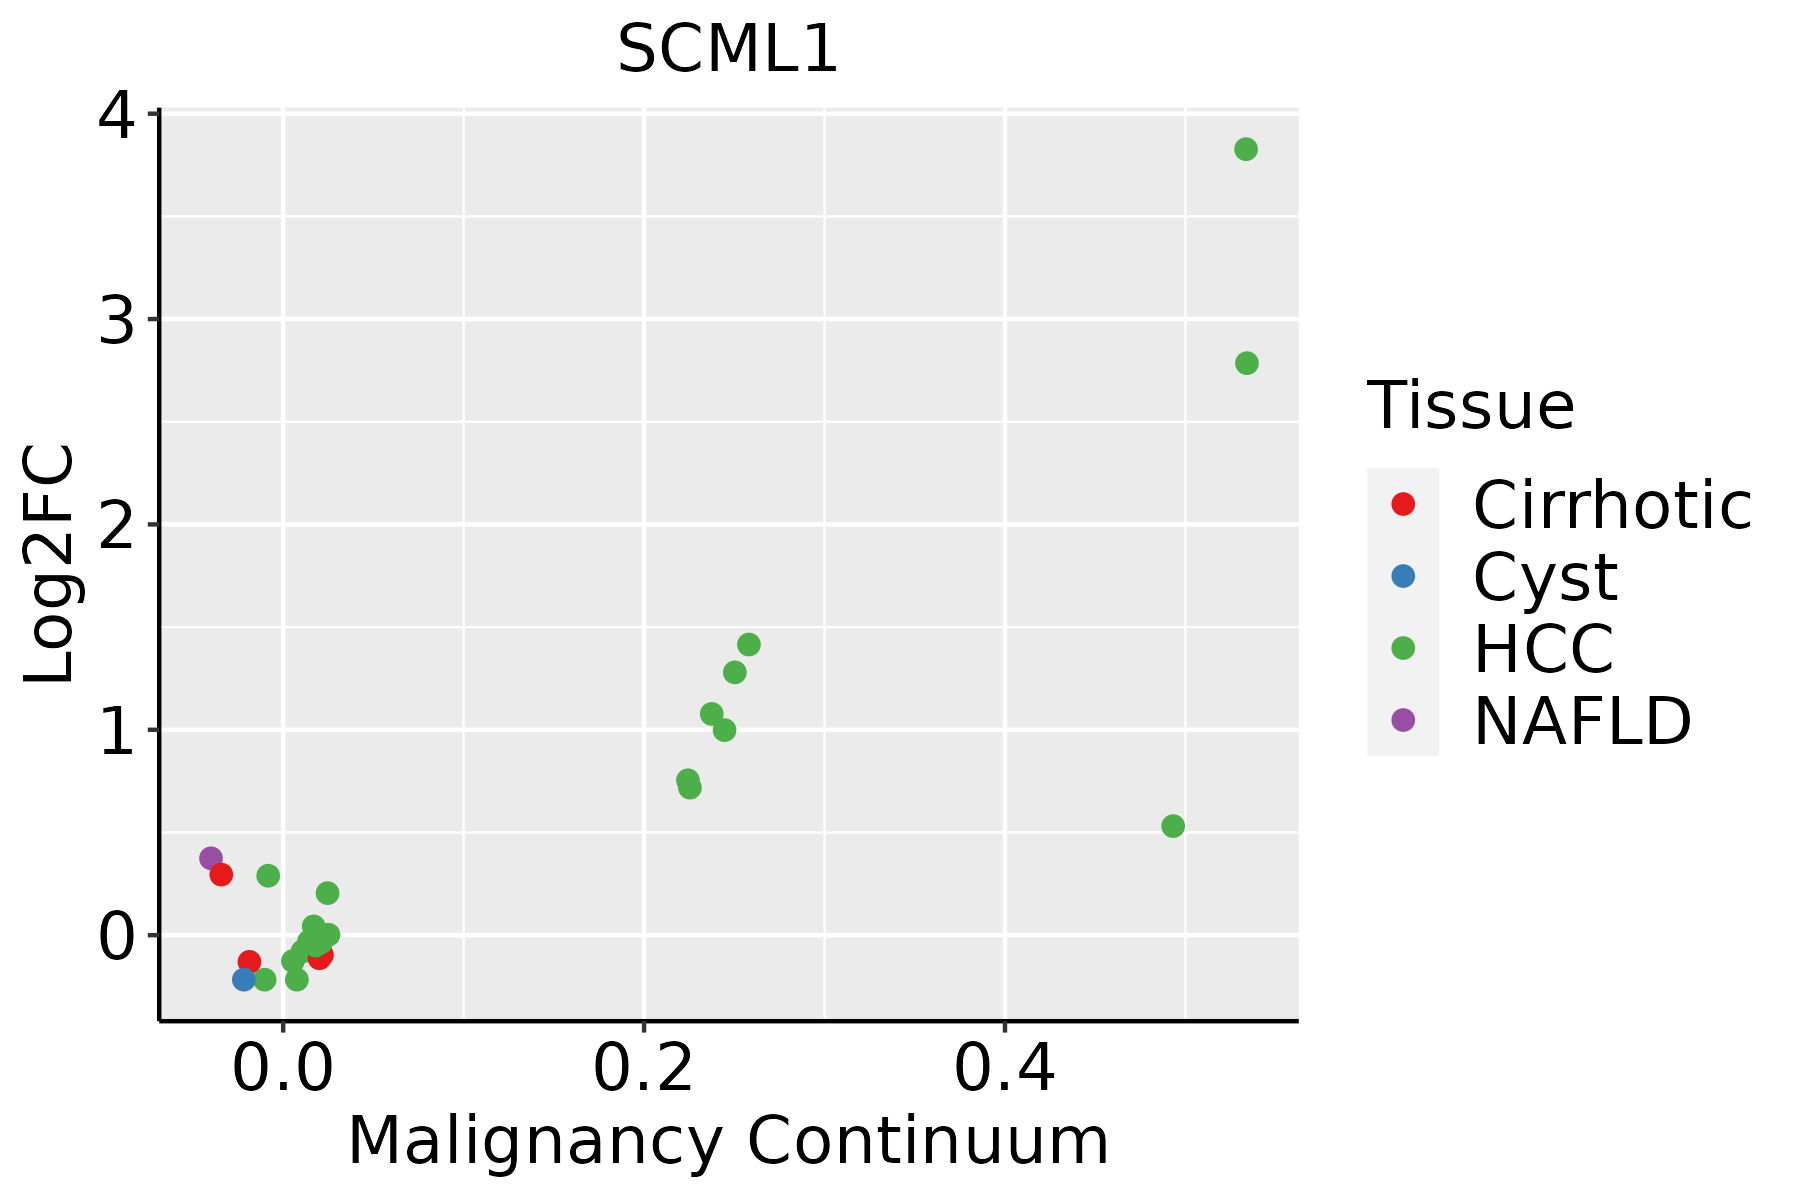 | HCC: Hepatocellular carcinoma |
| NAFLD: Non-alcoholic fatty liver disease | ||
| Thyroid | 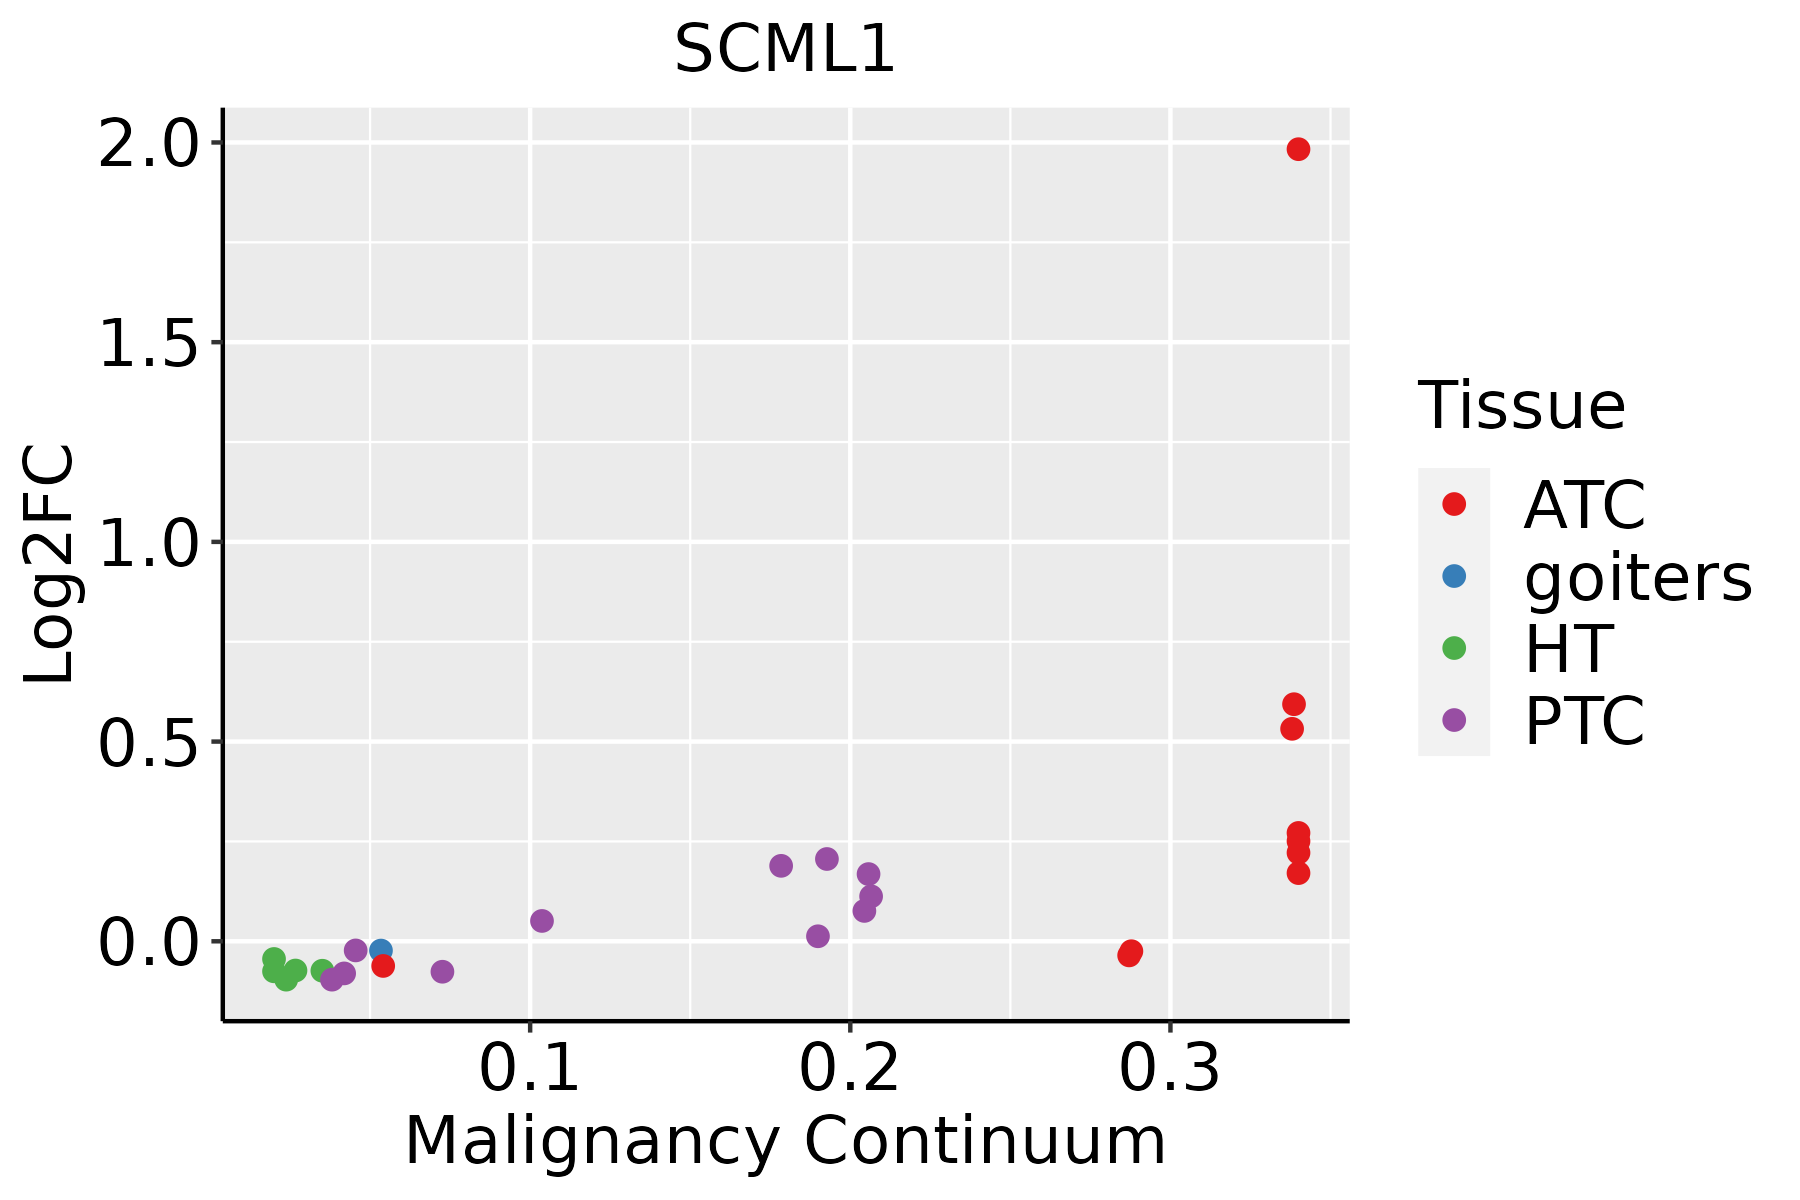 | ATC: Anaplastic thyroid cancer |
| HT: Hashimoto's thyroiditis | ||
| PTC: Papillary thyroid cancer |
| ∗log2FC in expression of this searched gene in stem-like cells from each diseased tissue sample relative to stem-like cells in normal samples in each tissue plotted against the malignancy continuum. Samples are colored based on if they are from different disease stage. |
Top |
Malignant transformation related pathway analysis |
| Find out the enriched GO biological processes and KEGG pathways involved in transition from healthy to precancer to cancer |
| Tissue | Disease Stage | Enriched GO biological Processes |
| Colorectum | AD |  |
| Colorectum | SER |  |
| Colorectum | MSS |  |
| Colorectum | MSI-H |  |
| Colorectum | FAP |  |
| ∗Top 15 enriched GO BP terms are showed in the bar plot of each disease state in each tissue. Each row represents a significant GO biological process which is colored according to the -log10(p.adjust). |
| Page: 1 2 3 4 5 6 7 8 9 |
| GO ID | Tissue | Disease Stage | Description | Gene Ratio | Bg Ratio | pvalue | p.adjust | Count |
| Page: 1 |
| Pathway ID | Tissue | Disease Stage | Description | Gene Ratio | Bg Ratio | pvalue | p.adjust | qvalue | Count |
| Page: 1 |
Top |
Cell-cell communication analysis |
| Identification of potential cell-cell interactions between two cell types and their ligand-receptor pairs for different disease states |
| Ligand | Receptor | LRpair | Pathway | Tissue | Disease Stage |
| Page: 1 |
Top |
Single-cell gene regulatory network inference analysis |
| Find out the significant the regulons (TFs) and the target genes of each regulon across cell types for different disease states |
| TF | Cell Type | Tissue | Disease Stage | Target Gene | RSS | Regulon Activity |
| ∗The dot plots of a searched regulon are shown for all cell subpopulations in each disease state of each tissue based on the regulon specific score inferred using pySCENIC and by calculating the average expression. |
| Page: 1 |
Top |
Somatic mutation of malignant transformation related genes |
| Annotation of somatic variants for genes involved in malignant transformation |
| Hugo Symbol | Variant Class | Variant Classification | dbSNP RS | HGVSc | HGVSp | HGVSp Short | SWISSPROT | BIOTYPE | SIFT | PolyPhen | Tumor Sample Barcode | Tissue | Histology | Sex | Age | Stage | Therapy Types | Drugs | Outcome |
| SCML1 | SNV | Missense_Mutation | rs777123192 | c.25N>G | p.Ile9Val | p.I9V | Q9UN30 | protein_coding | tolerated(1) | benign(0.001) | TCGA-A2-A04T-01 | Breast | breast invasive carcinoma | Female | <65 | I/II | Chemotherapy | cyclophosphamide | SD |
| SCML1 | SNV | Missense_Mutation | novel | c.277N>A | p.His93Asn | p.H93N | Q9UN30 | protein_coding | tolerated(0.12) | benign(0) | TCGA-A8-A08H-01 | Breast | breast invasive carcinoma | Female | >=65 | I/II | Unknown | Unknown | SD |
| SCML1 | SNV | Missense_Mutation | novel | c.629G>T | p.Cys210Phe | p.C210F | Q9UN30 | protein_coding | deleterious(0.04) | benign(0.02) | TCGA-AN-A046-01 | Breast | breast invasive carcinoma | Female | >=65 | I/II | Unknown | Unknown | SD |
| SCML1 | SNV | Missense_Mutation | novel | c.545T>A | p.Val182Glu | p.V182E | Q9UN30 | protein_coding | tolerated(0.93) | probably_damaging(0.954) | TCGA-AO-A0J9-01 | Breast | breast invasive carcinoma | Female | <65 | III/IV | Chemotherapy | cyclophosphamide | PD |
| SCML1 | SNV | Missense_Mutation | c.403N>A | p.Glu135Lys | p.E135K | Q9UN30 | protein_coding | tolerated(0.2) | benign(0.022) | TCGA-B6-A0IK-01 | Breast | breast invasive carcinoma | Female | <65 | III/IV | Unknown | Unknown | PD | |
| SCML1 | SNV | Missense_Mutation | novel | c.939N>T | p.Lys313Asn | p.K313N | Q9UN30 | protein_coding | deleterious(0) | probably_damaging(1) | TCGA-GM-A5PV-01 | Breast | breast invasive carcinoma | Female | <65 | I/II | Chemotherapy | taxotere | CR |
| SCML1 | insertion | Nonsense_Mutation | novel | c.513_514insTTTTCTAAAATGTTAAGCAAAAATTCTCTTTATCTCACATAAA | p.Asp172PhefsTer14 | p.D172Ffs*14 | Q9UN30 | protein_coding | TCGA-A2-A0EM-01 | Breast | breast invasive carcinoma | Female | >=65 | I/II | Hormone Therapy | tamoxiphen | SD | ||
| SCML1 | insertion | Frame_Shift_Ins | novel | c.276_277insTTGAATGG | p.His93LeufsTer33 | p.H93Lfs*33 | Q9UN30 | protein_coding | TCGA-A8-A08H-01 | Breast | breast invasive carcinoma | Female | >=65 | I/II | Unknown | Unknown | SD | ||
| SCML1 | deletion | Frame_Shift_Del | novel | c.745_749delNNNNN | p.Gly249HisfsTer3 | p.G249Hfs*3 | Q9UN30 | protein_coding | TCGA-A8-A0A4-01 | Breast | breast invasive carcinoma | Female | >=65 | I/II | Hormone Therapy | tamoxiphen | CR | ||
| SCML1 | insertion | Nonsense_Mutation | novel | c.547_548insCCATTACCAACCAAATGTAGTTATGTCTCTTTCATCT | p.His183ProfsTer7 | p.H183Pfs*7 | Q9UN30 | protein_coding | TCGA-AO-A0J9-01 | Breast | breast invasive carcinoma | Female | <65 | III/IV | Chemotherapy | cyclophosphamide | PD |
| Page: 1 2 3 4 5 |
Top |
Related drugs of malignant transformation related genes |
| Identification of chemicals and drugs interact with genes involved in malignant transfromation |
| (DGIdb 4.0) |
| Entrez ID | Symbol | Category | Interaction Types | Drug Claim Name | Drug Name | PMIDs |
| Page: 1 |

Copyright 2023-Present -The University of Texas Health Science Center at Houston |