
|
|||||
|
 | |
| |
| |
| |
| |
| |
|
Gene: SCLY |
Gene summary for SCLY |
| Gene information | Species | Human | Gene symbol | SCLY | Gene ID | 51540 |
| Gene name | selenocysteine lyase | |
| Gene Alias | SCL | |
| Cytomap | 2q37.3 | |
| Gene Type | protein-coding | GO ID | GO:0006082 | UniProtAcc | A0A0A0MQU4 |
Top |
Malignant transformation analysis |
| Identification of the aberrant gene expression in precancerous and cancerous lesions by comparing the gene expression of stem-like cells in diseased tissues with normal stem cells |
| Entrez ID | Symbol | Replicates | Species | Organ | Tissue | Adj P-value | Log2FC | Malignancy |
| 51540 | SCLY | HTA11_3410_2000001011 | Human | Colorectum | AD | 2.46e-11 | 2.27e-01 | 0.0155 |
| 51540 | SCLY | HTA11_78_2000001011 | Human | Colorectum | AD | 1.66e-02 | 1.45e-01 | -0.1088 |
| 51540 | SCLY | HTA11_347_2000001011 | Human | Colorectum | AD | 2.51e-09 | 2.18e-01 | -0.1954 |
| 51540 | SCLY | HTA11_83_2000001011 | Human | Colorectum | SER | 4.23e-03 | 1.77e-01 | -0.1526 |
| 51540 | SCLY | HTA11_696_2000001011 | Human | Colorectum | AD | 4.07e-04 | 1.39e-01 | -0.1464 |
| 51540 | SCLY | HTA11_866_2000001011 | Human | Colorectum | AD | 9.55e-09 | 2.09e-01 | -0.1001 |
| 51540 | SCLY | HTA11_1391_2000001011 | Human | Colorectum | AD | 5.65e-19 | 4.26e-01 | -0.059 |
| 51540 | SCLY | HTA11_866_3004761011 | Human | Colorectum | AD | 3.51e-07 | 2.11e-01 | 0.096 |
| 51540 | SCLY | HTA11_4255_2000001011 | Human | Colorectum | SER | 3.34e-04 | 2.80e-01 | 0.0446 |
| 51540 | SCLY | HTA11_8622_2000001021 | Human | Colorectum | SER | 3.19e-02 | 2.05e-01 | 0.0528 |
| 51540 | SCLY | HTA11_7663_2000001011 | Human | Colorectum | SER | 6.29e-03 | 2.31e-01 | 0.0131 |
| 51540 | SCLY | HTA11_10711_2000001011 | Human | Colorectum | AD | 4.64e-04 | 2.12e-01 | 0.0338 |
| 51540 | SCLY | HTA11_7696_3000711011 | Human | Colorectum | AD | 4.40e-09 | 2.09e-01 | 0.0674 |
| 51540 | SCLY | HTA11_6818_2000001021 | Human | Colorectum | AD | 6.92e-06 | 2.18e-01 | 0.0588 |
| 51540 | SCLY | HTA11_99999970781_79442 | Human | Colorectum | MSS | 4.08e-11 | 2.62e-01 | 0.294 |
| 51540 | SCLY | HTA11_99999965062_69753 | Human | Colorectum | MSI-H | 7.89e-03 | 3.79e-01 | 0.3487 |
| 51540 | SCLY | HTA11_99999965104_69814 | Human | Colorectum | MSS | 1.74e-18 | 5.02e-01 | 0.281 |
| 51540 | SCLY | HTA11_99999971662_82457 | Human | Colorectum | MSS | 9.10e-25 | 4.82e-01 | 0.3859 |
| 51540 | SCLY | HTA11_99999973899_84307 | Human | Colorectum | MSS | 2.92e-03 | 3.09e-01 | 0.2585 |
| 51540 | SCLY | HTA11_99999974143_84620 | Human | Colorectum | MSS | 1.73e-12 | 2.89e-01 | 0.3005 |
| Page: 1 2 3 |
| Tissue | Expression Dynamics | Abbreviation |
| Colorectum (GSE201348) |  | FAP: Familial adenomatous polyposis |
| CRC: Colorectal cancer | ||
| Colorectum (HTA11) |  | AD: Adenomas |
| SER: Sessile serrated lesions | ||
| MSI-H: Microsatellite-high colorectal cancer | ||
| MSS: Microsatellite stable colorectal cancer | ||
| Esophagus | 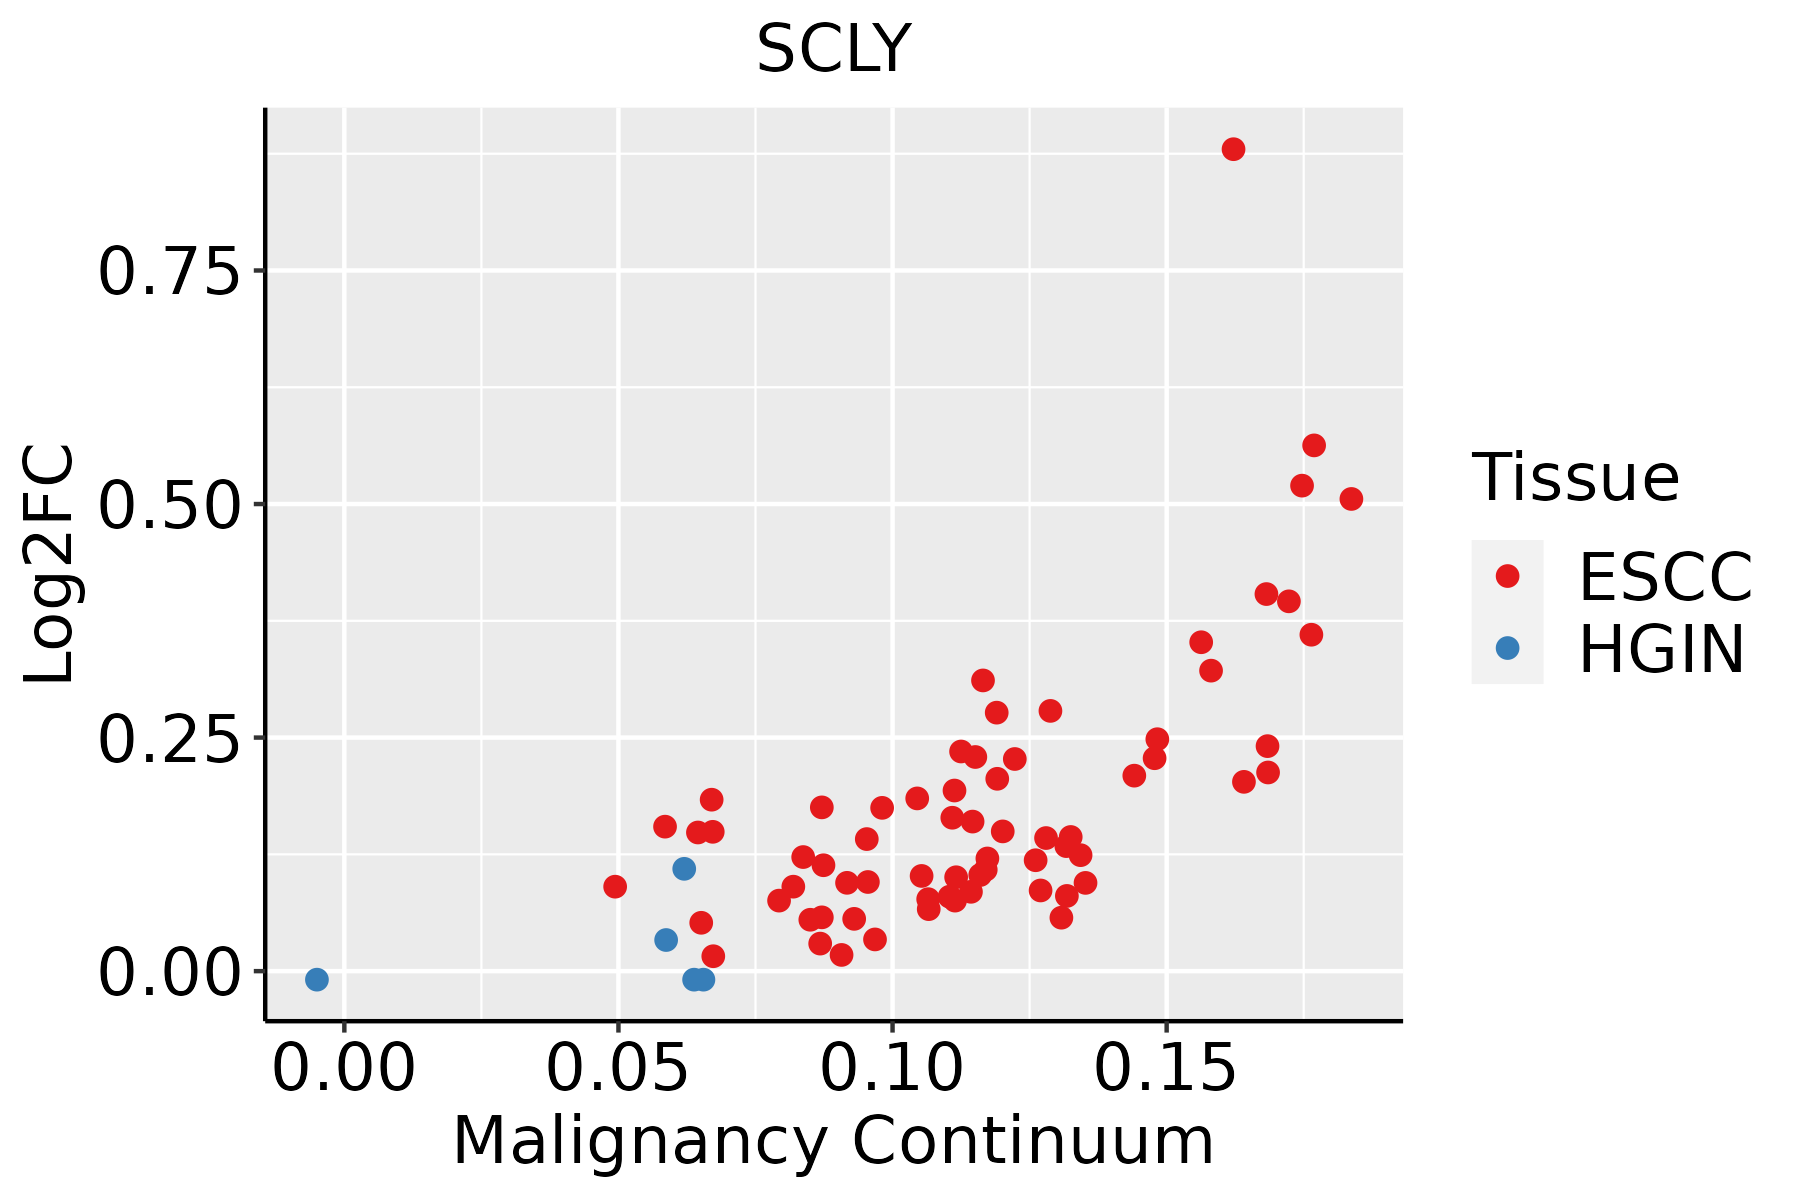 | ESCC: Esophageal squamous cell carcinoma |
| HGIN: High-grade intraepithelial neoplasias | ||
| LGIN: Low-grade intraepithelial neoplasias |
| ∗log2FC in expression of this searched gene in stem-like cells from each diseased tissue sample relative to stem-like cells in normal samples in each tissue plotted against the malignancy continuum. Samples are colored based on if they are from different disease stage. |
Top |
Malignant transformation related pathway analysis |
| Find out the enriched GO biological processes and KEGG pathways involved in transition from healthy to precancer to cancer |
| Tissue | Disease Stage | Enriched GO biological Processes |
| Colorectum | AD |  |
| Colorectum | SER |  |
| Colorectum | MSS |  |
| Colorectum | MSI-H |  |
| Colorectum | FAP |  |
| ∗Top 15 enriched GO BP terms are showed in the bar plot of each disease state in each tissue. Each row represents a significant GO biological process which is colored according to the -log10(p.adjust). |
| Page: 1 2 3 4 5 6 7 8 9 |
| GO ID | Tissue | Disease Stage | Description | Gene Ratio | Bg Ratio | pvalue | p.adjust | Count |
| GO:0044282 | Colorectum | AD | small molecule catabolic process | 118/3918 | 376/18723 | 1.05e-06 | 3.55e-05 | 118 |
| GO:0016054 | Colorectum | AD | organic acid catabolic process | 73/3918 | 240/18723 | 3.20e-04 | 3.81e-03 | 73 |
| GO:0006520 | Colorectum | AD | cellular amino acid metabolic process | 81/3918 | 284/18723 | 1.37e-03 | 1.19e-02 | 81 |
| GO:00442821 | Colorectum | SER | small molecule catabolic process | 87/2897 | 376/18723 | 5.31e-05 | 1.27e-03 | 87 |
| GO:00160541 | Colorectum | SER | organic acid catabolic process | 53/2897 | 240/18723 | 4.04e-03 | 3.30e-02 | 53 |
| GO:00065201 | Colorectum | SER | cellular amino acid metabolic process | 61/2897 | 284/18723 | 4.20e-03 | 3.41e-02 | 61 |
| GO:00442822 | Colorectum | MSS | small molecule catabolic process | 94/3467 | 376/18723 | 9.85e-04 | 9.86e-03 | 94 |
| GO:00160542 | Colorectum | MSS | organic acid catabolic process | 61/3467 | 240/18723 | 4.72e-03 | 3.31e-02 | 61 |
| GO:1901605 | Colorectum | MSI-H | alpha-amino acid metabolic process | 26/1319 | 195/18723 | 1.26e-03 | 2.02e-02 | 26 |
| GO:00442827 | Esophagus | ESCC | small molecule catabolic process | 201/8552 | 376/18723 | 1.35e-03 | 6.41e-03 | 201 |
| Page: 1 |
| Pathway ID | Tissue | Disease Stage | Description | Gene Ratio | Bg Ratio | pvalue | p.adjust | qvalue | Count |
| Page: 1 |
Top |
Cell-cell communication analysis |
| Identification of potential cell-cell interactions between two cell types and their ligand-receptor pairs for different disease states |
| Ligand | Receptor | LRpair | Pathway | Tissue | Disease Stage |
| Page: 1 |
Top |
Single-cell gene regulatory network inference analysis |
| Find out the significant the regulons (TFs) and the target genes of each regulon across cell types for different disease states |
| TF | Cell Type | Tissue | Disease Stage | Target Gene | RSS | Regulon Activity |
| ∗The dot plots of a searched regulon are shown for all cell subpopulations in each disease state of each tissue based on the regulon specific score inferred using pySCENIC and by calculating the average expression. |
| Page: 1 |
Top |
Somatic mutation of malignant transformation related genes |
| Annotation of somatic variants for genes involved in malignant transformation |
| Hugo Symbol | Variant Class | Variant Classification | dbSNP RS | HGVSc | HGVSp | HGVSp Short | SWISSPROT | BIOTYPE | SIFT | PolyPhen | Tumor Sample Barcode | Tissue | Histology | Sex | Age | Stage | Therapy Types | Drugs | Outcome |
| SCLY | SNV | Missense_Mutation | c.919N>G | p.Thr307Ala | p.T307A | protein_coding | deleterious(0.01) | benign(0.034) | TCGA-D8-A1XQ-01 | Breast | breast invasive carcinoma | Female | >=65 | I/II | Unknown | Unknown | SD | ||
| SCLY | insertion | Nonsense_Mutation | novel | c.673_674insTCTTTTAAGGAAGCTAAGGGAAGAAAGAGCAAGTATATGTTT | p.Asn225delinsIlePheTerGlySerTerGlyLysLysGluGlnValTyrValTyr | p.N225delinsIF*GS*GKKEQVYVY | protein_coding | TCGA-BH-A0AY-01 | Breast | breast invasive carcinoma | Female | <65 | I/II | Chemotherapy | SD | ||||
| SCLY | SNV | Missense_Mutation | rs146021037 | c.1201N>A | p.Gly401Arg | p.G401R | protein_coding | deleterious(0.04) | probably_damaging(0.929) | TCGA-EA-A3HS-01 | Cervix | cervical & endocervical cancer | Female | <65 | I/II | Unknown | Unknown | SD | |
| SCLY | SNV | Missense_Mutation | rs150718596 | c.1157N>A | p.Arg386Gln | p.R386Q | protein_coding | tolerated(0.19) | benign(0.015) | TCGA-IR-A3LI-01 | Cervix | cervical & endocervical cancer | Female | <65 | I/II | Chemotherapy | cisplatin | CR | |
| SCLY | SNV | Missense_Mutation | c.311N>T | p.Thr104Ile | p.T104I | protein_coding | deleterious(0) | probably_damaging(0.997) | TCGA-A6-3809-01 | Colorectum | colon adenocarcinoma | Female | >=65 | I/II | Unknown | Unknown | SD | ||
| SCLY | SNV | Missense_Mutation | novel | c.353N>C | p.Val118Ala | p.V118A | protein_coding | tolerated(1) | benign(0.04) | TCGA-AA-3939-01 | Colorectum | colon adenocarcinoma | Male | >=65 | I/II | Unknown | Unknown | SD | |
| SCLY | SNV | Missense_Mutation | rs752963333 | c.748C>T | p.Arg250Cys | p.R250C | protein_coding | deleterious(0.01) | probably_damaging(0.966) | TCGA-CK-5916-01 | Colorectum | colon adenocarcinoma | Female | >=65 | I/II | Unknown | Unknown | PD | |
| SCLY | SNV | Missense_Mutation | c.355N>T | p.Val119Leu | p.V119L | protein_coding | tolerated(0.5) | benign(0.039) | TCGA-DM-A28F-01 | Colorectum | colon adenocarcinoma | Male | >=65 | III/IV | Unknown | Unknown | SD | ||
| SCLY | SNV | Missense_Mutation | rs762082693 | c.1124N>A | p.Arg375Gln | p.R375Q | protein_coding | tolerated(0.85) | benign(0.001) | TCGA-NH-A5IV-01 | Colorectum | colon adenocarcinoma | Female | >=65 | I/II | Unknown | Unknown | SD | |
| SCLY | SNV | Missense_Mutation | novel | c.568N>A | p.Ala190Thr | p.A190T | protein_coding | tolerated(0.07) | benign(0.192) | TCGA-A5-A0G2-01 | Endometrium | uterine corpus endometrioid carcinoma | Female | <65 | III/IV | Unknown | Unknown | SD |
| Page: 1 2 3 4 |
Top |
Related drugs of malignant transformation related genes |
| Identification of chemicals and drugs interact with genes involved in malignant transfromation |
| (DGIdb 4.0) |
| Entrez ID | Symbol | Category | Interaction Types | Drug Claim Name | Drug Name | PMIDs |
| Page: 1 |

Copyright 2023-Present -The University of Texas Health Science Center at Houston |