
|
|||||
|
 | |
| |
| |
| |
| |
| |
|
Gene: SCGB3A2 |
Gene summary for SCGB3A2 |
| Gene information | Species | Human | Gene symbol | SCGB3A2 | Gene ID | 117156 |
| Gene name | secretoglobin family 3A member 2 | |
| Gene Alias | LU103 | |
| Cytomap | 5q32 | |
| Gene Type | protein-coding | GO ID | GO:0005575 | UniProtAcc | Q2L6B3 |
Top |
Malignant transformation analysis |
| Identification of the aberrant gene expression in precancerous and cancerous lesions by comparing the gene expression of stem-like cells in diseased tissues with normal stem cells |
| Entrez ID | Symbol | Replicates | Species | Organ | Tissue | Adj P-value | Log2FC | Malignancy |
| 117156 | SCGB3A2 | TD9 | Human | Lung | IAC | 8.00e-03 | 1.10e+00 | 0.088 |
| 117156 | SCGB3A2 | RNA-P10T2-P10T2-2 | Human | Lung | AAH | 5.44e-05 | 1.15e+00 | -0.1406 |
| 117156 | SCGB3A2 | RNA-P10T2-P10T2-3 | Human | Lung | AAH | 4.65e-04 | 1.09e+00 | -0.1408 |
| 117156 | SCGB3A2 | RNA-P10T2-P10T2-4 | Human | Lung | AAH | 1.32e-02 | 1.12e+00 | -0.138 |
| 117156 | SCGB3A2 | RNA-P18T-P18T-2 | Human | Lung | IAC | 3.97e-08 | 1.97e+00 | 0.1129 |
| 117156 | SCGB3A2 | RNA-P18T-P18T-4 | Human | Lung | IAC | 2.98e-08 | 1.99e+00 | 0.1024 |
| 117156 | SCGB3A2 | RNA-P18T-P18T-6 | Human | Lung | IAC | 2.20e-10 | 2.06e+00 | 0.0856 |
| 117156 | SCGB3A2 | RNA-P18T-P18T-8 | Human | Lung | IAC | 1.20e-07 | 2.02e+00 | 0.1151 |
| 117156 | SCGB3A2 | RNA-P23T2-P23T2-2 | Human | Lung | MIAC | 2.62e-04 | 1.35e+00 | -0.028 |
| 117156 | SCGB3A2 | RNA-P25T1-P25T1-1 | Human | Lung | AIS | 2.08e-02 | 2.32e-01 | -0.2116 |
| 117156 | SCGB3A2 | RNA-P25T1-P25T1-4 | Human | Lung | AIS | 3.18e-04 | 2.06e-01 | -0.2119 |
| 117156 | SCGB3A2 | RNA-P3T-P3T-2 | Human | Lung | IAC | 5.45e-03 | 6.73e-01 | 0.1835 |
| 117156 | SCGB3A2 | RNA-P6T1-P6T1-1 | Human | Lung | MIAC | 4.79e-05 | 1.20e+00 | -0.0238 |
| 117156 | SCGB3A2 | RNA-P6T1-P6T1-4 | Human | Lung | MIAC | 1.37e-04 | 1.03e+00 | -0.0263 |
| 117156 | SCGB3A2 | RNA-P6T2-P6T2-1 | Human | Lung | IAC | 1.50e-61 | 1.47e+00 | -0.0166 |
| 117156 | SCGB3A2 | RNA-P6T2-P6T2-2 | Human | Lung | IAC | 2.53e-65 | 1.47e+00 | -0.0132 |
| 117156 | SCGB3A2 | RNA-P6T2-P6T2-3 | Human | Lung | IAC | 1.06e-68 | 1.50e+00 | -0.013 |
| 117156 | SCGB3A2 | RNA-P6T2-P6T2-4 | Human | Lung | IAC | 6.95e-53 | 1.37e+00 | -0.0121 |
| 117156 | SCGB3A2 | RNA-P7T1-P7T1-1 | Human | Lung | AIS | 1.12e-02 | 1.14e+00 | -0.0961 |
| 117156 | SCGB3A2 | RNA-P7T1-P7T1-2 | Human | Lung | AIS | 1.60e-04 | 1.08e+00 | -0.0876 |
| Page: 1 2 |
| Tissue | Expression Dynamics | Abbreviation |
| Lung | 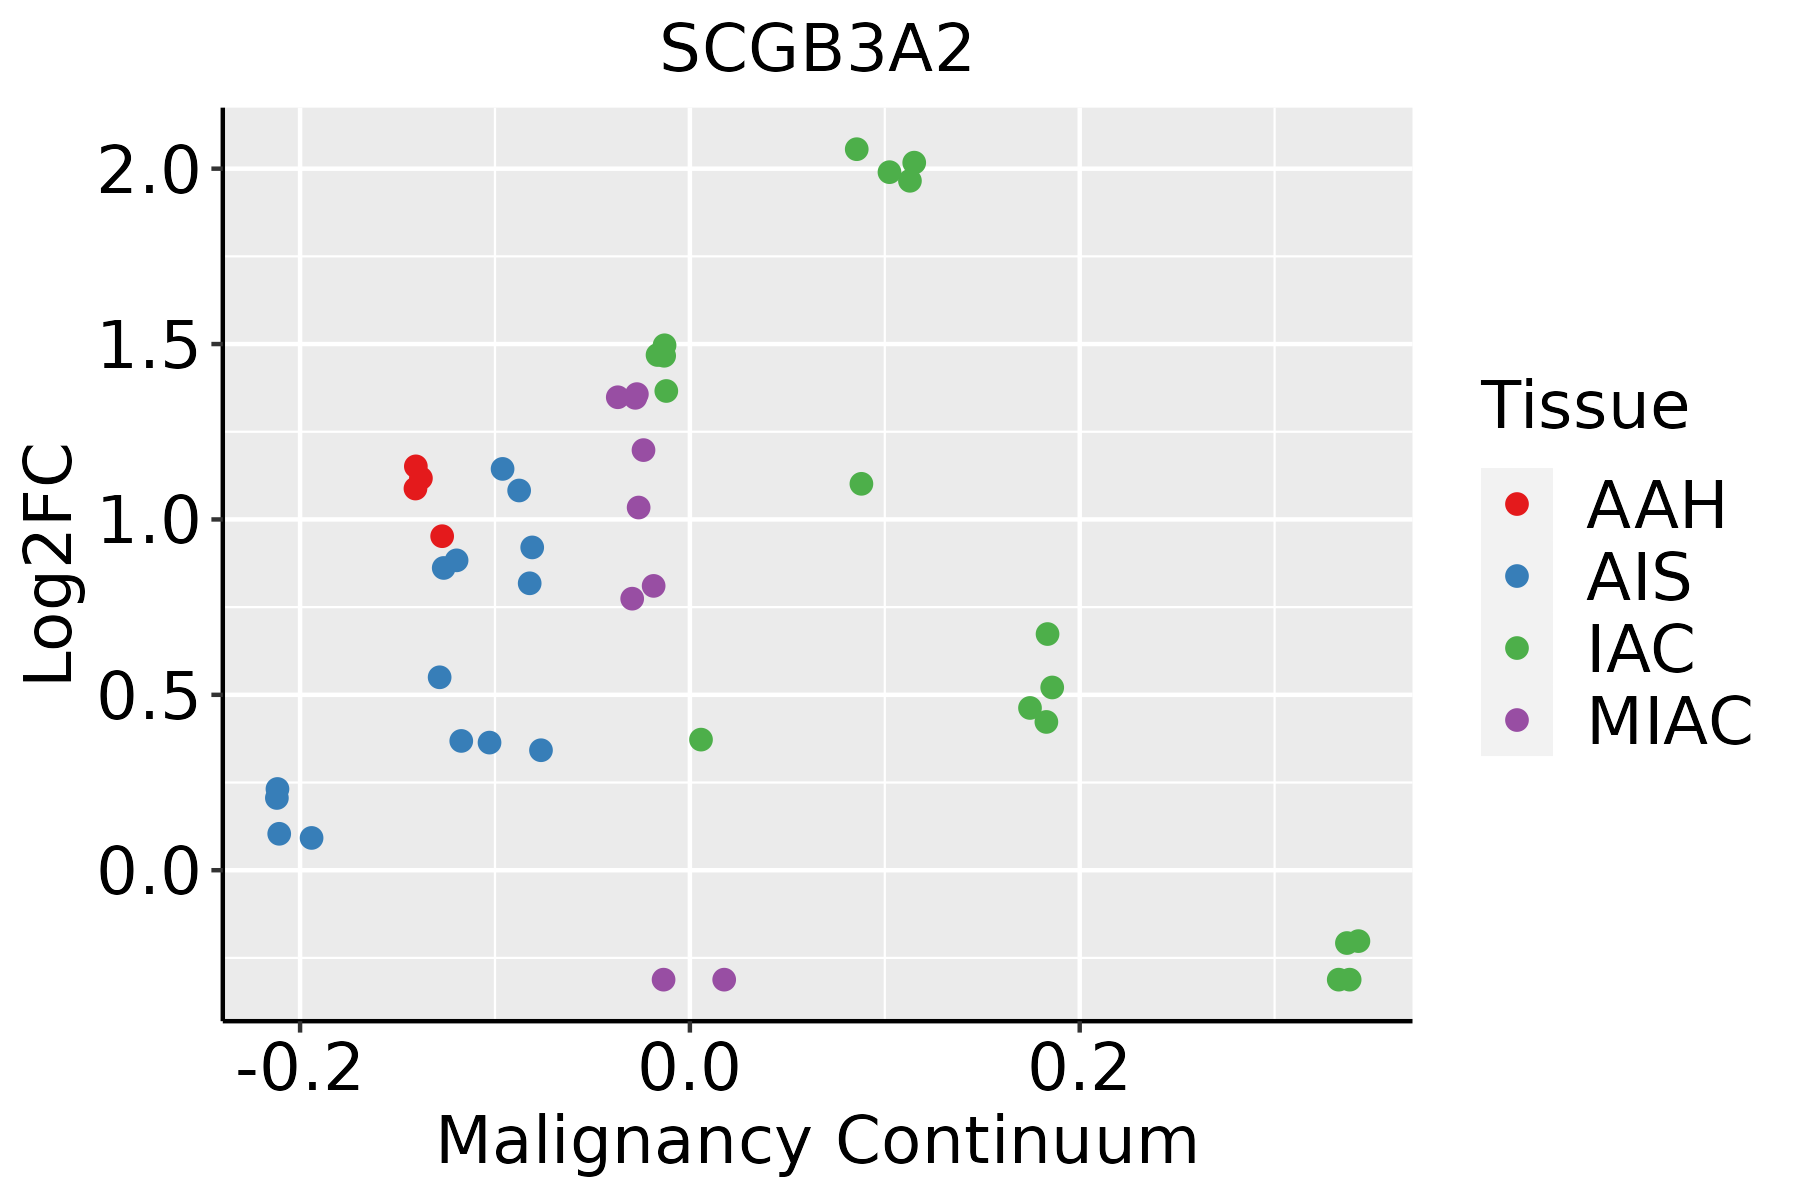 | AAH: Atypical adenomatous hyperplasia |
| AIS: Adenocarcinoma in situ | ||
| IAC: Invasive lung adenocarcinoma | ||
| MIA: Minimally invasive adenocarcinoma |
| ∗log2FC in expression of this searched gene in stem-like cells from each diseased tissue sample relative to stem-like cells in normal samples in each tissue plotted against the malignancy continuum. Samples are colored based on if they are from different disease stage. |
Top |
Malignant transformation related pathway analysis |
| Find out the enriched GO biological processes and KEGG pathways involved in transition from healthy to precancer to cancer |
| Tissue | Disease Stage | Enriched GO biological Processes |
| Colorectum | AD |  |
| Colorectum | SER |  |
| Colorectum | MSS |  |
| Colorectum | MSI-H |  |
| Colorectum | FAP |  |
| ∗Top 15 enriched GO BP terms are showed in the bar plot of each disease state in each tissue. Each row represents a significant GO biological process which is colored according to the -log10(p.adjust). |
| Page: 1 2 3 4 5 6 7 8 9 |
| GO ID | Tissue | Disease Stage | Description | Gene Ratio | Bg Ratio | pvalue | p.adjust | Count |
| Page: 1 |
| Pathway ID | Tissue | Disease Stage | Description | Gene Ratio | Bg Ratio | pvalue | p.adjust | qvalue | Count |
| Page: 1 |
Top |
Cell-cell communication analysis |
| Identification of potential cell-cell interactions between two cell types and their ligand-receptor pairs for different disease states |
| Ligand | Receptor | LRpair | Pathway | Tissue | Disease Stage |
| SCGB3A2 | MARCO | SCGB3A2_MARCO | UGRP1 | Lung | AAH |
| SCGB3A2 | MARCO | SCGB3A2_MARCO | UGRP1 | Lung | AIS |
| SCGB3A2 | MARCO | SCGB3A2_MARCO | UGRP1 | Lung | Healthy |
| SCGB3A2 | MARCO | SCGB3A2_MARCO | UGRP1 | Lung | MIAC |
| SCGB3A2 | MARCO | SCGB3A2_MARCO | UGRP1 | Lung | Precancer |
| Page: 1 |
Top |
Single-cell gene regulatory network inference analysis |
| Find out the significant the regulons (TFs) and the target genes of each regulon across cell types for different disease states |
| TF | Cell Type | Tissue | Disease Stage | Target Gene | RSS | Regulon Activity |
| ∗The dot plots of a searched regulon are shown for all cell subpopulations in each disease state of each tissue based on the regulon specific score inferred using pySCENIC and by calculating the average expression. |
| Page: 1 |
Top |
Somatic mutation of malignant transformation related genes |
| Annotation of somatic variants for genes involved in malignant transformation |
| Hugo Symbol | Variant Class | Variant Classification | dbSNP RS | HGVSc | HGVSp | HGVSp Short | SWISSPROT | BIOTYPE | SIFT | PolyPhen | Tumor Sample Barcode | Tissue | Histology | Sex | Age | Stage | Therapy Types | Drugs | Outcome |
| SCGB3A2 | SNV | Missense_Mutation | novel | c.134N>G | p.Phe45Cys | p.F45C | Q96PL1 | protein_coding | tolerated(0.11) | possibly_damaging(0.65) | TCGA-AN-A046-01 | Breast | breast invasive carcinoma | Female | >=65 | I/II | Unknown | Unknown | SD |
| SCGB3A2 | insertion | Frame_Shift_Ins | novel | c.188_189insGC | p.Val64LeufsTer5 | p.V64Lfs*5 | Q96PL1 | protein_coding | TCGA-AR-A0U2-01 | Breast | breast invasive carcinoma | Female | <65 | III/IV | Hormone Therapy | tamoxiphen | PD | ||
| SCGB3A2 | SNV | Missense_Mutation | c.100T>G | p.Leu34Val | p.L34V | Q96PL1 | protein_coding | tolerated(1) | benign(0) | TCGA-AA-3713-01 | Colorectum | colon adenocarcinoma | Male | >=65 | III/IV | Chemotherapy | 5-fluorouracil | PR | |
| SCGB3A2 | SNV | Missense_Mutation | c.142N>A | p.Pro48Thr | p.P48T | Q96PL1 | protein_coding | deleterious(0.01) | possibly_damaging(0.874) | TCGA-F5-6813-01 | Colorectum | rectum adenocarcinoma | Male | >=65 | III/IV | Unknown | Unknown | PD | |
| SCGB3A2 | SNV | Missense_Mutation | c.73N>G | p.Asn25Asp | p.N25D | Q96PL1 | protein_coding | tolerated(0.29) | benign(0) | TCGA-A5-A0GP-01 | Endometrium | uterine corpus endometrioid carcinoma | Female | <65 | I/II | Unknown | Unknown | SD | |
| SCGB3A2 | SNV | Missense_Mutation | novel | c.253N>A | p.Leu85Met | p.L85M | Q96PL1 | protein_coding | deleterious(0.02) | probably_damaging(0.999) | TCGA-D1-A16X-01 | Endometrium | uterine corpus endometrioid carcinoma | Female | <65 | I/II | Unknown | Unknown | SD |
| SCGB3A2 | SNV | Missense_Mutation | novel | c.148A>C | p.Lys50Gln | p.K50Q | Q96PL1 | protein_coding | deleterious(0) | possibly_damaging(0.875) | TCGA-EO-A22U-01 | Endometrium | uterine corpus endometrioid carcinoma | Female | >=65 | I/II | Unknown | Unknown | SD |
| SCGB3A2 | SNV | Missense_Mutation | novel | c.75N>A | p.Asn25Lys | p.N25K | Q96PL1 | protein_coding | deleterious(0.04) | benign(0.037) | TCGA-37-A5EM-01 | Lung | lung squamous cell carcinoma | Male | <65 | I/II | Unknown | Unknown | SD |
| SCGB3A2 | SNV | Missense_Mutation | novel | c.139N>A | p.Asp47Asn | p.D47N | Q96PL1 | protein_coding | tolerated(0.98) | benign(0.077) | TCGA-CV-A468-01 | Oral cavity | head & neck squamous cell carcinoma | Male | <65 | I/II | Unknown | Unknown | SD |
| SCGB3A2 | SNV | Missense_Mutation | c.181N>C | p.Glu61Gln | p.E61Q | Q96PL1 | protein_coding | deleterious(0.01) | probably_damaging(0.999) | TCGA-HU-8243-01 | Stomach | stomach adenocarcinoma | Male | >=65 | III/IV | Chemotherapy | 5-fluorouracil | PD |
| Page: 1 |
Top |
Related drugs of malignant transformation related genes |
| Identification of chemicals and drugs interact with genes involved in malignant transfromation |
| (DGIdb 4.0) |
| Entrez ID | Symbol | Category | Interaction Types | Drug Claim Name | Drug Name | PMIDs |
| Page: 1 |

Copyright 2023-Present -The University of Texas Health Science Center at Houston |