
|
|||||
|
 | |
| |
| |
| |
| |
| |
|
Gene: SCGB3A1 |
Gene summary for SCGB3A1 |
| Gene information | Species | Human | Gene symbol | SCGB3A1 | Gene ID | 92304 |
| Gene name | secretoglobin family 3A member 1 | |
| Gene Alias | HIN-1 | |
| Cytomap | 5q35.3 | |
| Gene Type | protein-coding | GO ID | GO:0000768 | UniProtAcc | Q96QR1 |
Top |
Malignant transformation analysis |
| Identification of the aberrant gene expression in precancerous and cancerous lesions by comparing the gene expression of stem-like cells in diseased tissues with normal stem cells |
| Entrez ID | Symbol | Replicates | Species | Organ | Tissue | Adj P-value | Log2FC | Malignancy |
| 92304 | SCGB3A1 | GSM4909281 | Human | Breast | IDC | 3.09e-10 | -6.64e-01 | 0.21 |
| 92304 | SCGB3A1 | GSM4909282 | Human | Breast | IDC | 7.84e-25 | -7.39e-01 | -0.0288 |
| 92304 | SCGB3A1 | GSM4909285 | Human | Breast | IDC | 9.75e-21 | -7.32e-01 | 0.21 |
| 92304 | SCGB3A1 | GSM4909286 | Human | Breast | IDC | 4.99e-02 | -3.43e-02 | 0.1081 |
| 92304 | SCGB3A1 | GSM4909287 | Human | Breast | IDC | 4.19e-10 | -4.67e-01 | 0.2057 |
| 92304 | SCGB3A1 | GSM4909289 | Human | Breast | IDC | 9.71e-05 | -7.39e-01 | 0.1064 |
| 92304 | SCGB3A1 | GSM4909290 | Human | Breast | IDC | 6.75e-15 | -7.24e-01 | 0.2096 |
| 92304 | SCGB3A1 | GSM4909291 | Human | Breast | IDC | 1.98e-15 | -7.39e-01 | 0.1753 |
| 92304 | SCGB3A1 | GSM4909293 | Human | Breast | IDC | 2.39e-04 | -5.62e-01 | 0.1581 |
| 92304 | SCGB3A1 | GSM4909296 | Human | Breast | IDC | 1.06e-05 | -4.16e-01 | 0.1524 |
| 92304 | SCGB3A1 | GSM4909297 | Human | Breast | IDC | 2.25e-23 | -7.15e-01 | 0.1517 |
| 92304 | SCGB3A1 | GSM4909298 | Human | Breast | IDC | 7.84e-25 | -7.32e-01 | 0.1551 |
| 92304 | SCGB3A1 | GSM4909299 | Human | Breast | IDC | 3.93e-04 | -5.58e-01 | 0.035 |
| 92304 | SCGB3A1 | GSM4909301 | Human | Breast | IDC | 5.53e-08 | 3.99e-01 | 0.1577 |
| 92304 | SCGB3A1 | GSM4909304 | Human | Breast | IDC | 3.27e-25 | -7.28e-01 | 0.1636 |
| 92304 | SCGB3A1 | GSM4909305 | Human | Breast | IDC | 1.25e-02 | -5.11e-01 | 0.0436 |
| 92304 | SCGB3A1 | GSM4909306 | Human | Breast | IDC | 1.36e-09 | -6.11e-01 | 0.1564 |
| 92304 | SCGB3A1 | GSM4909307 | Human | Breast | IDC | 1.06e-23 | -7.39e-01 | 0.1569 |
| 92304 | SCGB3A1 | GSM4909308 | Human | Breast | IDC | 5.43e-23 | -7.39e-01 | 0.158 |
| 92304 | SCGB3A1 | GSM4909309 | Human | Breast | IDC | 4.54e-23 | -7.39e-01 | 0.0483 |
| Page: 1 2 3 4 5 6 7 8 |
| Tissue | Expression Dynamics | Abbreviation |
| Breast |  | IDC: Invasive ductal carcinoma |
| DCIS: Ductal carcinoma in situ | ||
| Precancer(BRCA1-mut): Precancerous lesion from BRCA1 mutation carriers | ||
| Cervix | 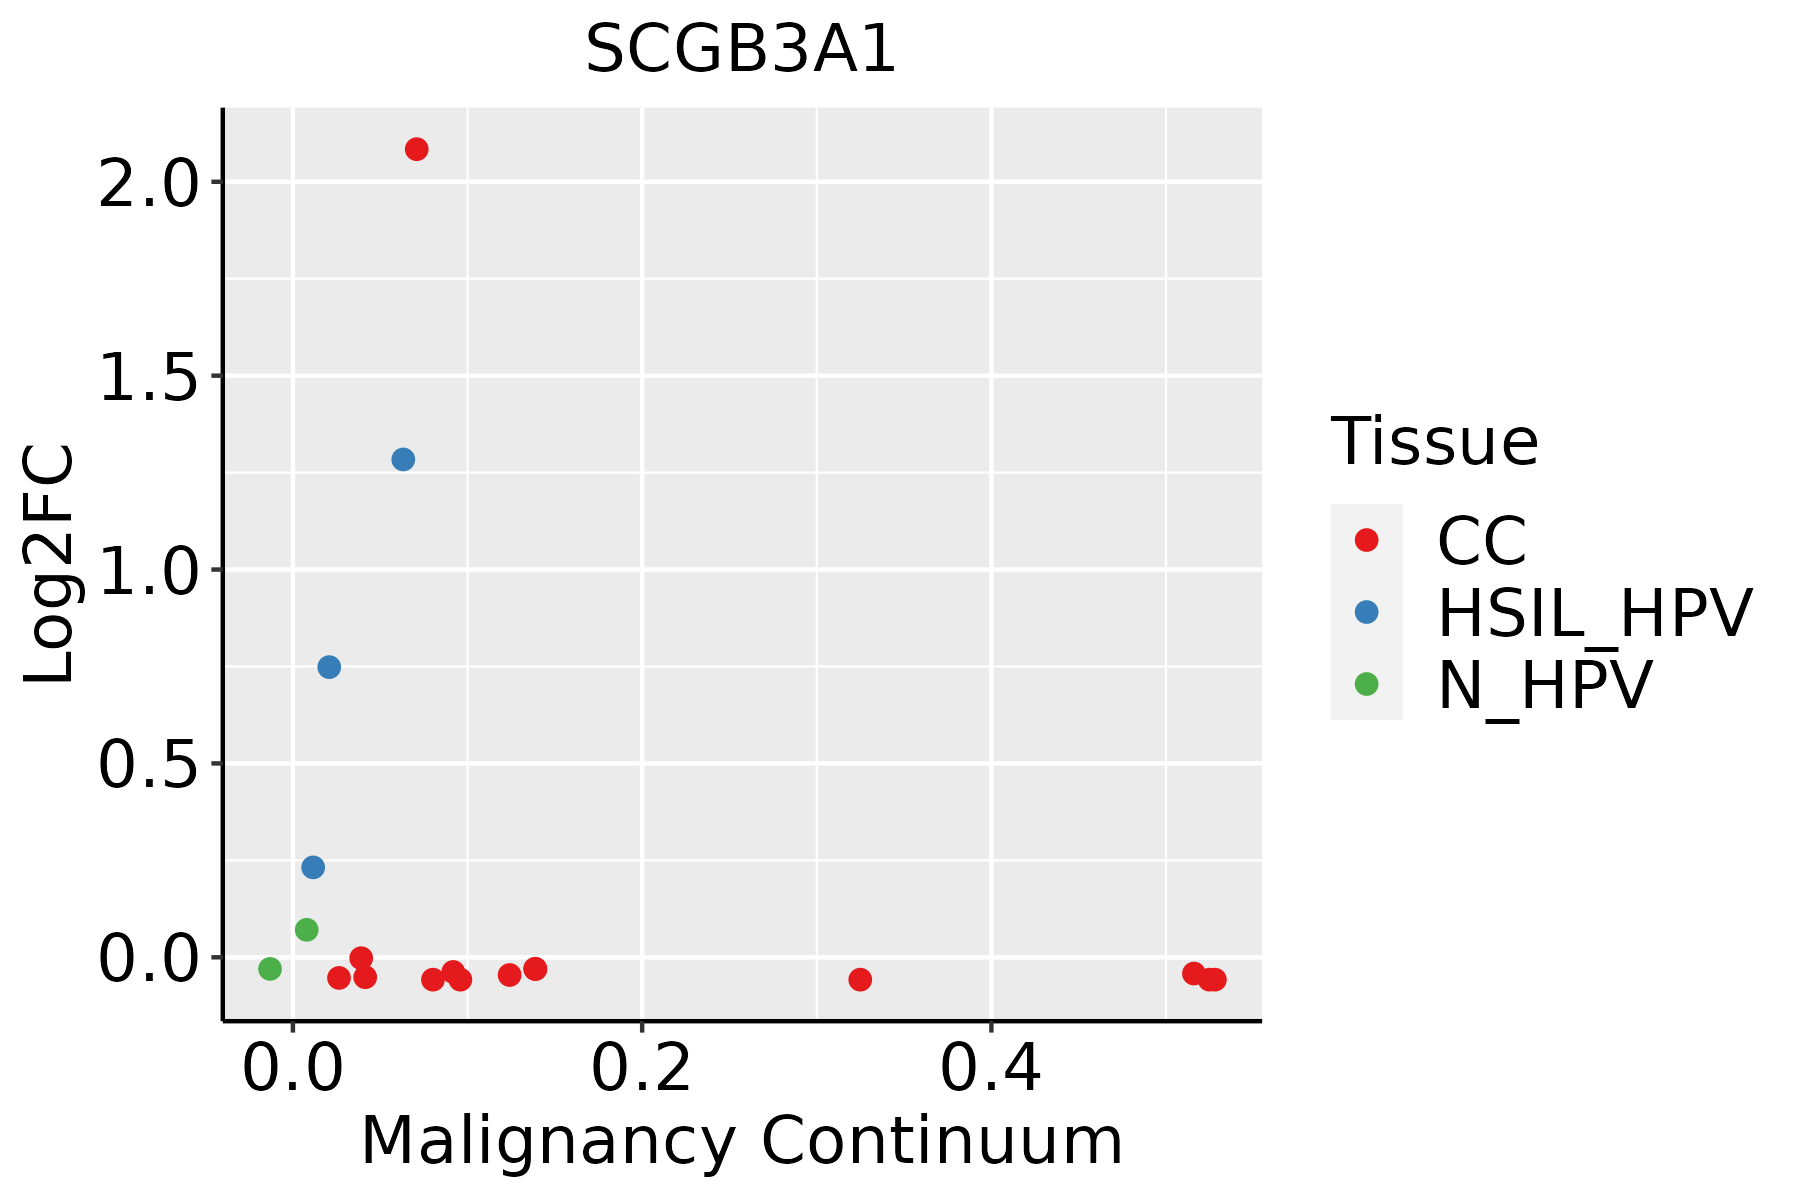 | CC: Cervix cancer |
| HSIL_HPV: HPV-infected high-grade squamous intraepithelial lesions | ||
| N_HPV: HPV-infected normal cervix | ||
| Esophagus | 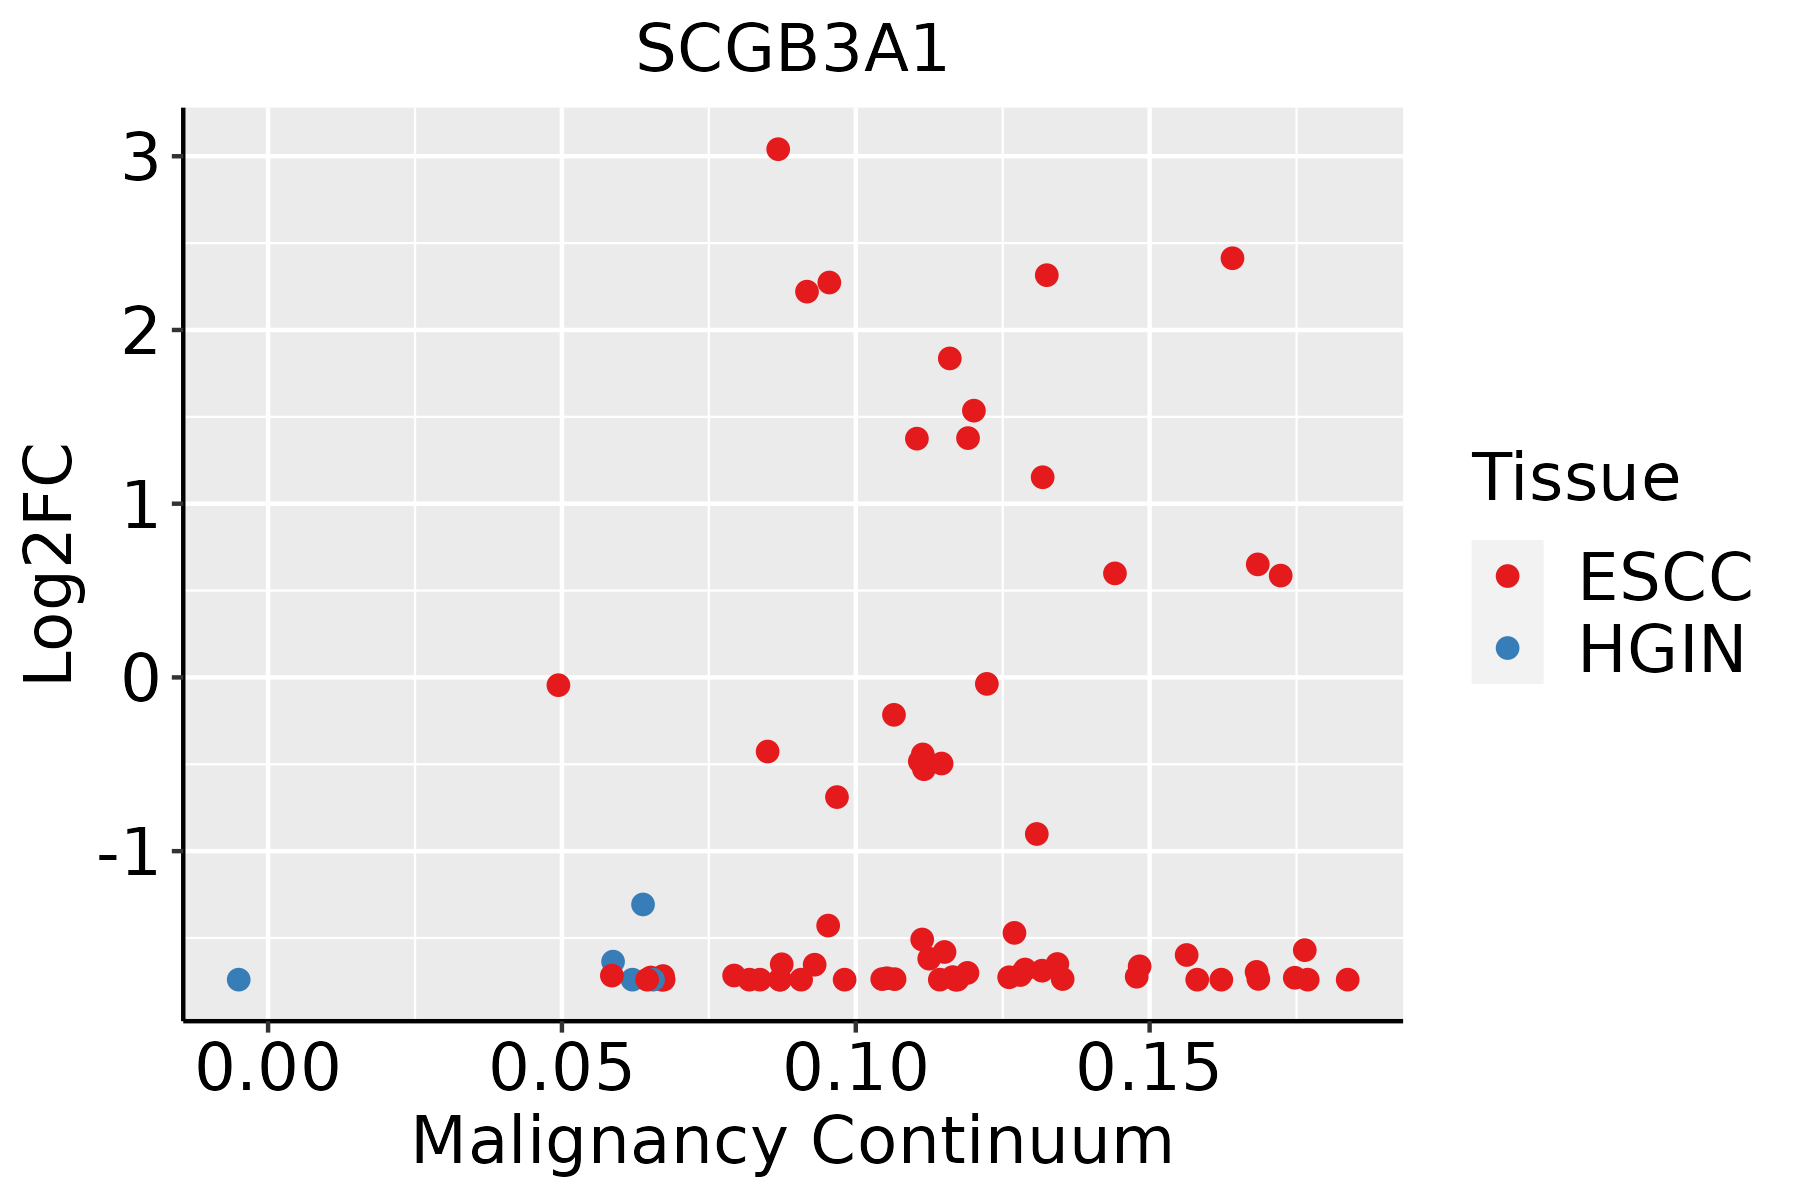 | ESCC: Esophageal squamous cell carcinoma |
| HGIN: High-grade intraepithelial neoplasias | ||
| LGIN: Low-grade intraepithelial neoplasias | ||
| Liver | 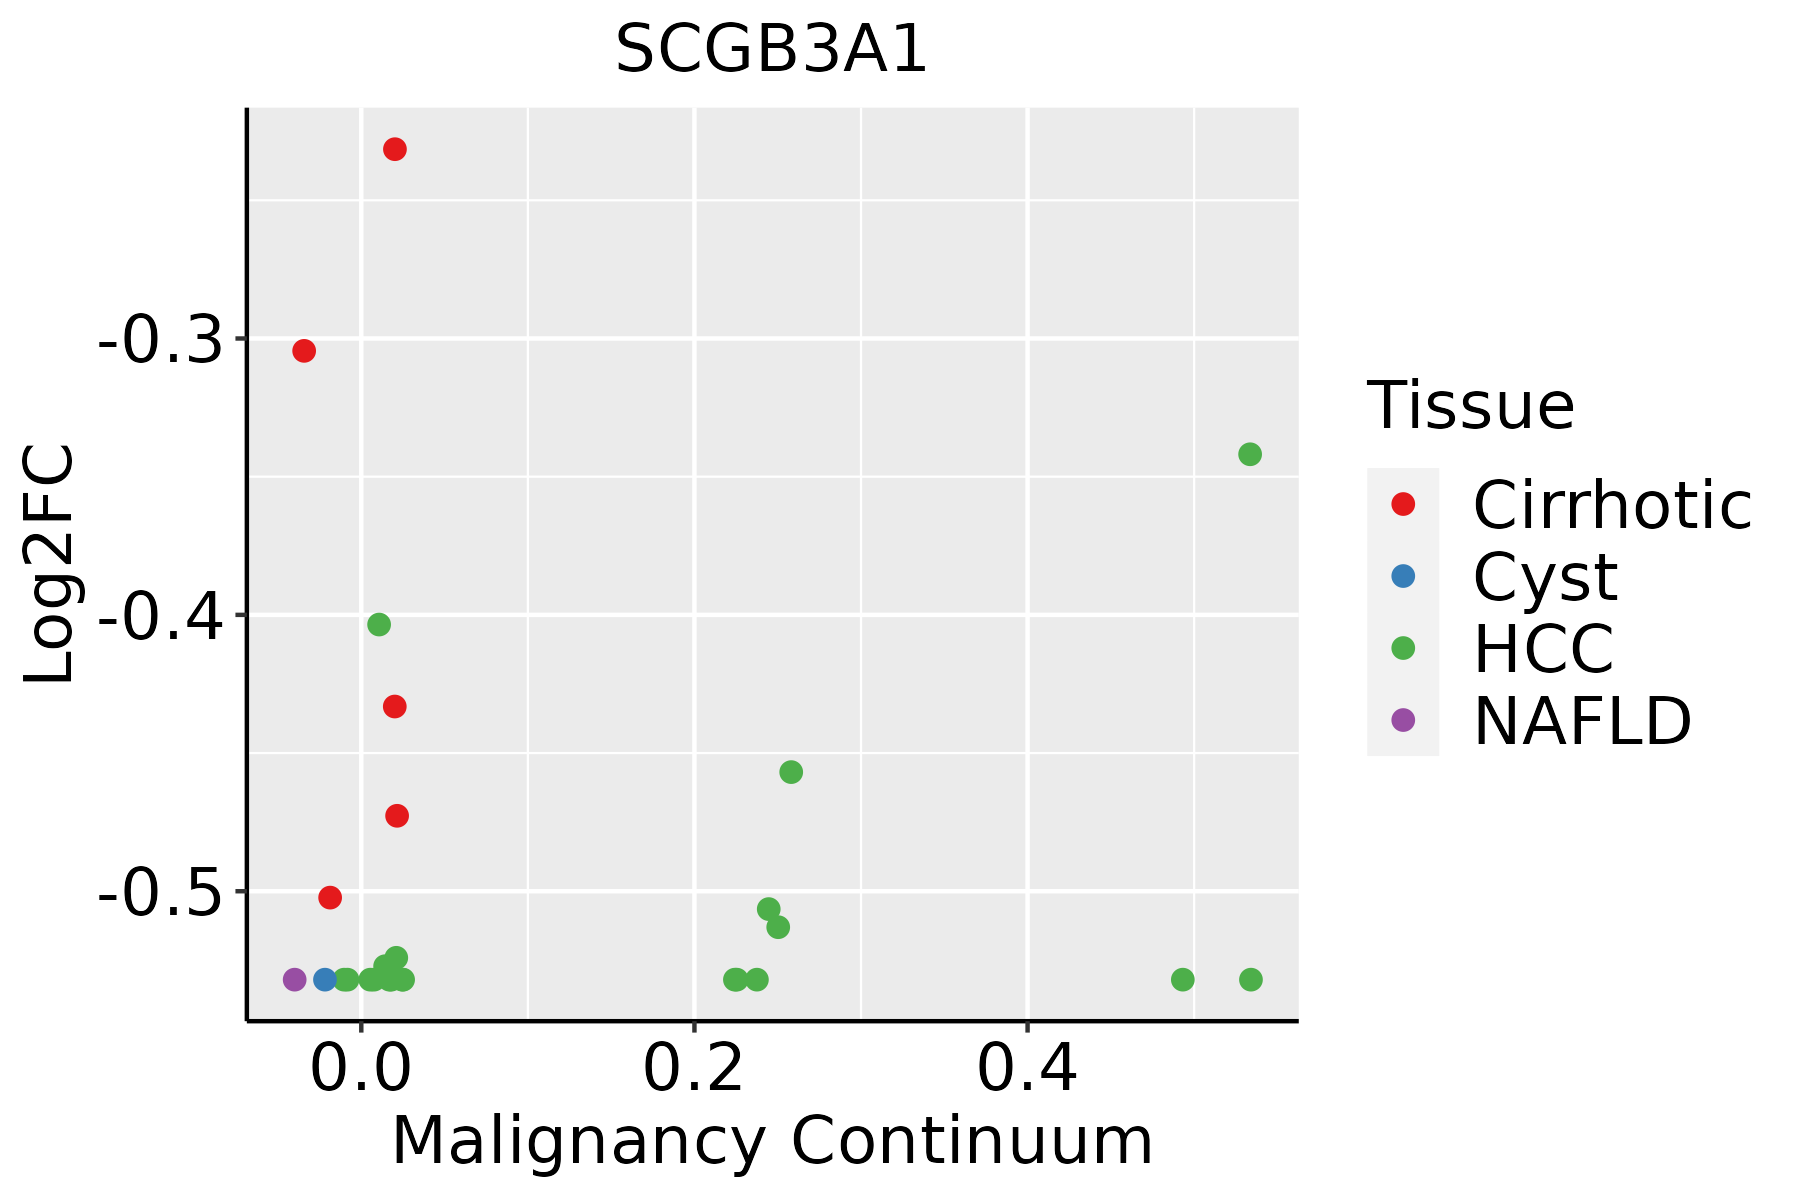 | HCC: Hepatocellular carcinoma |
| NAFLD: Non-alcoholic fatty liver disease | ||
| Lung | 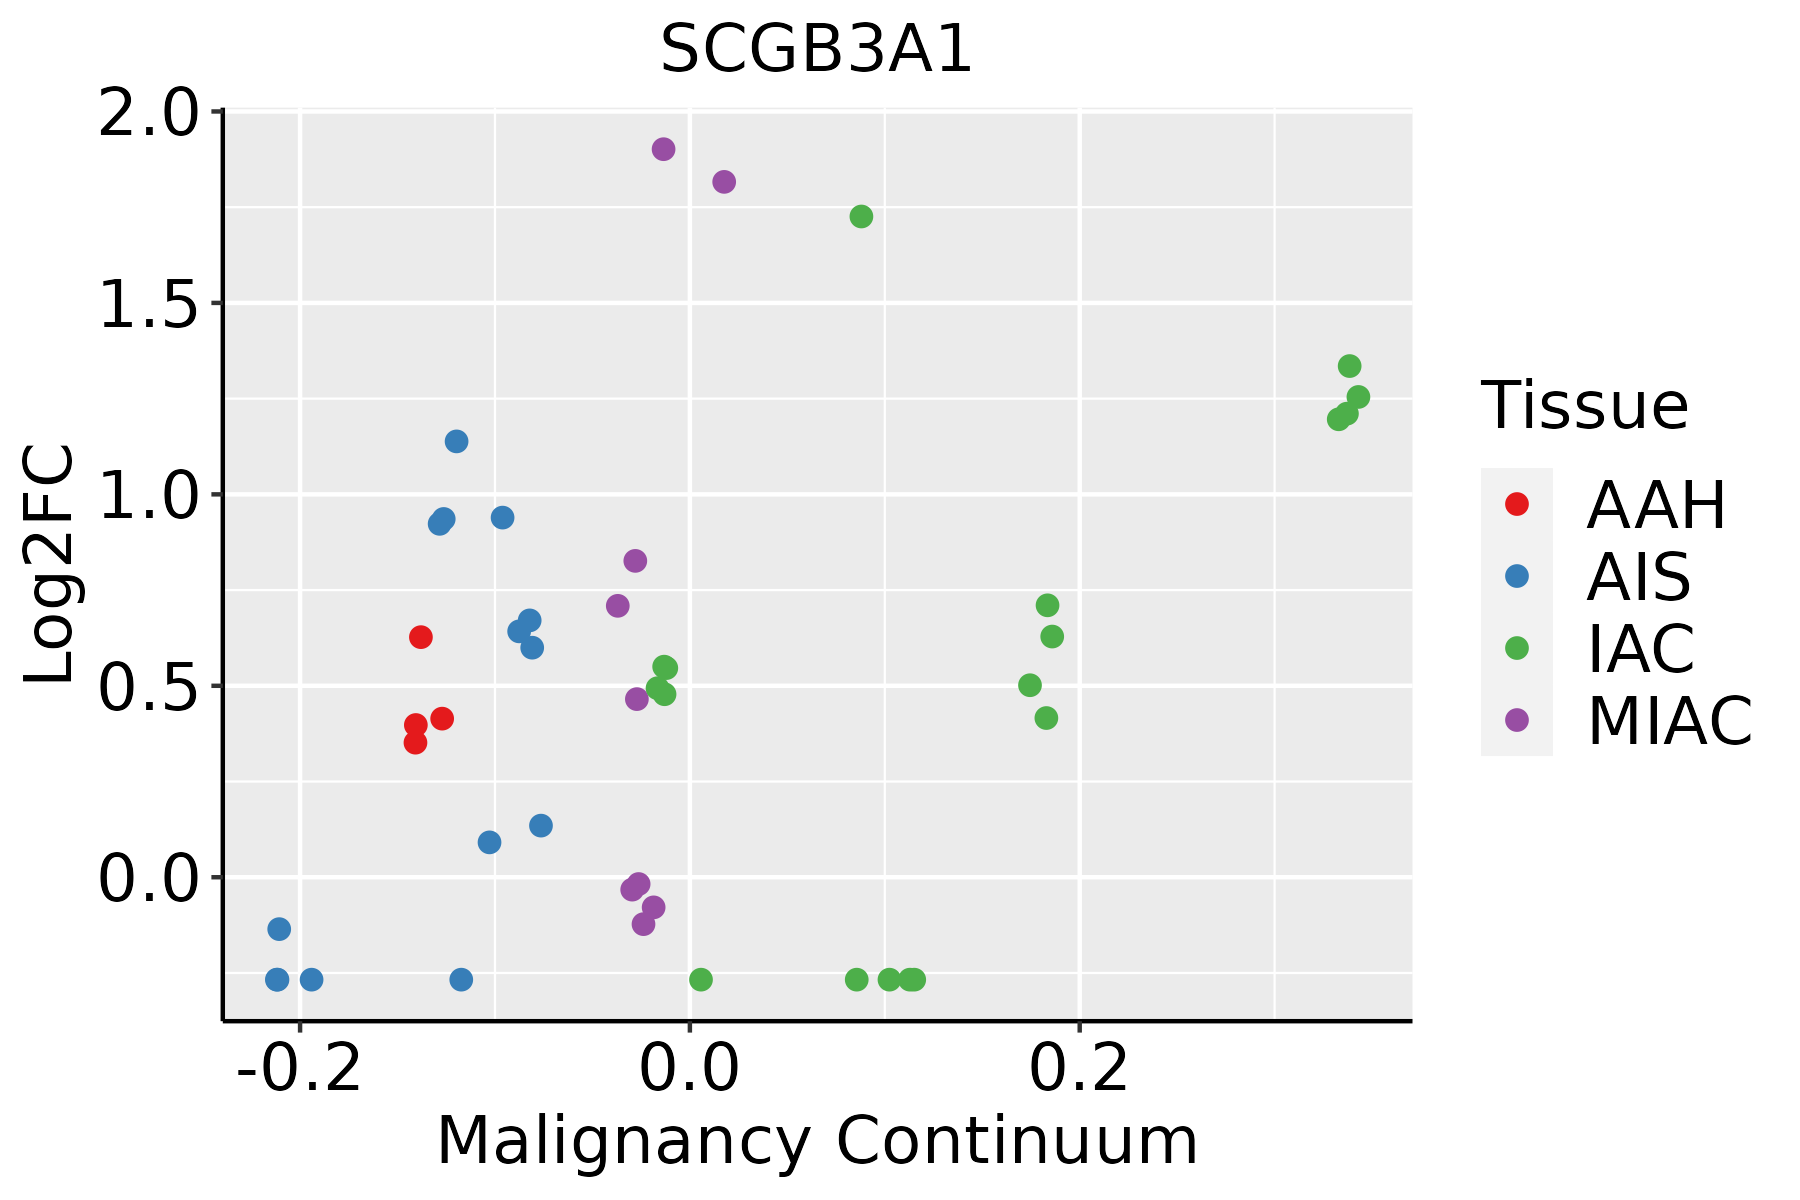 | AAH: Atypical adenomatous hyperplasia |
| AIS: Adenocarcinoma in situ | ||
| IAC: Invasive lung adenocarcinoma | ||
| MIA: Minimally invasive adenocarcinoma | ||
| Oral Cavity | 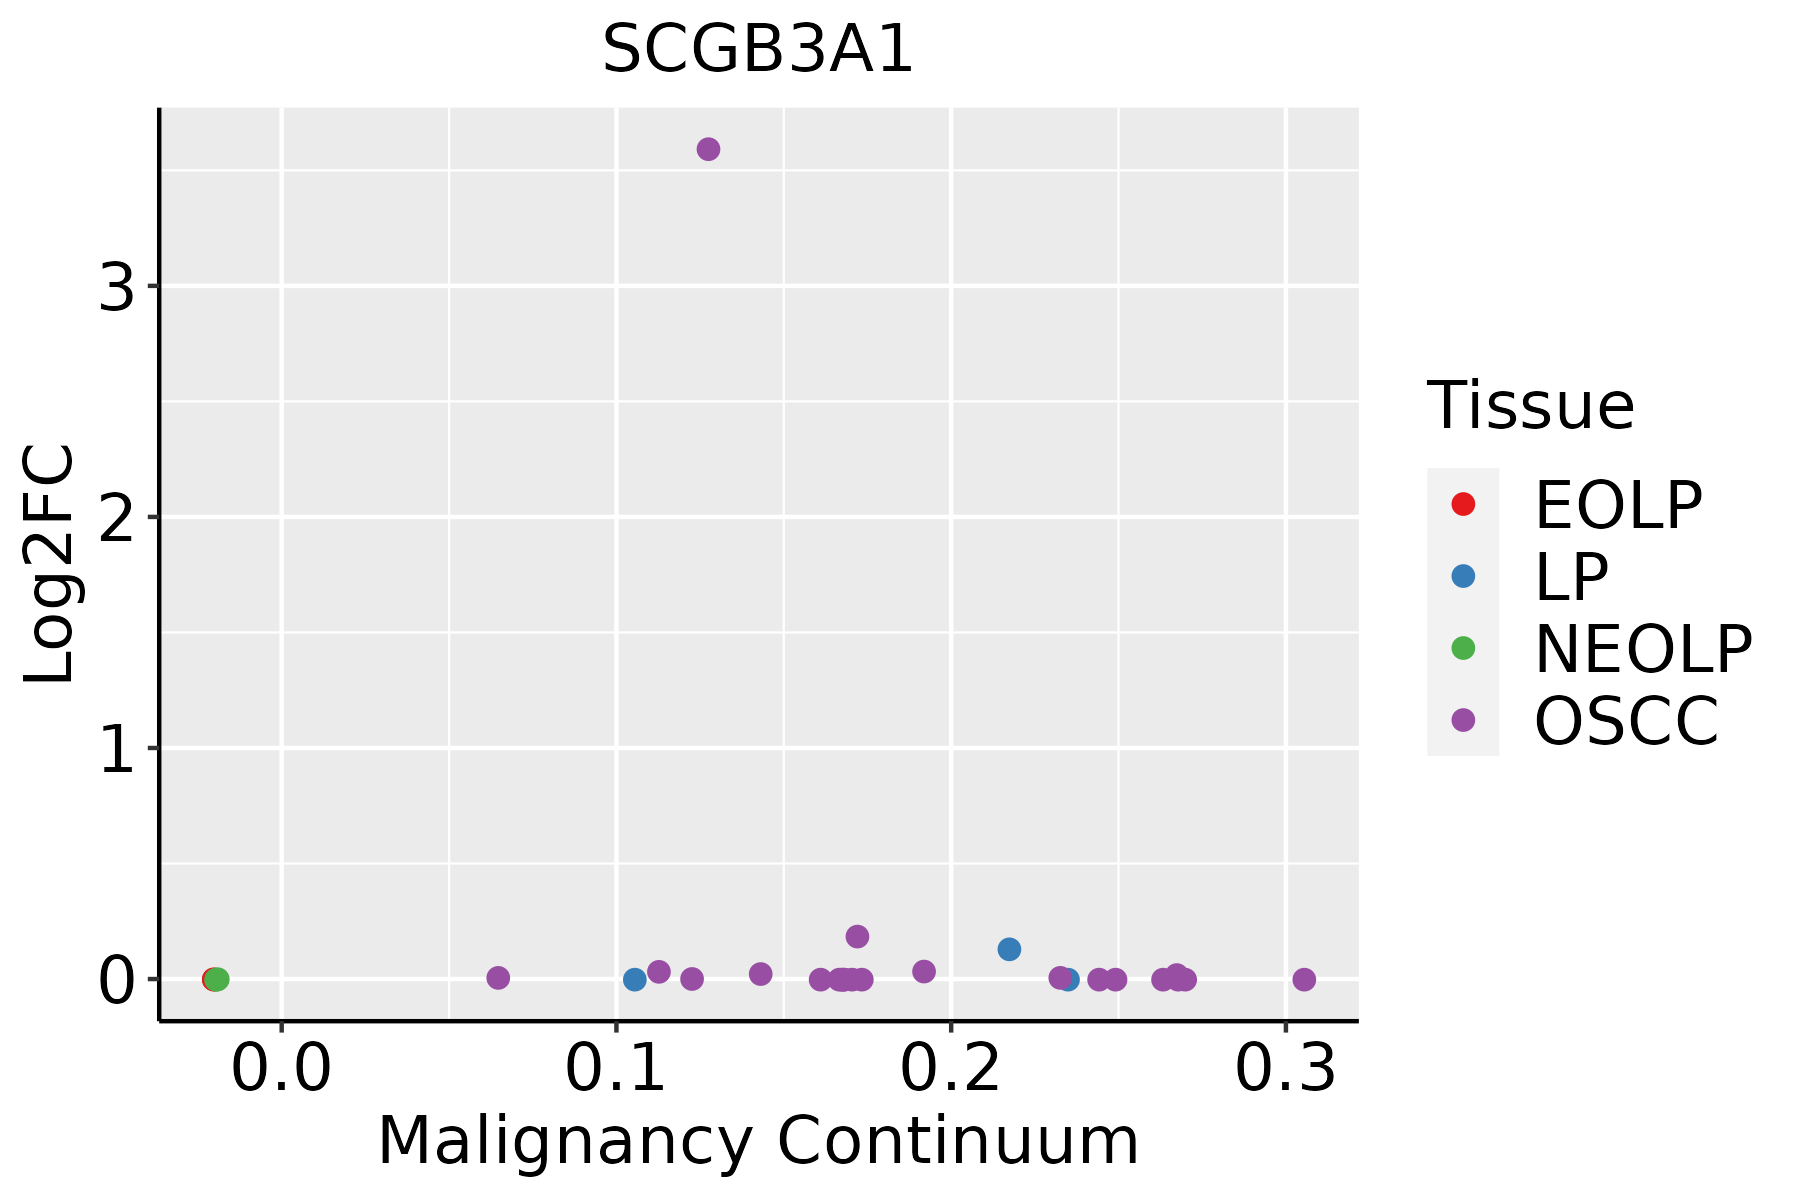 | EOLP: Erosive Oral lichen planus |
| LP: leukoplakia | ||
| NEOLP: Non-erosive oral lichen planus | ||
| OSCC: Oral squamous cell carcinoma | ||
| Prostate | 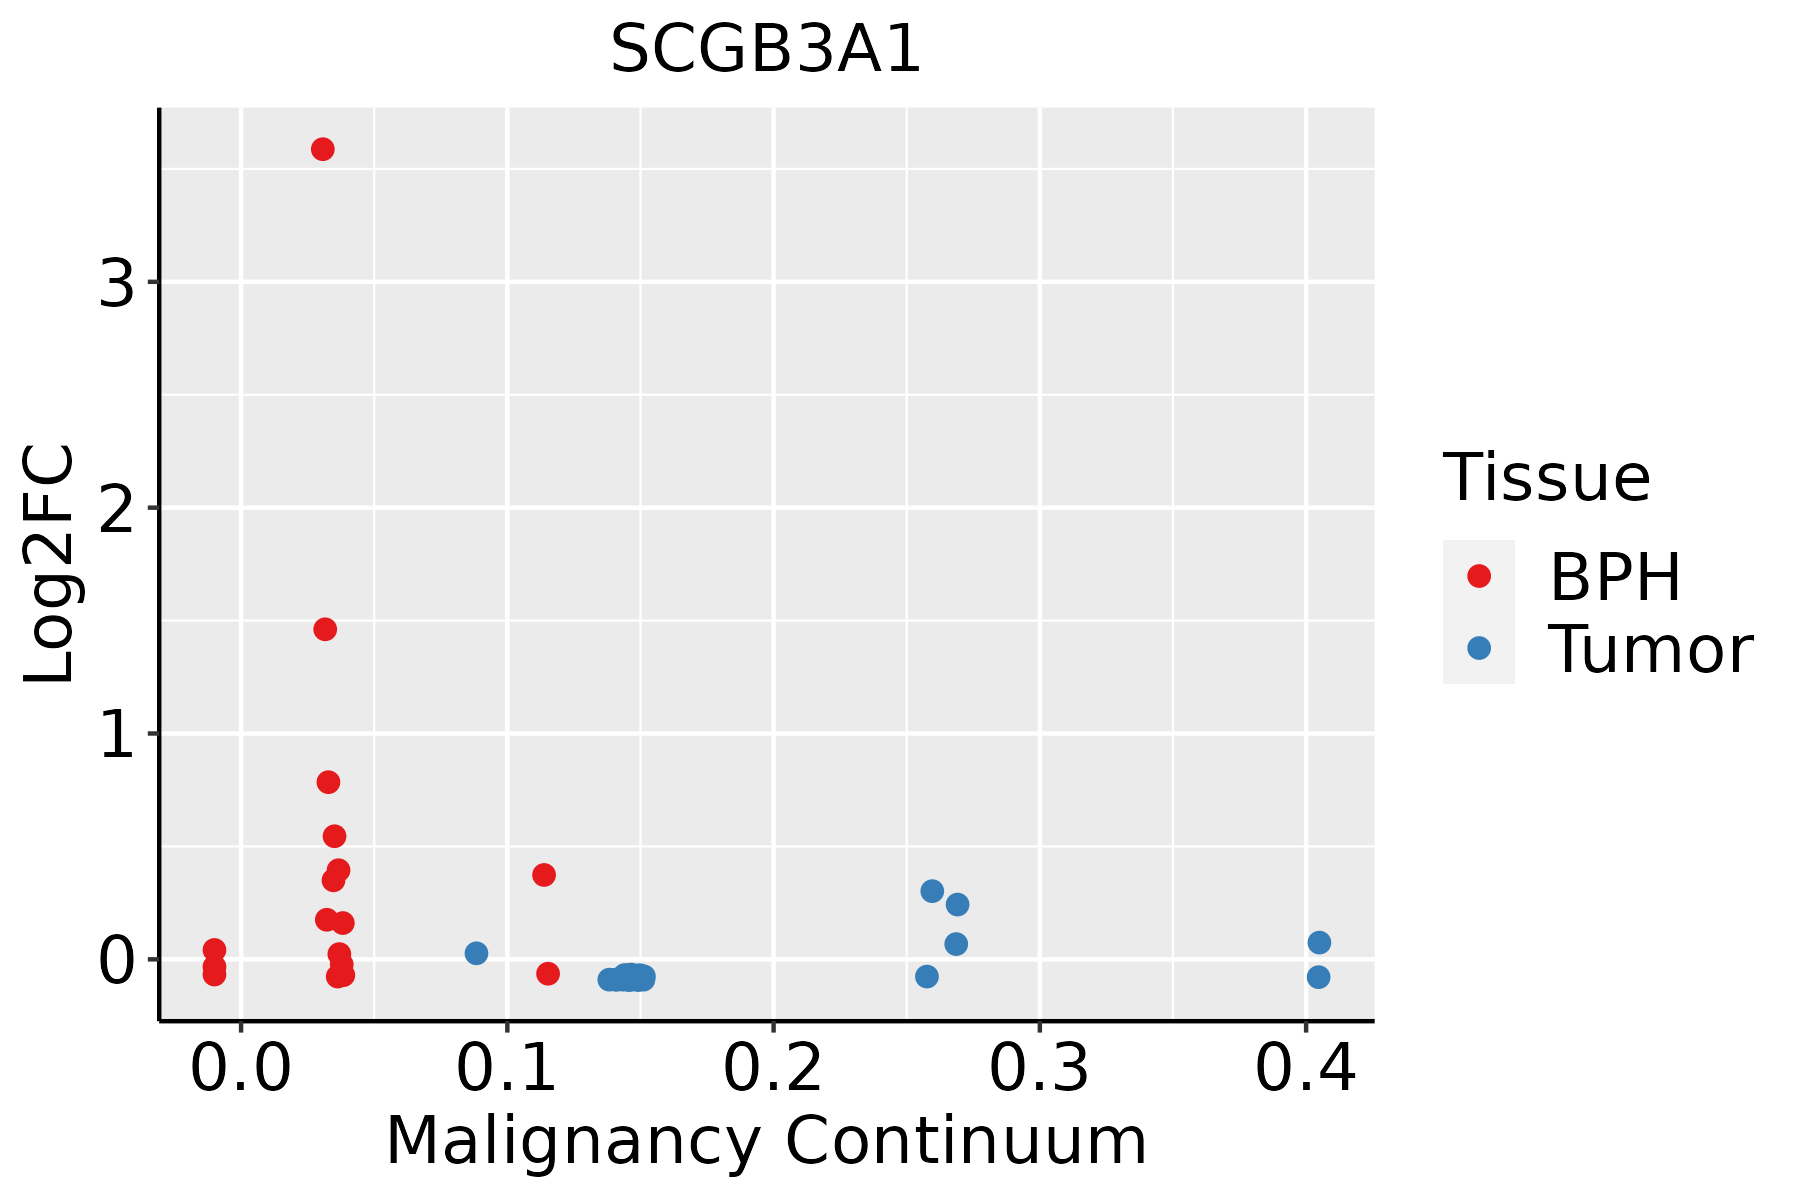 | BPH: Benign Prostatic Hyperplasia |
| ∗log2FC in expression of this searched gene in stem-like cells from each diseased tissue sample relative to stem-like cells in normal samples in each tissue plotted against the malignancy continuum. Samples are colored based on if they are from different disease stage. |
Top |
Malignant transformation related pathway analysis |
| Find out the enriched GO biological processes and KEGG pathways involved in transition from healthy to precancer to cancer |
| Tissue | Disease Stage | Enriched GO biological Processes |
| Colorectum | AD |  |
| Colorectum | SER |  |
| Colorectum | MSS |  |
| Colorectum | MSI-H |  |
| Colorectum | FAP |  |
| ∗Top 15 enriched GO BP terms are showed in the bar plot of each disease state in each tissue. Each row represents a significant GO biological process which is colored according to the -log10(p.adjust). |
| Page: 1 2 3 4 5 6 7 8 9 |
| GO ID | Tissue | Disease Stage | Description | Gene Ratio | Bg Ratio | pvalue | p.adjust | Count |
| GO:00160497 | Breast | Precancer | cell growth | 46/1080 | 482/18723 | 5.63e-04 | 7.16e-03 | 46 |
| GO:00015587 | Breast | Precancer | regulation of cell growth | 39/1080 | 414/18723 | 1.81e-03 | 1.78e-02 | 39 |
| GO:001604913 | Breast | IDC | cell growth | 56/1434 | 482/18723 | 1.16e-03 | 1.26e-02 | 56 |
| GO:000155813 | Breast | IDC | regulation of cell growth | 49/1434 | 414/18723 | 1.55e-03 | 1.55e-02 | 49 |
| GO:00426923 | Breast | IDC | muscle cell differentiation | 44/1434 | 384/18723 | 4.77e-03 | 3.66e-02 | 44 |
| GO:00511463 | Breast | IDC | striated muscle cell differentiation | 34/1434 | 283/18723 | 6.00e-03 | 4.31e-02 | 34 |
| GO:001604923 | Breast | DCIS | cell growth | 54/1390 | 482/18723 | 1.60e-03 | 1.59e-02 | 54 |
| GO:000155822 | Breast | DCIS | regulation of cell growth | 47/1390 | 414/18723 | 2.39e-03 | 2.16e-02 | 47 |
| GO:004269211 | Breast | DCIS | muscle cell differentiation | 43/1390 | 384/18723 | 4.56e-03 | 3.49e-02 | 43 |
| GO:005114611 | Breast | DCIS | striated muscle cell differentiation | 33/1390 | 283/18723 | 6.63e-03 | 4.62e-02 | 33 |
| GO:00160498 | Cervix | CC | cell growth | 92/2311 | 482/18723 | 1.16e-05 | 2.49e-04 | 92 |
| GO:00015588 | Cervix | CC | regulation of cell growth | 77/2311 | 414/18723 | 1.40e-04 | 1.70e-03 | 77 |
| GO:00426924 | Cervix | CC | muscle cell differentiation | 69/2311 | 384/18723 | 8.12e-04 | 7.09e-03 | 69 |
| GO:0000768 | Cervix | CC | syncytium formation by plasma membrane fusion | 15/2311 | 55/18723 | 2.14e-03 | 1.54e-02 | 15 |
| GO:0140253 | Cervix | CC | cell-cell fusion | 15/2311 | 55/18723 | 2.14e-03 | 1.54e-02 | 15 |
| GO:00069491 | Cervix | CC | syncytium formation | 15/2311 | 57/18723 | 3.13e-03 | 2.05e-02 | 15 |
| GO:00511464 | Cervix | CC | striated muscle cell differentiation | 50/2311 | 283/18723 | 5.53e-03 | 3.19e-02 | 50 |
| GO:005114612 | Cervix | HSIL_HPV | striated muscle cell differentiation | 22/737 | 283/18723 | 1.94e-03 | 2.04e-02 | 22 |
| GO:001604914 | Cervix | HSIL_HPV | cell growth | 32/737 | 482/18723 | 2.87e-03 | 2.70e-02 | 32 |
| GO:00007681 | Cervix | HSIL_HPV | syncytium formation by plasma membrane fusion | 7/737 | 55/18723 | 5.59e-03 | 4.47e-02 | 7 |
| Page: 1 2 3 4 |
| Pathway ID | Tissue | Disease Stage | Description | Gene Ratio | Bg Ratio | pvalue | p.adjust | qvalue | Count |
| Page: 1 |
Top |
Cell-cell communication analysis |
| Identification of potential cell-cell interactions between two cell types and their ligand-receptor pairs for different disease states |
| Ligand | Receptor | LRpair | Pathway | Tissue | Disease Stage |
| Page: 1 |
Top |
Single-cell gene regulatory network inference analysis |
| Find out the significant the regulons (TFs) and the target genes of each regulon across cell types for different disease states |
| TF | Cell Type | Tissue | Disease Stage | Target Gene | RSS | Regulon Activity |
| ∗The dot plots of a searched regulon are shown for all cell subpopulations in each disease state of each tissue based on the regulon specific score inferred using pySCENIC and by calculating the average expression. |
| Page: 1 |
Top |
Somatic mutation of malignant transformation related genes |
| Annotation of somatic variants for genes involved in malignant transformation |
| Hugo Symbol | Variant Class | Variant Classification | dbSNP RS | HGVSc | HGVSp | HGVSp Short | SWISSPROT | BIOTYPE | SIFT | PolyPhen | Tumor Sample Barcode | Tissue | Histology | Sex | Age | Stage | Therapy Types | Drugs | Outcome |
| SCGB3A1 | SNV | Missense_Mutation | novel | c.175N>A | p.Leu59Ile | p.L59I | Q96QR1 | protein_coding | tolerated(0.18) | benign(0.007) | TCGA-S3-AA15-01 | Breast | breast invasive carcinoma | Female | <65 | I/II | Chemotherapy | adriamycin | CR |
| SCGB3A1 | SNV | Missense_Mutation | rs773272977 | c.119N>T | p.Ala40Val | p.A40V | Q96QR1 | protein_coding | tolerated(0.53) | benign(0.005) | TCGA-A6-2677-01 | Colorectum | colon adenocarcinoma | Female | >=65 | III/IV | Ancillary | leucovorin | SD |
| SCGB3A1 | SNV | Missense_Mutation | novel | c.228N>T | p.Gln76His | p.Q76H | Q96QR1 | protein_coding | deleterious(0.01) | possibly_damaging(0.481) | TCGA-AJ-A3EL-01 | Endometrium | uterine corpus endometrioid carcinoma | Female | <65 | I/II | Unknown | Unknown | SD |
| SCGB3A1 | SNV | Missense_Mutation | novel | c.273G>T | p.Lys91Asn | p.K91N | Q96QR1 | protein_coding | tolerated(0.16) | benign(0.005) | TCGA-AX-A2HC-01 | Endometrium | uterine corpus endometrioid carcinoma | Female | <65 | III/IV | Chemotherapy | paclitaxel | PD |
| SCGB3A1 | SNV | Missense_Mutation | c.85G>T | p.Val29Leu | p.V29L | Q96QR1 | protein_coding | tolerated(0.08) | benign(0.013) | TCGA-39-5027-01 | Lung | lung squamous cell carcinoma | Male | >=65 | I/II | Unknown | Unknown | PD | |
| SCGB3A1 | SNV | Missense_Mutation | novel | c.241N>A | p.Glu81Lys | p.E81K | Q96QR1 | protein_coding | deleterious(0) | benign(0.303) | TCGA-T2-A6X2-01 | Oral cavity | head & neck squamous cell carcinoma | Male | >=65 | III/IV | Unknown | Unknown | SD |
| Page: 1 |
Top |
Related drugs of malignant transformation related genes |
| Identification of chemicals and drugs interact with genes involved in malignant transfromation |
| (DGIdb 4.0) |
| Entrez ID | Symbol | Category | Interaction Types | Drug Claim Name | Drug Name | PMIDs |
| Page: 1 |

Copyright 2023-Present -The University of Texas Health Science Center at Houston |