
|
|||||
|
 | |
| |
| |
| |
| |
| |
|
Gene: SCGB2A1 |
Gene summary for SCGB2A1 |
| Gene information | Species | Human | Gene symbol | SCGB2A1 | Gene ID | 4246 |
| Gene name | secretoglobin family 2A member 1 | |
| Gene Alias | LPHC | |
| Cytomap | 11q12.3 | |
| Gene Type | protein-coding | GO ID | GO:0007154 | UniProtAcc | O75556 |
Top |
Malignant transformation analysis |
| Identification of the aberrant gene expression in precancerous and cancerous lesions by comparing the gene expression of stem-like cells in diseased tissues with normal stem cells |
| Entrez ID | Symbol | Replicates | Species | Organ | Tissue | Adj P-value | Log2FC | Malignancy |
| 4246 | SCGB2A1 | GSM4909286 | Human | Breast | IDC | 1.65e-04 | -1.63e-01 | 0.1081 |
| 4246 | SCGB2A1 | GSM4909298 | Human | Breast | IDC | 3.81e-06 | 3.11e-01 | 0.1551 |
| 4246 | SCGB2A1 | GSM4909299 | Human | Breast | IDC | 4.75e-33 | 1.07e+00 | 0.035 |
| 4246 | SCGB2A1 | GSM4909301 | Human | Breast | IDC | 1.65e-04 | -1.63e-01 | 0.1577 |
| 4246 | SCGB2A1 | GSM4909302 | Human | Breast | IDC | 1.67e-03 | -1.63e-01 | 0.1545 |
| 4246 | SCGB2A1 | GSM4909304 | Human | Breast | IDC | 4.83e-02 | -1.55e-01 | 0.1636 |
| 4246 | SCGB2A1 | GSM4909305 | Human | Breast | IDC | 1.62e-03 | 4.12e-01 | 0.0436 |
| 4246 | SCGB2A1 | GSM4909319 | Human | Breast | IDC | 1.53e-03 | 3.97e-02 | 0.1563 |
| 4246 | SCGB2A1 | brca3 | Human | Breast | Precancer | 3.29e-02 | -1.49e-01 | -0.0263 |
| 4246 | SCGB2A1 | DCIS2 | Human | Breast | DCIS | 6.77e-37 | 7.37e-01 | 0.0085 |
| 4246 | SCGB2A1 | CA_HPV_1 | Human | Cervix | CC | 4.00e-05 | -1.61e-01 | 0.0264 |
| 4246 | SCGB2A1 | CA_HPV_2 | Human | Cervix | CC | 3.83e-04 | -1.59e-01 | 0.0391 |
| 4246 | SCGB2A1 | HSIL_HPV_2 | Human | Cervix | HSIL_HPV | 2.32e-06 | 3.61e-01 | 0.0208 |
| 4246 | SCGB2A1 | sample3 | Human | Cervix | CC | 1.10e-02 | -1.48e-01 | 0.1387 |
| 4246 | SCGB2A1 | H2 | Human | Cervix | HSIL_HPV | 8.42e-83 | 1.62e+00 | 0.0632 |
| 4246 | SCGB2A1 | T2 | Human | Cervix | CC | 5.72e-15 | 9.38e-01 | 0.0709 |
| 4246 | SCGB2A1 | T3 | Human | Cervix | CC | 1.37e-02 | -1.57e-01 | 0.1389 |
| 4246 | SCGB2A1 | AEH-subject3 | Human | Endometrium | AEH | 9.41e-05 | 3.98e-01 | -0.2576 |
| 4246 | SCGB2A1 | AEH-subject4 | Human | Endometrium | AEH | 4.18e-03 | 2.02e-01 | -0.2657 |
| 4246 | SCGB2A1 | AEH-subject5 | Human | Endometrium | AEH | 5.71e-10 | 6.35e-01 | -0.2953 |
| Page: 1 2 |
| Tissue | Expression Dynamics | Abbreviation |
| Breast | 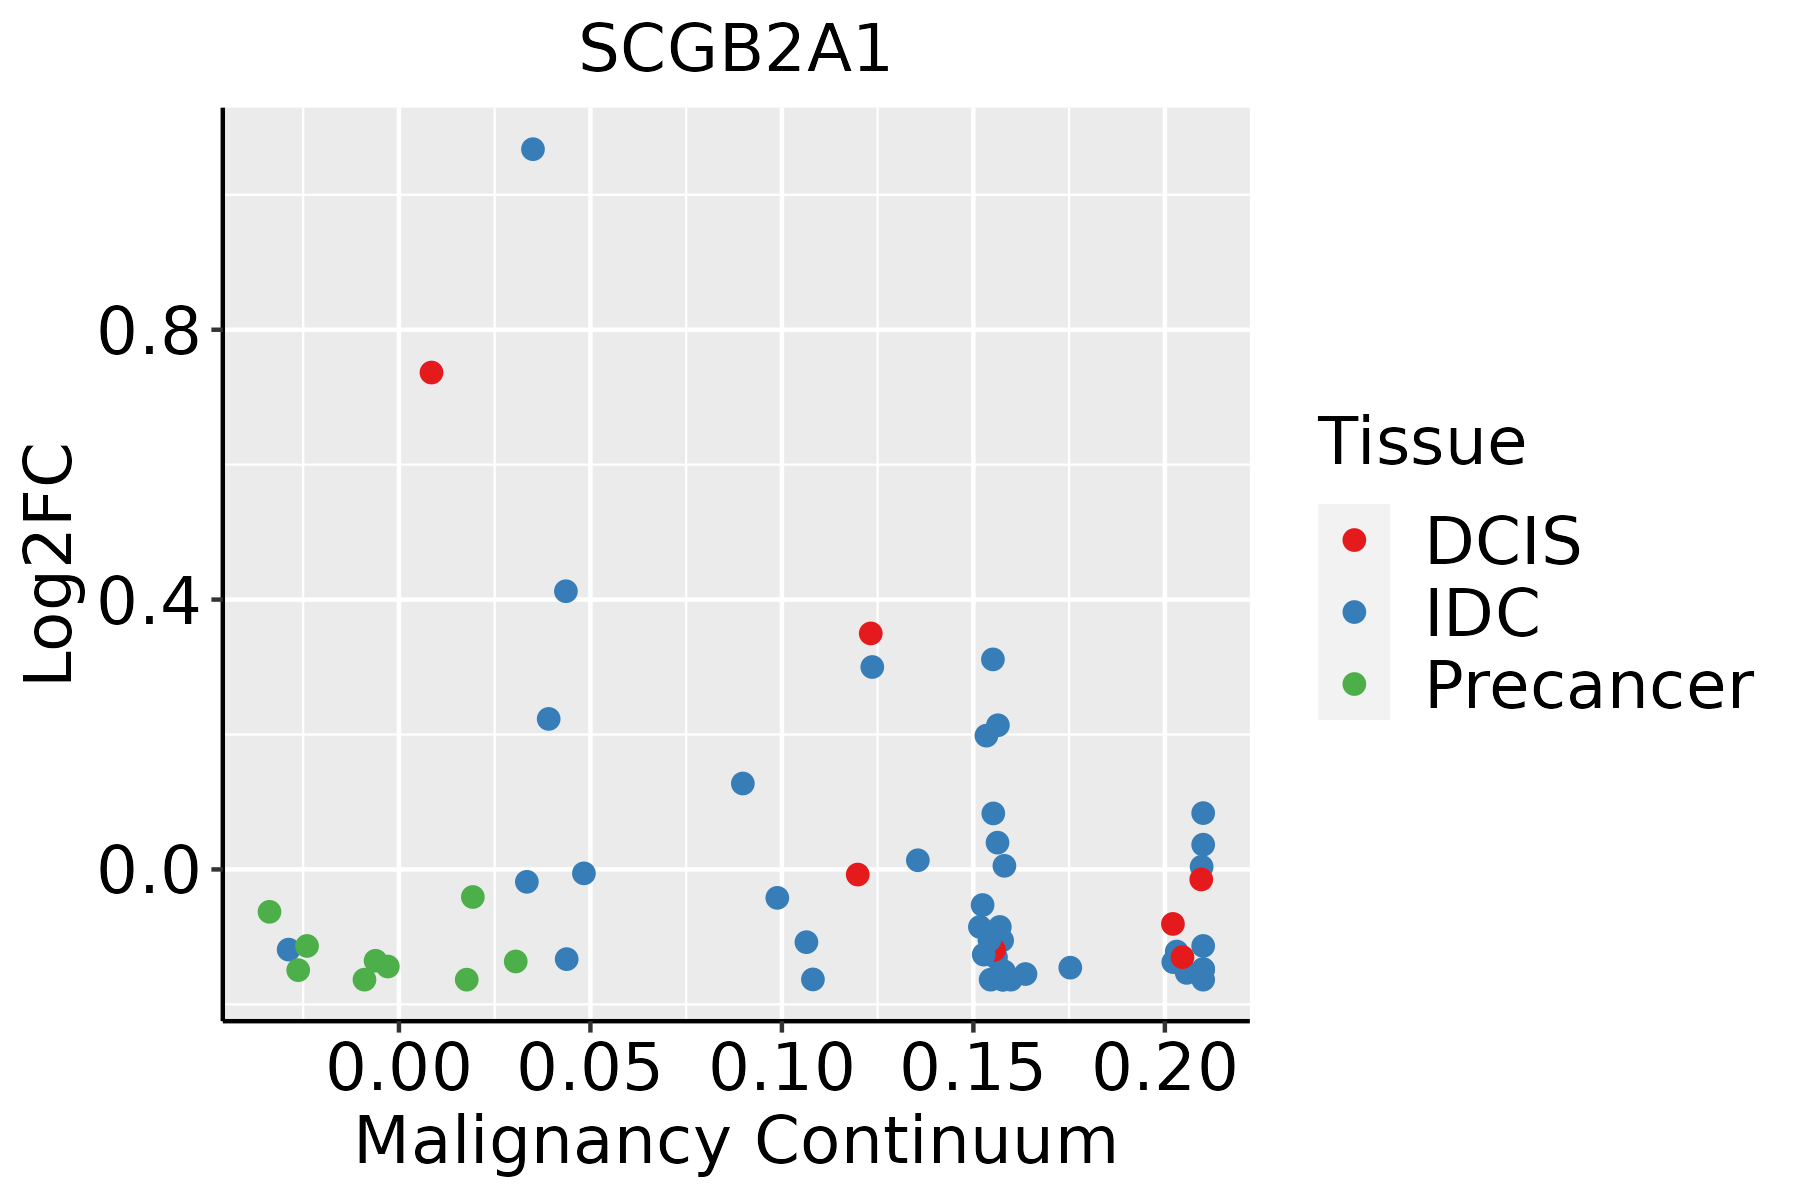 | IDC: Invasive ductal carcinoma |
| DCIS: Ductal carcinoma in situ | ||
| Precancer(BRCA1-mut): Precancerous lesion from BRCA1 mutation carriers | ||
| Cervix | 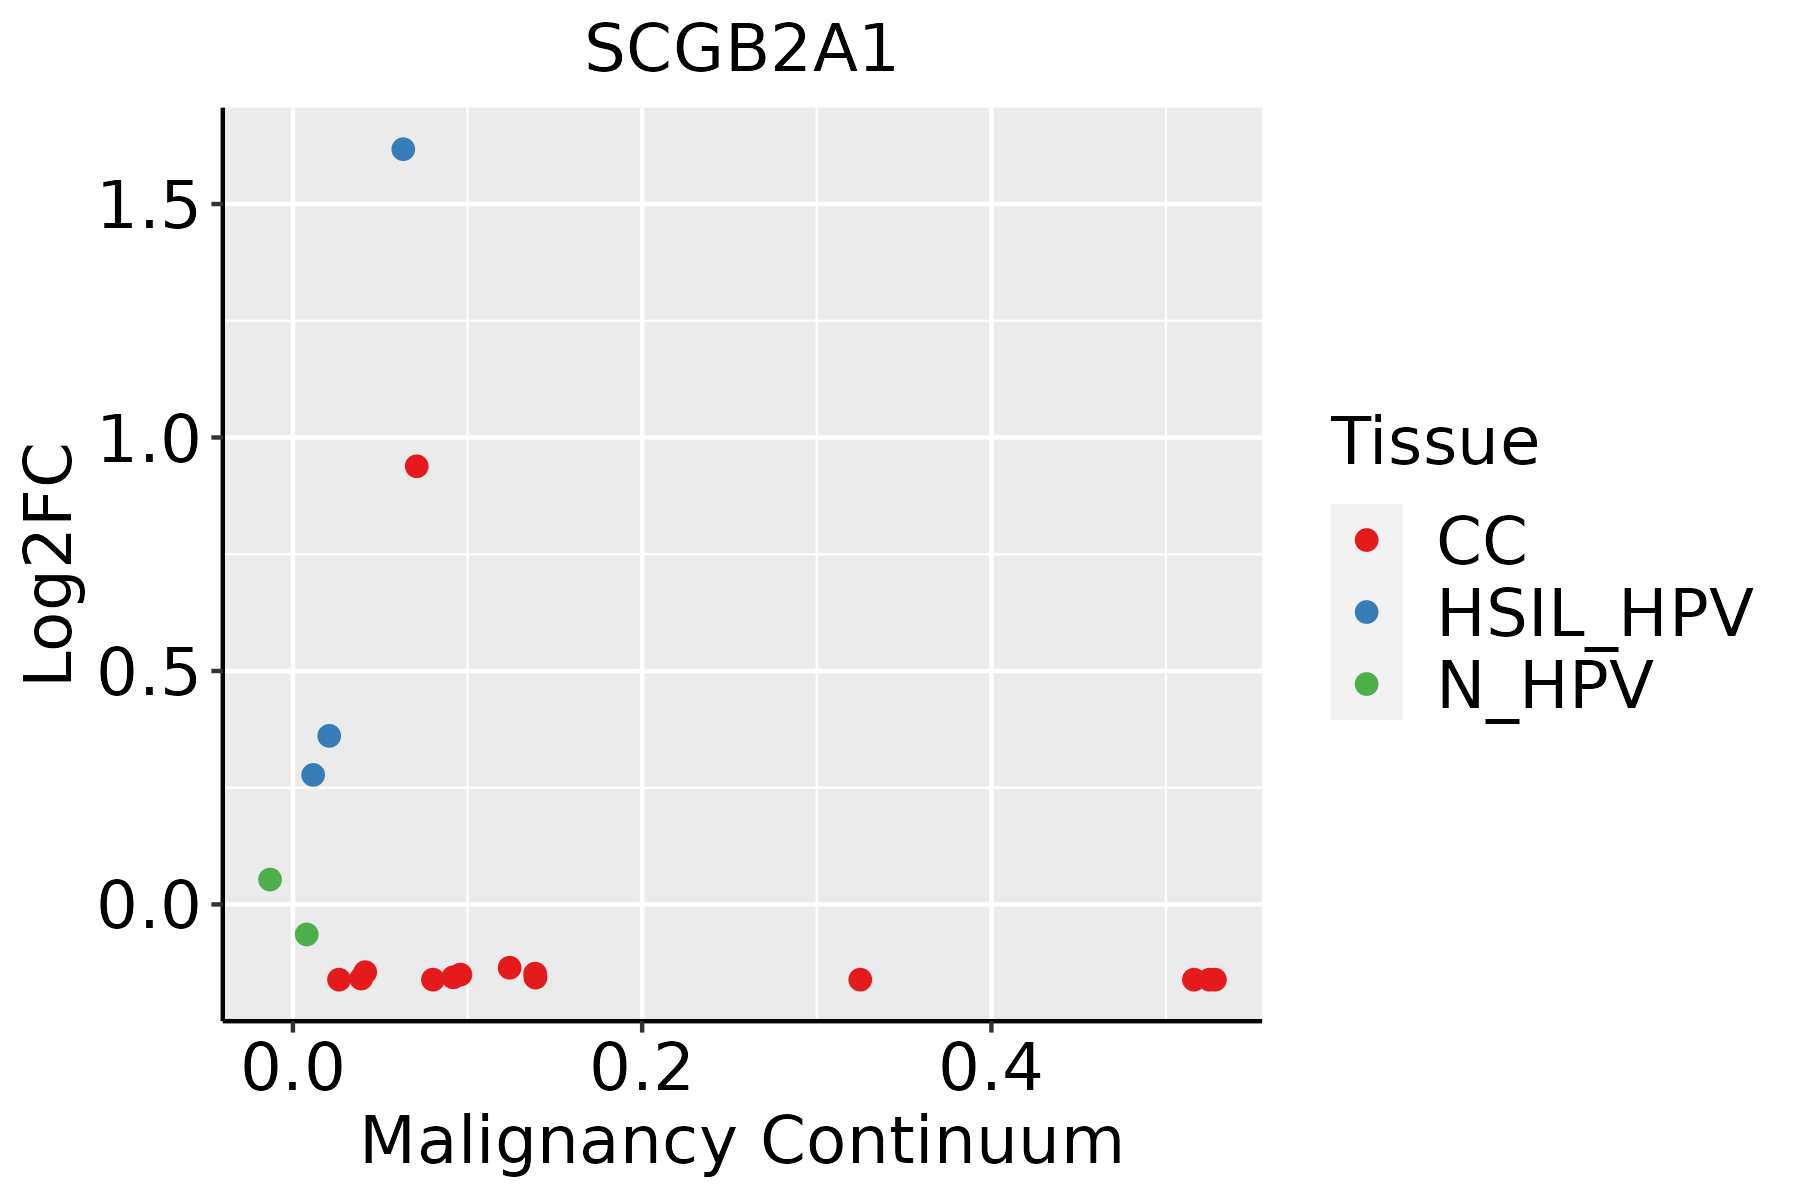 | CC: Cervix cancer |
| HSIL_HPV: HPV-infected high-grade squamous intraepithelial lesions | ||
| N_HPV: HPV-infected normal cervix | ||
| Endometrium | 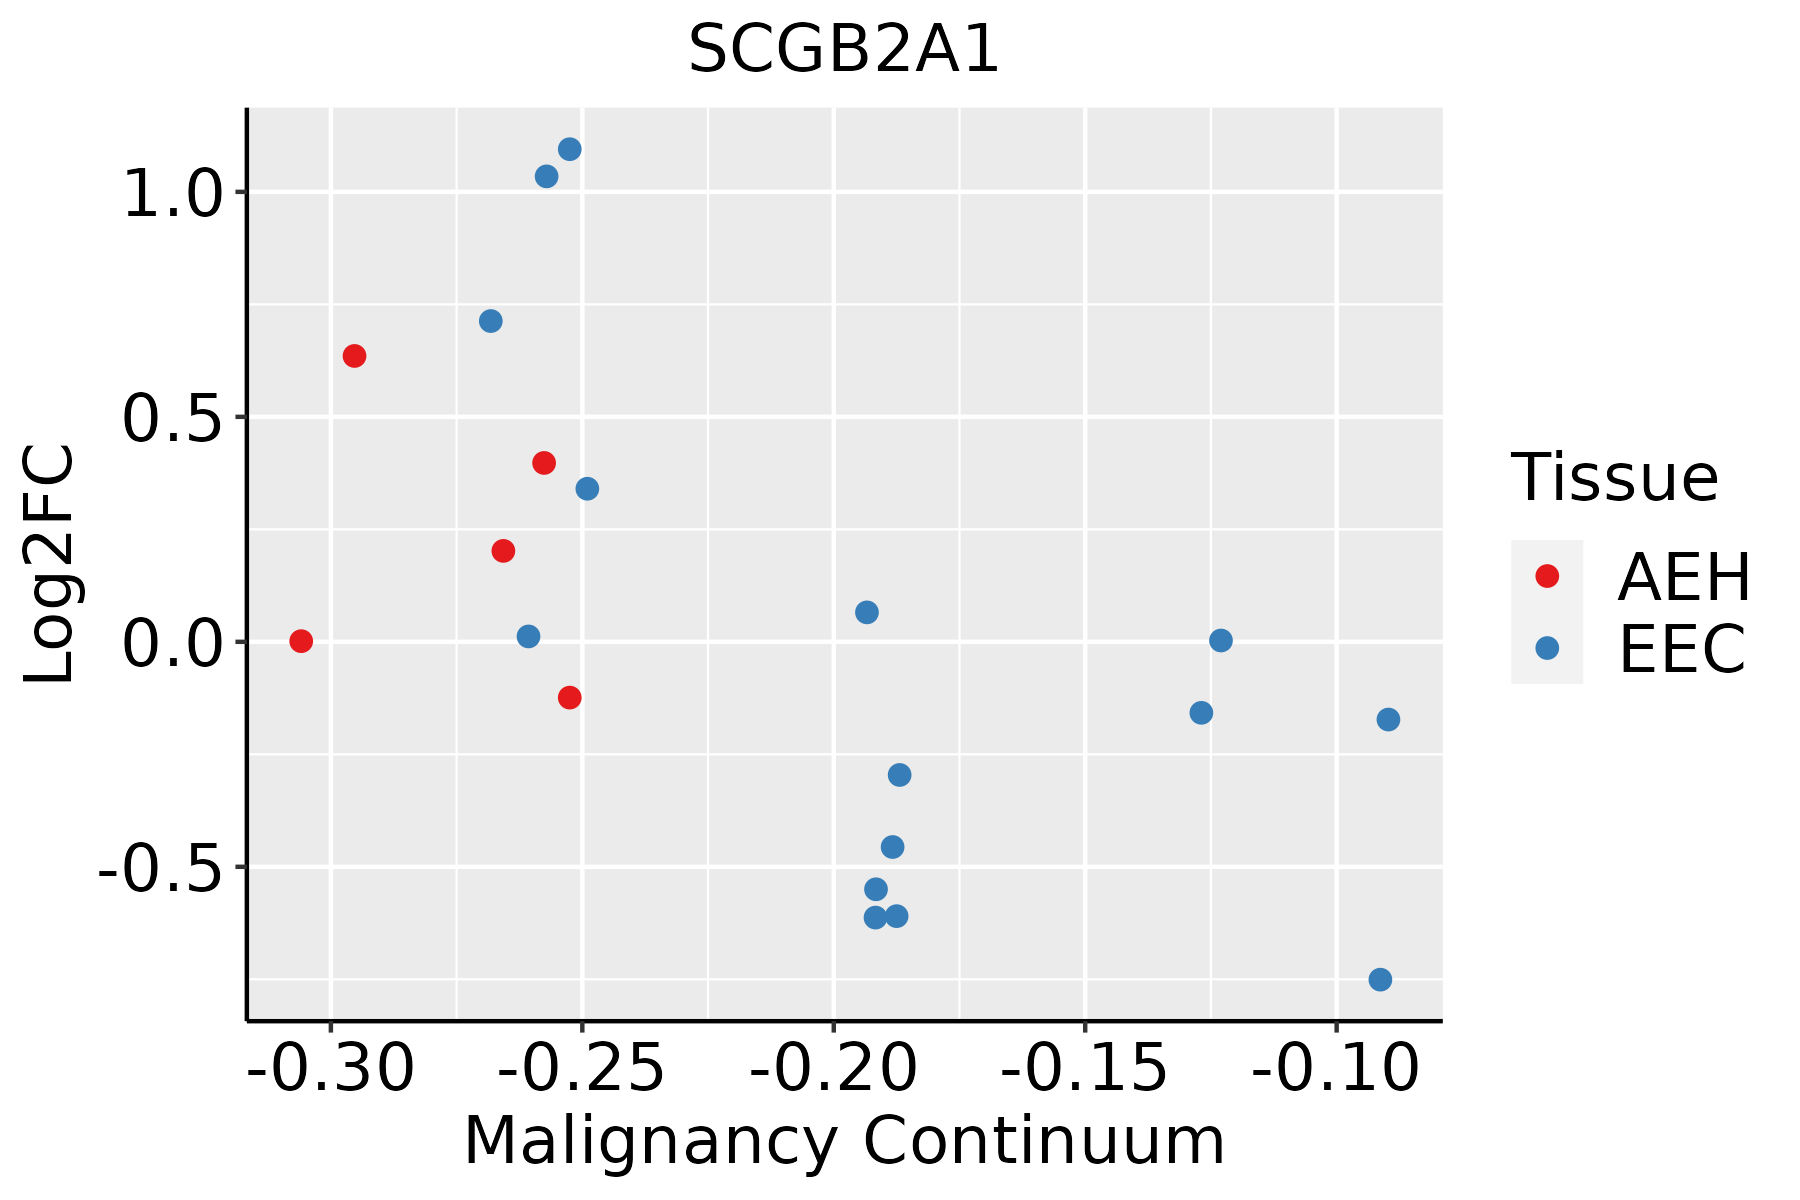 | AEH: Atypical endometrial hyperplasia |
| EEC: Endometrioid Cancer | ||
| Oral Cavity |  | EOLP: Erosive Oral lichen planus |
| LP: leukoplakia | ||
| NEOLP: Non-erosive oral lichen planus | ||
| OSCC: Oral squamous cell carcinoma |
| ∗log2FC in expression of this searched gene in stem-like cells from each diseased tissue sample relative to stem-like cells in normal samples in each tissue plotted against the malignancy continuum. Samples are colored based on if they are from different disease stage. |
Top |
Malignant transformation related pathway analysis |
| Find out the enriched GO biological processes and KEGG pathways involved in transition from healthy to precancer to cancer |
| Tissue | Disease Stage | Enriched GO biological Processes |
| Colorectum | AD |  |
| Colorectum | SER |  |
| Colorectum | MSS |  |
| Colorectum | MSI-H |  |
| Colorectum | FAP |  |
| ∗Top 15 enriched GO BP terms are showed in the bar plot of each disease state in each tissue. Each row represents a significant GO biological process which is colored according to the -log10(p.adjust). |
| Page: 1 2 3 4 5 6 7 8 9 |
| GO ID | Tissue | Disease Stage | Description | Gene Ratio | Bg Ratio | pvalue | p.adjust | Count |
| GO:00485459 | Breast | Precancer | response to steroid hormone | 53/1080 | 339/18723 | 3.07e-11 | 3.66e-09 | 53 |
| GO:00713838 | Breast | Precancer | cellular response to steroid hormone stimulus | 28/1080 | 204/18723 | 1.78e-05 | 4.26e-04 | 28 |
| GO:00305217 | Breast | Precancer | androgen receptor signaling pathway | 10/1080 | 44/18723 | 1.61e-04 | 2.69e-03 | 10 |
| GO:00305187 | Breast | Precancer | intracellular steroid hormone receptor signaling pathway | 16/1080 | 116/18723 | 1.01e-03 | 1.13e-02 | 16 |
| GO:00305228 | Breast | Precancer | intracellular receptor signaling pathway | 27/1080 | 265/18723 | 2.99e-03 | 2.57e-02 | 27 |
| GO:00434018 | Breast | Precancer | steroid hormone mediated signaling pathway | 16/1080 | 136/18723 | 5.21e-03 | 3.88e-02 | 16 |
| GO:004854514 | Breast | IDC | response to steroid hormone | 70/1434 | 339/18723 | 1.34e-14 | 4.23e-12 | 70 |
| GO:007138314 | Breast | IDC | cellular response to steroid hormone stimulus | 35/1434 | 204/18723 | 5.29e-06 | 1.75e-04 | 35 |
| GO:003051813 | Breast | IDC | intracellular steroid hormone receptor signaling pathway | 22/1434 | 116/18723 | 6.16e-05 | 1.28e-03 | 22 |
| GO:003052113 | Breast | IDC | androgen receptor signaling pathway | 12/1434 | 44/18723 | 8.17e-05 | 1.60e-03 | 12 |
| GO:003052214 | Breast | IDC | intracellular receptor signaling pathway | 37/1434 | 265/18723 | 2.77e-04 | 4.26e-03 | 37 |
| GO:004340113 | Breast | IDC | steroid hormone mediated signaling pathway | 22/1434 | 136/18723 | 6.51e-04 | 8.04e-03 | 22 |
| GO:004854524 | Breast | DCIS | response to steroid hormone | 67/1390 | 339/18723 | 1.02e-13 | 2.76e-11 | 67 |
| GO:007138324 | Breast | DCIS | cellular response to steroid hormone stimulus | 34/1390 | 204/18723 | 7.04e-06 | 1.95e-04 | 34 |
| GO:003051823 | Breast | DCIS | intracellular steroid hormone receptor signaling pathway | 21/1390 | 116/18723 | 1.16e-04 | 2.03e-03 | 21 |
| GO:003052122 | Breast | DCIS | androgen receptor signaling pathway | 11/1390 | 44/18723 | 2.83e-04 | 4.19e-03 | 11 |
| GO:003052224 | Breast | DCIS | intracellular receptor signaling pathway | 35/1390 | 265/18723 | 6.38e-04 | 7.92e-03 | 35 |
| GO:004340122 | Breast | DCIS | steroid hormone mediated signaling pathway | 21/1390 | 136/18723 | 1.06e-03 | 1.16e-02 | 21 |
| GO:004854510 | Cervix | CC | response to steroid hormone | 74/2311 | 339/18723 | 5.71e-07 | 2.09e-05 | 74 |
| GO:00305229 | Cervix | CC | intracellular receptor signaling pathway | 60/2311 | 265/18723 | 1.89e-06 | 5.97e-05 | 60 |
| Page: 1 2 3 |
| Pathway ID | Tissue | Disease Stage | Description | Gene Ratio | Bg Ratio | pvalue | p.adjust | qvalue | Count |
| Page: 1 |
Top |
Cell-cell communication analysis |
| Identification of potential cell-cell interactions between two cell types and their ligand-receptor pairs for different disease states |
| Ligand | Receptor | LRpair | Pathway | Tissue | Disease Stage |
| Page: 1 |
Top |
Single-cell gene regulatory network inference analysis |
| Find out the significant the regulons (TFs) and the target genes of each regulon across cell types for different disease states |
| TF | Cell Type | Tissue | Disease Stage | Target Gene | RSS | Regulon Activity |
| ∗The dot plots of a searched regulon are shown for all cell subpopulations in each disease state of each tissue based on the regulon specific score inferred using pySCENIC and by calculating the average expression. |
| Page: 1 |
Top |
Somatic mutation of malignant transformation related genes |
| Annotation of somatic variants for genes involved in malignant transformation |
| Hugo Symbol | Variant Class | Variant Classification | dbSNP RS | HGVSc | HGVSp | HGVSp Short | SWISSPROT | BIOTYPE | SIFT | PolyPhen | Tumor Sample Barcode | Tissue | Histology | Sex | Age | Stage | Therapy Types | Drugs | Outcome |
| SCGB2A1 | SNV | Missense_Mutation | novel | c.59N>G | p.Ser20Cys | p.S20C | O75556 | protein_coding | deleterious(0.02) | probably_damaging(0.956) | TCGA-BH-A28Q-01 | Breast | breast invasive carcinoma | Female | <65 | I/II | Unknown | Unknown | SD |
| SCGB2A1 | SNV | Missense_Mutation | c.142G>C | p.Glu48Gln | p.E48Q | O75556 | protein_coding | tolerated(0.18) | benign(0.229) | TCGA-C8-A1HJ-01 | Breast | breast invasive carcinoma | Female | <65 | I/II | Unknown | Unknown | SD | |
| SCGB2A1 | SNV | Missense_Mutation | novel | c.166G>A | p.Ala56Thr | p.A56T | O75556 | protein_coding | tolerated(0.5) | benign(0.258) | TCGA-A5-A0G1-01 | Endometrium | uterine corpus endometrioid carcinoma | Female | >=65 | I/II | Unknown | Unknown | SD |
| SCGB2A1 | SNV | Missense_Mutation | c.233N>A | p.Gly78Glu | p.G78E | O75556 | protein_coding | tolerated(0.97) | benign(0.018) | TCGA-AP-A051-01 | Endometrium | uterine corpus endometrioid carcinoma | Female | >=65 | I/II | Unknown | Unknown | SD | |
| SCGB2A1 | SNV | Missense_Mutation | c.257N>C | p.Asp86Ala | p.D86A | O75556 | protein_coding | deleterious(0.03) | possibly_damaging(0.506) | TCGA-AX-A05Z-01 | Endometrium | uterine corpus endometrioid carcinoma | Female | <65 | III/IV | Chemotherapy | adriamycin | SD | |
| SCGB2A1 | SNV | Missense_Mutation | c.24N>A | p.Met8Ile | p.M8I | O75556 | protein_coding | deleterious(0.02) | benign(0.031) | TCGA-18-3410-01 | Lung | lung squamous cell carcinoma | Male | >=65 | I/II | Unknown | Unknown | SD | |
| SCGB2A1 | SNV | Missense_Mutation | c.154A>G | p.Ser52Gly | p.S52G | O75556 | protein_coding | tolerated(0.72) | benign(0.003) | TCGA-21-1070-01 | Lung | lung squamous cell carcinoma | Female | <65 | III/IV | Unknown | Unknown | SD | |
| SCGB2A1 | SNV | Missense_Mutation | novel | c.131N>G | p.Glu44Gly | p.E44G | O75556 | protein_coding | tolerated(0.17) | benign(0.01) | TCGA-39-5034-01 | Lung | lung squamous cell carcinoma | Female | >=65 | I/II | Unknown | Unknown | PD |
| SCGB2A1 | SNV | Missense_Mutation | novel | c.171N>T | p.Glu57Asp | p.E57D | O75556 | protein_coding | tolerated(0.49) | benign(0.026) | TCGA-92-7340-01 | Lung | lung squamous cell carcinoma | Female | <65 | I/II | Chemotherapy | cisplatin | SD |
| Page: 1 |
Top |
Related drugs of malignant transformation related genes |
| Identification of chemicals and drugs interact with genes involved in malignant transfromation |
| (DGIdb 4.0) |
| Entrez ID | Symbol | Category | Interaction Types | Drug Claim Name | Drug Name | PMIDs |
| Page: 1 |

Copyright 2023-Present -The University of Texas Health Science Center at Houston |