
|
|||||
|
 | |
| |
| |
| |
| |
| |
|
Gene: SCGB1D2 |
Gene summary for SCGB1D2 |
| Gene information | Species | Human | Gene symbol | SCGB1D2 | Gene ID | 10647 |
| Gene name | secretoglobin family 1D member 2 | |
| Gene Alias | LIPB | |
| Cytomap | 11q12.3 | |
| Gene Type | protein-coding | GO ID | GO:0005575 | UniProtAcc | O95969 |
Top |
Malignant transformation analysis |
| Identification of the aberrant gene expression in precancerous and cancerous lesions by comparing the gene expression of stem-like cells in diseased tissues with normal stem cells |
| Entrez ID | Symbol | Replicates | Species | Organ | Tissue | Adj P-value | Log2FC | Malignancy |
| 10647 | SCGB1D2 | GSM4909281 | Human | Breast | IDC | 6.06e-06 | -3.09e-01 | 0.21 |
| 10647 | SCGB1D2 | GSM4909282 | Human | Breast | IDC | 7.27e-12 | -3.30e-01 | -0.0288 |
| 10647 | SCGB1D2 | GSM4909285 | Human | Breast | IDC | 7.73e-09 | -3.23e-01 | 0.21 |
| 10647 | SCGB1D2 | GSM4909286 | Human | Breast | IDC | 7.27e-12 | -3.28e-01 | 0.1081 |
| 10647 | SCGB1D2 | GSM4909287 | Human | Breast | IDC | 1.05e-02 | -2.74e-01 | 0.2057 |
| 10647 | SCGB1D2 | GSM4909290 | Human | Breast | IDC | 1.38e-12 | 5.58e-01 | 0.2096 |
| 10647 | SCGB1D2 | GSM4909297 | Human | Breast | IDC | 3.14e-11 | 6.85e-01 | 0.1517 |
| 10647 | SCGB1D2 | GSM4909299 | Human | Breast | IDC | 2.29e-58 | 1.28e+00 | 0.035 |
| 10647 | SCGB1D2 | GSM4909300 | Human | Breast | IDC | 3.37e-04 | 6.13e-01 | 0.0334 |
| 10647 | SCGB1D2 | GSM4909301 | Human | Breast | IDC | 4.79e-10 | -3.29e-01 | 0.1577 |
| 10647 | SCGB1D2 | GSM4909302 | Human | Breast | IDC | 3.00e-03 | -2.77e-01 | 0.1545 |
| 10647 | SCGB1D2 | GSM4909304 | Human | Breast | IDC | 9.05e-08 | -3.18e-01 | 0.1636 |
| 10647 | SCGB1D2 | GSM4909305 | Human | Breast | IDC | 1.23e-08 | 5.56e-01 | 0.0436 |
| 10647 | SCGB1D2 | GSM4909306 | Human | Breast | IDC | 8.26e-18 | 5.93e-01 | 0.1564 |
| 10647 | SCGB1D2 | GSM4909308 | Human | Breast | IDC | 7.16e-09 | -3.36e-01 | 0.158 |
| 10647 | SCGB1D2 | GSM4909309 | Human | Breast | IDC | 1.19e-08 | 7.23e-01 | 0.0483 |
| 10647 | SCGB1D2 | GSM4909311 | Human | Breast | IDC | 6.22e-44 | 1.17e+00 | 0.1534 |
| 10647 | SCGB1D2 | GSM4909312 | Human | Breast | IDC | 9.03e-99 | 1.63e+00 | 0.1552 |
| 10647 | SCGB1D2 | GSM4909313 | Human | Breast | IDC | 5.43e-26 | 1.06e+00 | 0.0391 |
| 10647 | SCGB1D2 | GSM4909315 | Human | Breast | IDC | 7.31e-03 | -2.91e-01 | 0.21 |
| Page: 1 2 3 |
| Tissue | Expression Dynamics | Abbreviation |
| Breast | 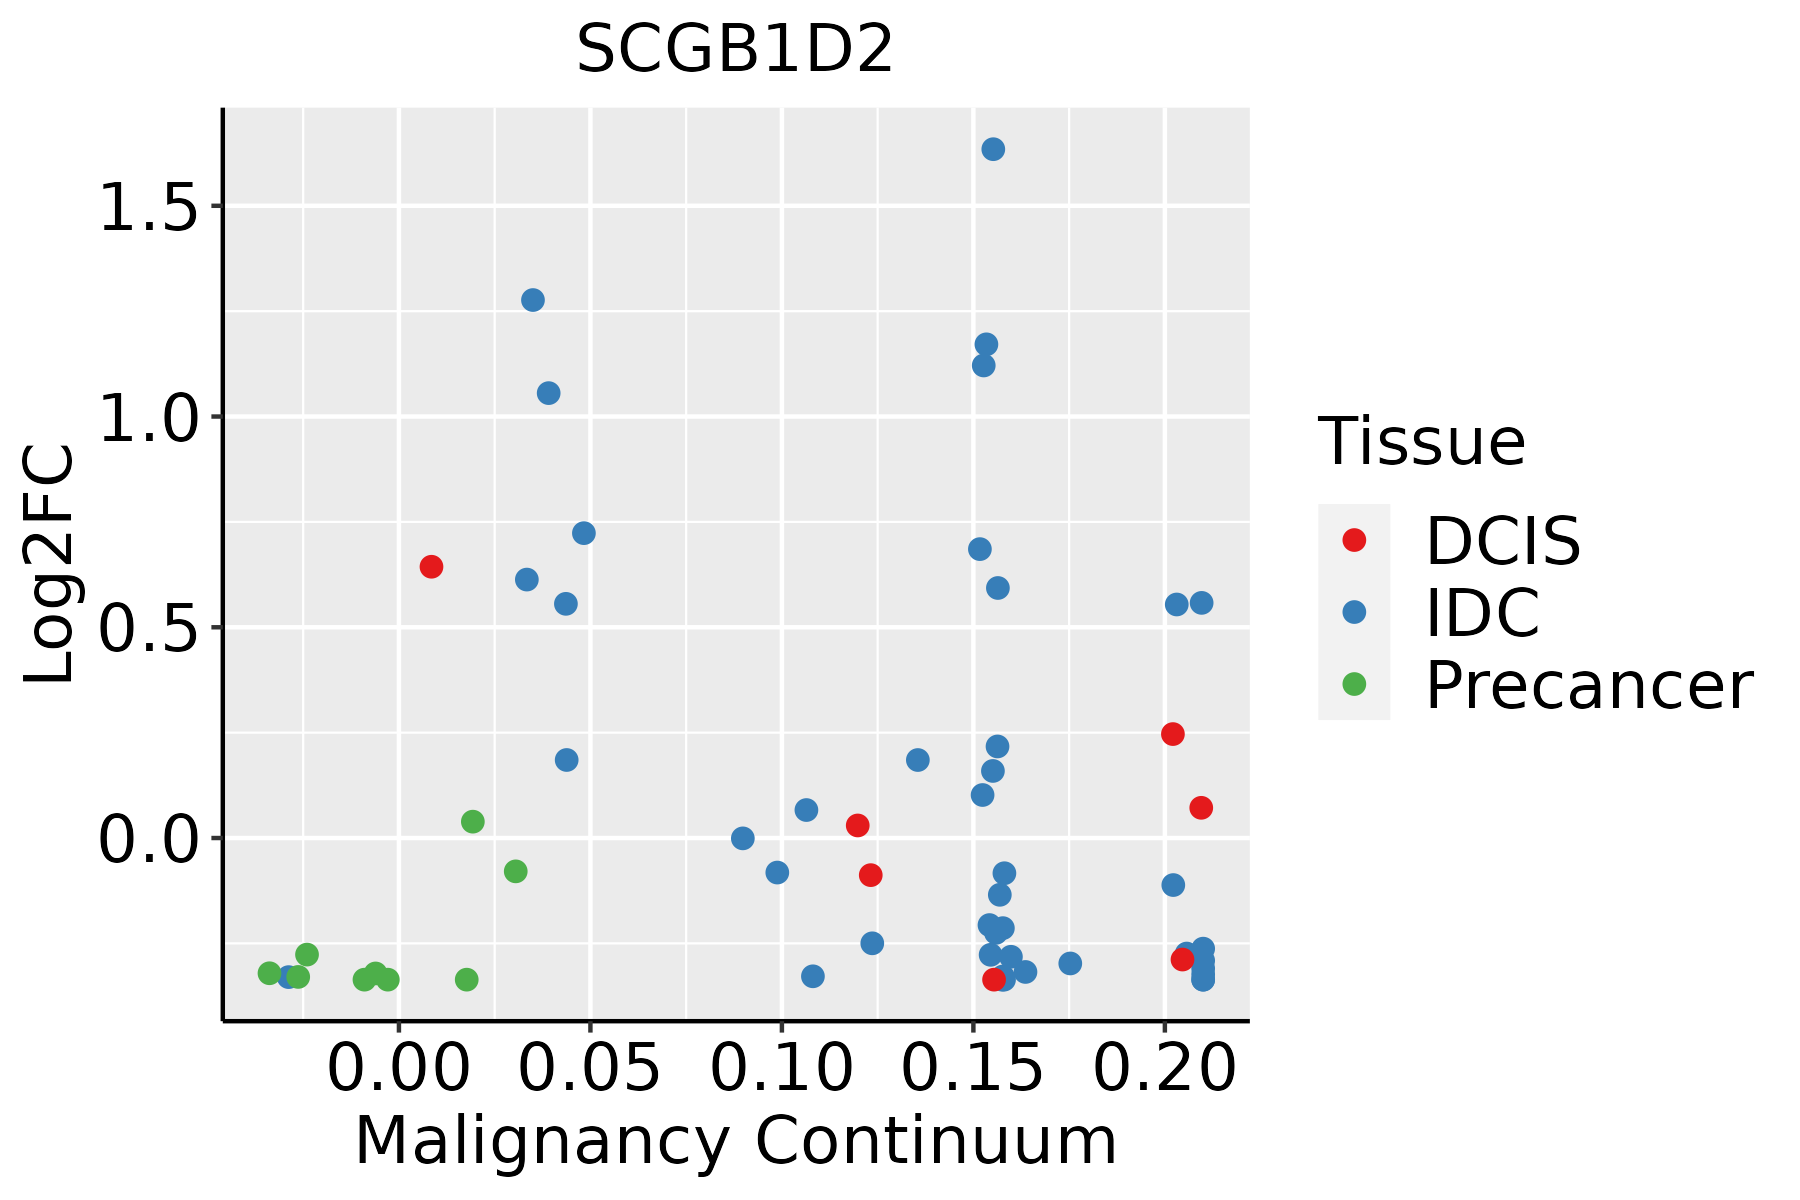 | IDC: Invasive ductal carcinoma |
| DCIS: Ductal carcinoma in situ | ||
| Precancer(BRCA1-mut): Precancerous lesion from BRCA1 mutation carriers | ||
| Cervix | 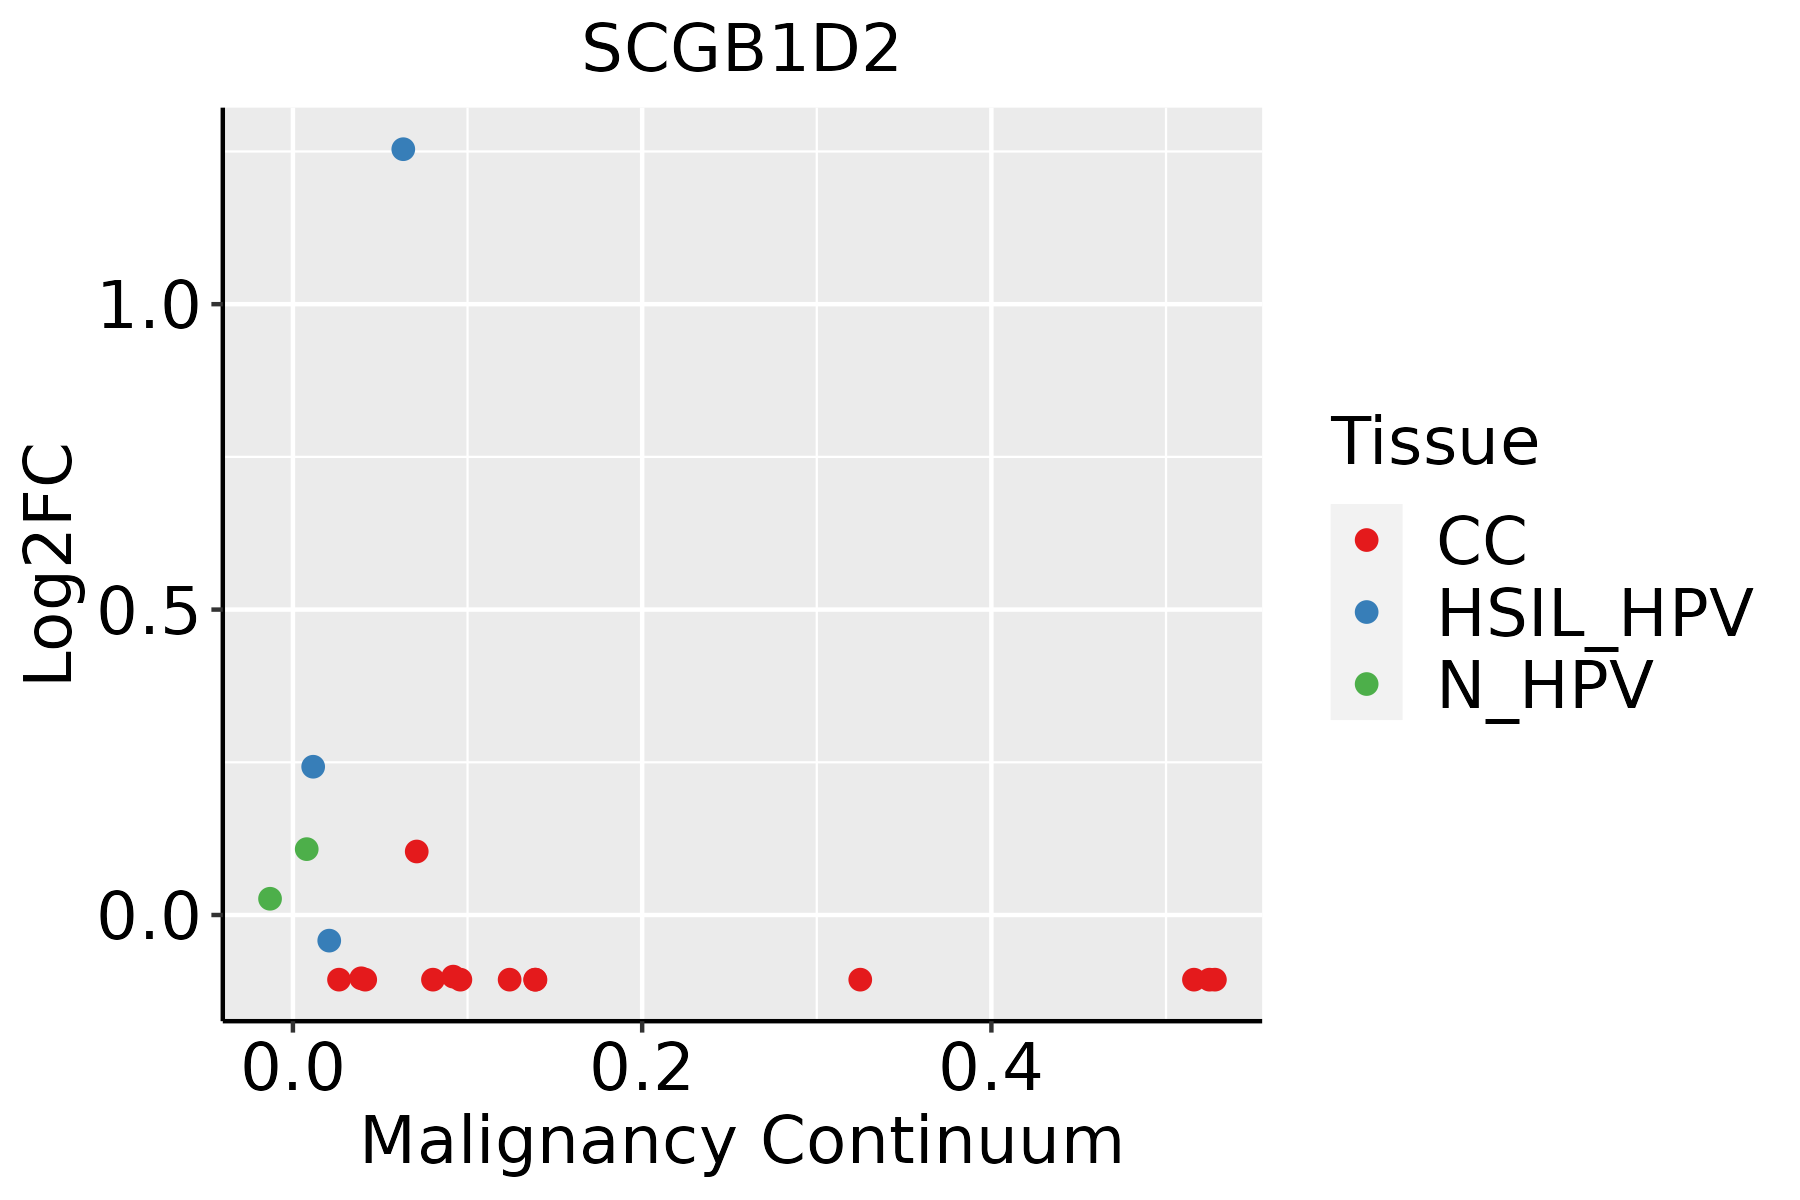 | CC: Cervix cancer |
| HSIL_HPV: HPV-infected high-grade squamous intraepithelial lesions | ||
| N_HPV: HPV-infected normal cervix | ||
| Endometrium |  | AEH: Atypical endometrial hyperplasia |
| EEC: Endometrioid Cancer | ||
| Prostate | 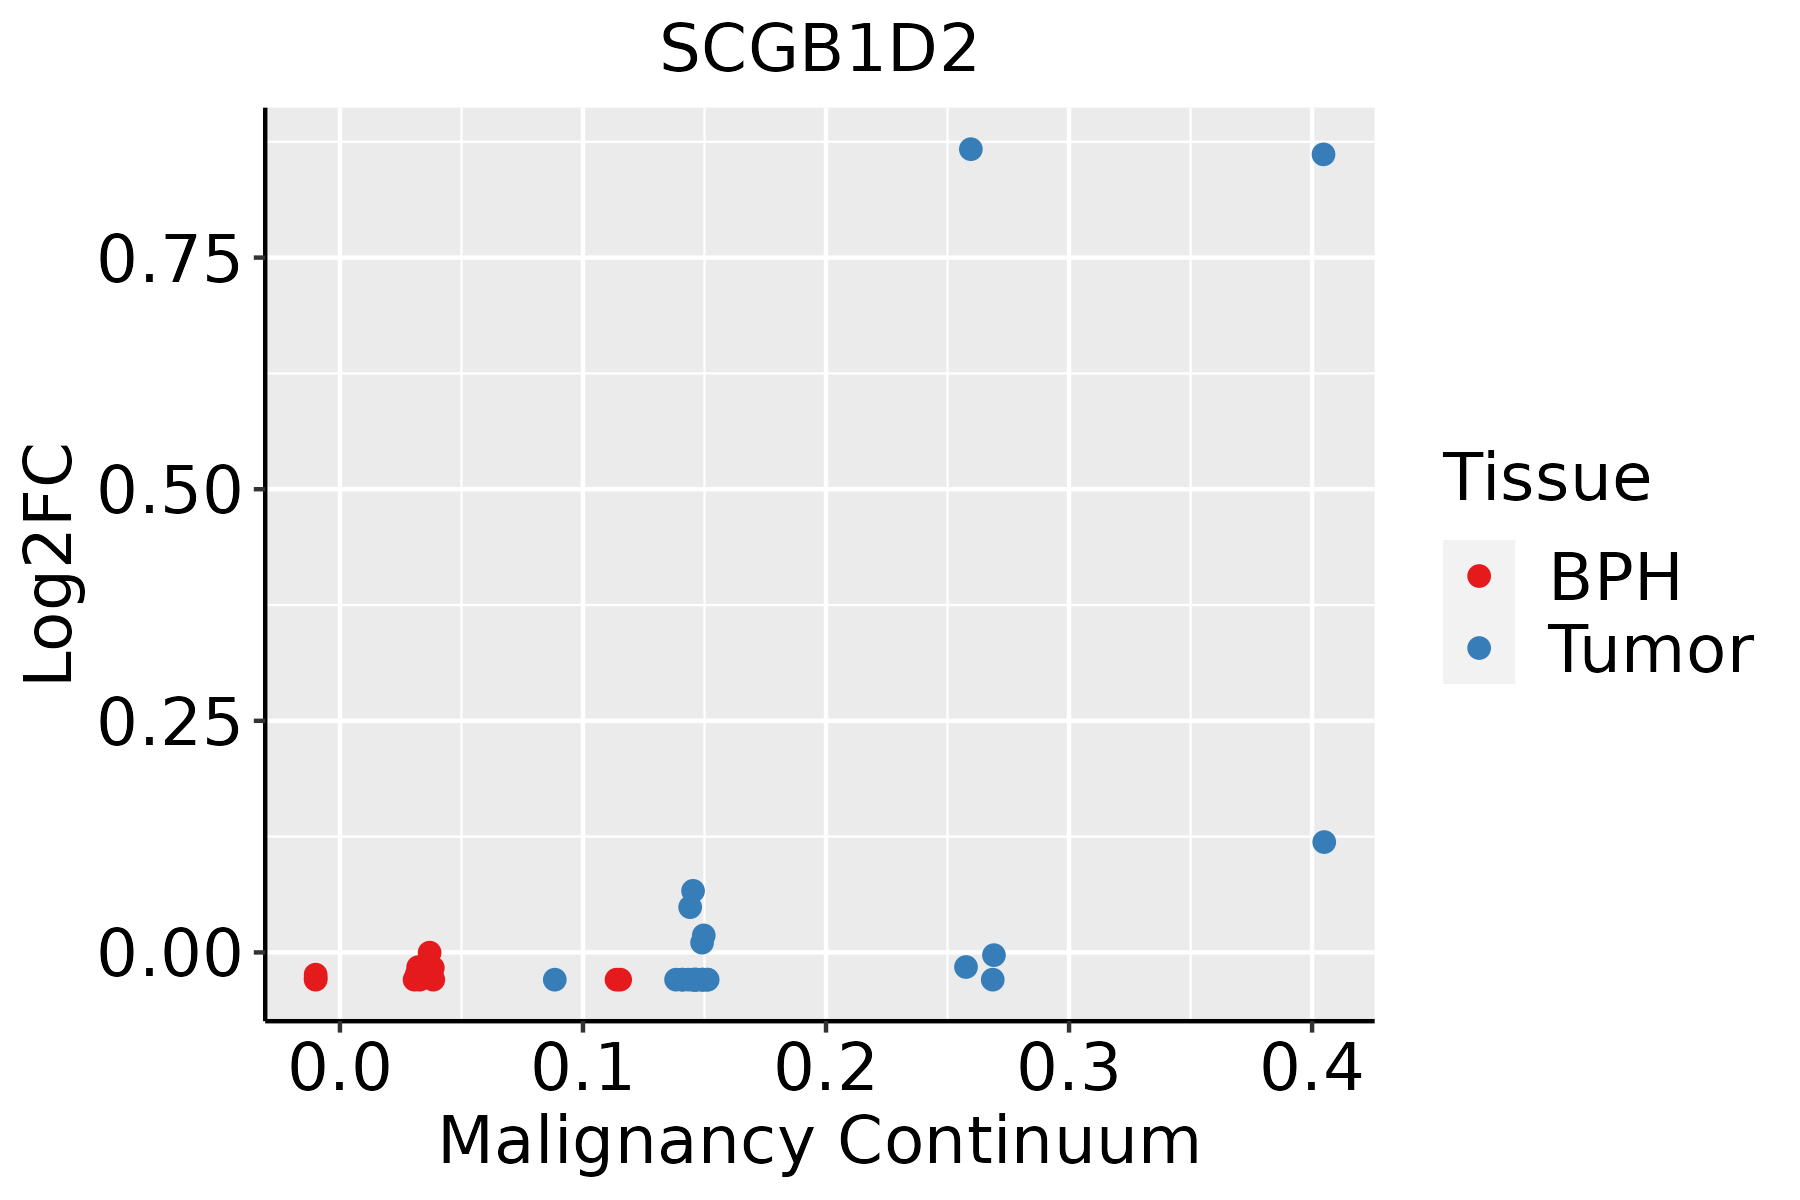 | BPH: Benign Prostatic Hyperplasia |
| ∗log2FC in expression of this searched gene in stem-like cells from each diseased tissue sample relative to stem-like cells in normal samples in each tissue plotted against the malignancy continuum. Samples are colored based on if they are from different disease stage. |
Top |
Malignant transformation related pathway analysis |
| Find out the enriched GO biological processes and KEGG pathways involved in transition from healthy to precancer to cancer |
| Tissue | Disease Stage | Enriched GO biological Processes |
| Colorectum | AD |  |
| Colorectum | SER |  |
| Colorectum | MSS |  |
| Colorectum | MSI-H |  |
| Colorectum | FAP |  |
| ∗Top 15 enriched GO BP terms are showed in the bar plot of each disease state in each tissue. Each row represents a significant GO biological process which is colored according to the -log10(p.adjust). |
| Page: 1 2 3 4 5 6 7 8 9 |
| GO ID | Tissue | Disease Stage | Description | Gene Ratio | Bg Ratio | pvalue | p.adjust | Count |
| Page: 1 |
| Pathway ID | Tissue | Disease Stage | Description | Gene Ratio | Bg Ratio | pvalue | p.adjust | qvalue | Count |
| Page: 1 |
Top |
Cell-cell communication analysis |
| Identification of potential cell-cell interactions between two cell types and their ligand-receptor pairs for different disease states |
| Ligand | Receptor | LRpair | Pathway | Tissue | Disease Stage |
| Page: 1 |
Top |
Single-cell gene regulatory network inference analysis |
| Find out the significant the regulons (TFs) and the target genes of each regulon across cell types for different disease states |
| TF | Cell Type | Tissue | Disease Stage | Target Gene | RSS | Regulon Activity |
| ∗The dot plots of a searched regulon are shown for all cell subpopulations in each disease state of each tissue based on the regulon specific score inferred using pySCENIC and by calculating the average expression. |
| Page: 1 |
Top |
Somatic mutation of malignant transformation related genes |
| Annotation of somatic variants for genes involved in malignant transformation |
| Hugo Symbol | Variant Class | Variant Classification | dbSNP RS | HGVSc | HGVSp | HGVSp Short | SWISSPROT | BIOTYPE | SIFT | PolyPhen | Tumor Sample Barcode | Tissue | Histology | Sex | Age | Stage | Therapy Types | Drugs | Outcome |
| SCGB1D2 | SNV | Missense_Mutation | c.97G>C | p.Asp33His | p.D33H | O95969 | protein_coding | tolerated(0.12) | benign(0.044) | TCGA-IR-A3LA-01 | Cervix | cervical & endocervical cancer | Female | <65 | I/II | Chemotherapy | cisplatin | CR | |
| SCGB1D2 | SNV | Missense_Mutation | novel | c.236N>G | p.Glu79Gly | p.E79G | O95969 | protein_coding | tolerated(0.17) | benign(0.001) | TCGA-AG-3892-01 | Colorectum | rectum adenocarcinoma | Female | <65 | I/II | Unknown | Unknown | SD |
| SCGB1D2 | deletion | Frame_Shift_Del | c.55+1delG | O95969 | protein_coding | TCGA-AF-6655-01 | Colorectum | rectum adenocarcinoma | Male | >=65 | III/IV | Unknown | Unknown | SD | |||||
| SCGB1D2 | SNV | Missense_Mutation | c.167N>C | p.Val56Ala | p.V56A | O95969 | protein_coding | tolerated(0.08) | benign(0.251) | TCGA-AP-A056-01 | Endometrium | uterine corpus endometrioid carcinoma | Female | <65 | I/II | Unknown | Unknown | SD | |
| SCGB1D2 | SNV | Missense_Mutation | c.110T>G | p.Ile37Ser | p.I37S | O95969 | protein_coding | tolerated(0.79) | benign(0.01) | TCGA-B5-A0K9-01 | Endometrium | uterine corpus endometrioid carcinoma | Female | >=65 | I/II | Unknown | Unknown | SD | |
| SCGB1D2 | SNV | Missense_Mutation | rs373290916 | c.233C>T | p.Ala78Val | p.A78V | O95969 | protein_coding | tolerated(0.29) | possibly_damaging(0.519) | TCGA-EO-A22U-01 | Endometrium | uterine corpus endometrioid carcinoma | Female | >=65 | I/II | Unknown | Unknown | SD |
| SCGB1D2 | SNV | Missense_Mutation | novel | c.136N>A | p.Leu46Ile | p.L46I | O95969 | protein_coding | tolerated(0.17) | probably_damaging(0.912) | TCGA-EO-A3AV-01 | Endometrium | uterine corpus endometrioid carcinoma | Female | <65 | III/IV | Chemotherapy | carboplatin | CR |
| SCGB1D2 | SNV | Missense_Mutation | novel | c.247N>C | p.Lys83Gln | p.K83Q | O95969 | protein_coding | tolerated(0.12) | possibly_damaging(0.589) | TCGA-DD-AAE6-01 | Liver | liver hepatocellular carcinoma | Female | <65 | I/II | Unknown | Unknown | PD |
| SCGB1D2 | SNV | Missense_Mutation | c.62N>A | p.Ala21Asp | p.A21D | O95969 | protein_coding | deleterious(0) | probably_damaging(0.999) | TCGA-50-6594-01 | Lung | lung adenocarcinoma | Female | >=65 | III/IV | Unknown | Unknown | PD | |
| SCGB1D2 | SNV | Missense_Mutation | c.204N>C | p.Gln68His | p.Q68H | O95969 | protein_coding | deleterious(0.01) | probably_damaging(0.956) | TCGA-86-A4JF-01 | Lung | lung adenocarcinoma | Male | <65 | I/II | Chemotherapy | unknown | PD |
| Page: 1 2 |
Top |
Related drugs of malignant transformation related genes |
| Identification of chemicals and drugs interact with genes involved in malignant transfromation |
| (DGIdb 4.0) |
| Entrez ID | Symbol | Category | Interaction Types | Drug Claim Name | Drug Name | PMIDs |
| Page: 1 |

Copyright 2023-Present -The University of Texas Health Science Center at Houston |