
|
|||||
|
 | |
| |
| |
| |
| |
| |
|
Gene: SCG5 |
Gene summary for SCG5 |
| Gene information | Species | Human | Gene symbol | SCG5 | Gene ID | 6447 |
| Gene name | secretogranin V | |
| Gene Alias | 7B2 | |
| Cytomap | 15q13.3 | |
| Gene Type | protein-coding | GO ID | GO:0006508 | UniProtAcc | A0A024R9I1 |
Top |
Malignant transformation analysis |
| Identification of the aberrant gene expression in precancerous and cancerous lesions by comparing the gene expression of stem-like cells in diseased tissues with normal stem cells |
| Entrez ID | Symbol | Replicates | Species | Organ | Tissue | Adj P-value | Log2FC | Malignancy |
| 6447 | SCG5 | C04 | Human | Oral cavity | OSCC | 2.26e-15 | 1.03e+00 | 0.2633 |
| 6447 | SCG5 | C21 | Human | Oral cavity | OSCC | 6.13e-41 | 1.63e+00 | 0.2678 |
| 6447 | SCG5 | C30 | Human | Oral cavity | OSCC | 8.19e-05 | 3.51e-01 | 0.3055 |
| 6447 | SCG5 | C51 | Human | Oral cavity | OSCC | 1.79e-02 | 4.12e-01 | 0.2674 |
| 6447 | SCG5 | HTA12-15-2 | Human | Pancreas | PDAC | 9.30e-16 | 1.29e+00 | 0.2315 |
| 6447 | SCG5 | HTA12-23-1 | Human | Pancreas | PDAC | 6.22e-08 | 9.02e-01 | 0.3405 |
| 6447 | SCG5 | HTA12-25-1 | Human | Pancreas | PDAC | 1.74e-06 | 7.76e-01 | 0.313 |
| 6447 | SCG5 | HTA12-26-1 | Human | Pancreas | PDAC | 5.28e-22 | 9.68e-01 | 0.3728 |
| 6447 | SCG5 | HTA12-29-1 | Human | Pancreas | PDAC | 3.95e-39 | 9.02e-01 | 0.3722 |
| 6447 | SCG5 | HTA12-9-1 | Human | Pancreas | PDAC | 1.10e-03 | 6.44e-01 | 0.1532 |
| 6447 | SCG5 | HTA12-9-3 | Human | Pancreas | PDAC | 3.59e-06 | 1.09e+00 | 0.2045 |
| 6447 | SCG5 | male-WTA | Human | Thyroid | PTC | 2.52e-15 | 1.17e-01 | 0.1037 |
| 6447 | SCG5 | PTC01 | Human | Thyroid | PTC | 2.39e-31 | 1.01e+00 | 0.1899 |
| 6447 | SCG5 | PTC05 | Human | Thyroid | PTC | 1.74e-25 | 1.58e+00 | 0.2065 |
| 6447 | SCG5 | PTC06 | Human | Thyroid | PTC | 9.86e-42 | 1.23e+00 | 0.2057 |
| 6447 | SCG5 | PTC07 | Human | Thyroid | PTC | 1.26e-86 | 1.77e+00 | 0.2044 |
| 6447 | SCG5 | ATC09 | Human | Thyroid | ATC | 2.27e-14 | 7.66e-01 | 0.2871 |
| 6447 | SCG5 | ATC11 | Human | Thyroid | ATC | 5.37e-09 | 1.24e+00 | 0.3386 |
| 6447 | SCG5 | ATC12 | Human | Thyroid | ATC | 6.00e-09 | 2.91e-01 | 0.34 |
| 6447 | SCG5 | ATC13 | Human | Thyroid | ATC | 3.29e-30 | 7.78e-01 | 0.34 |
| Page: 1 2 |
| Tissue | Expression Dynamics | Abbreviation |
| Oral Cavity |  | EOLP: Erosive Oral lichen planus |
| LP: leukoplakia | ||
| NEOLP: Non-erosive oral lichen planus | ||
| OSCC: Oral squamous cell carcinoma | ||
| Thyroid | 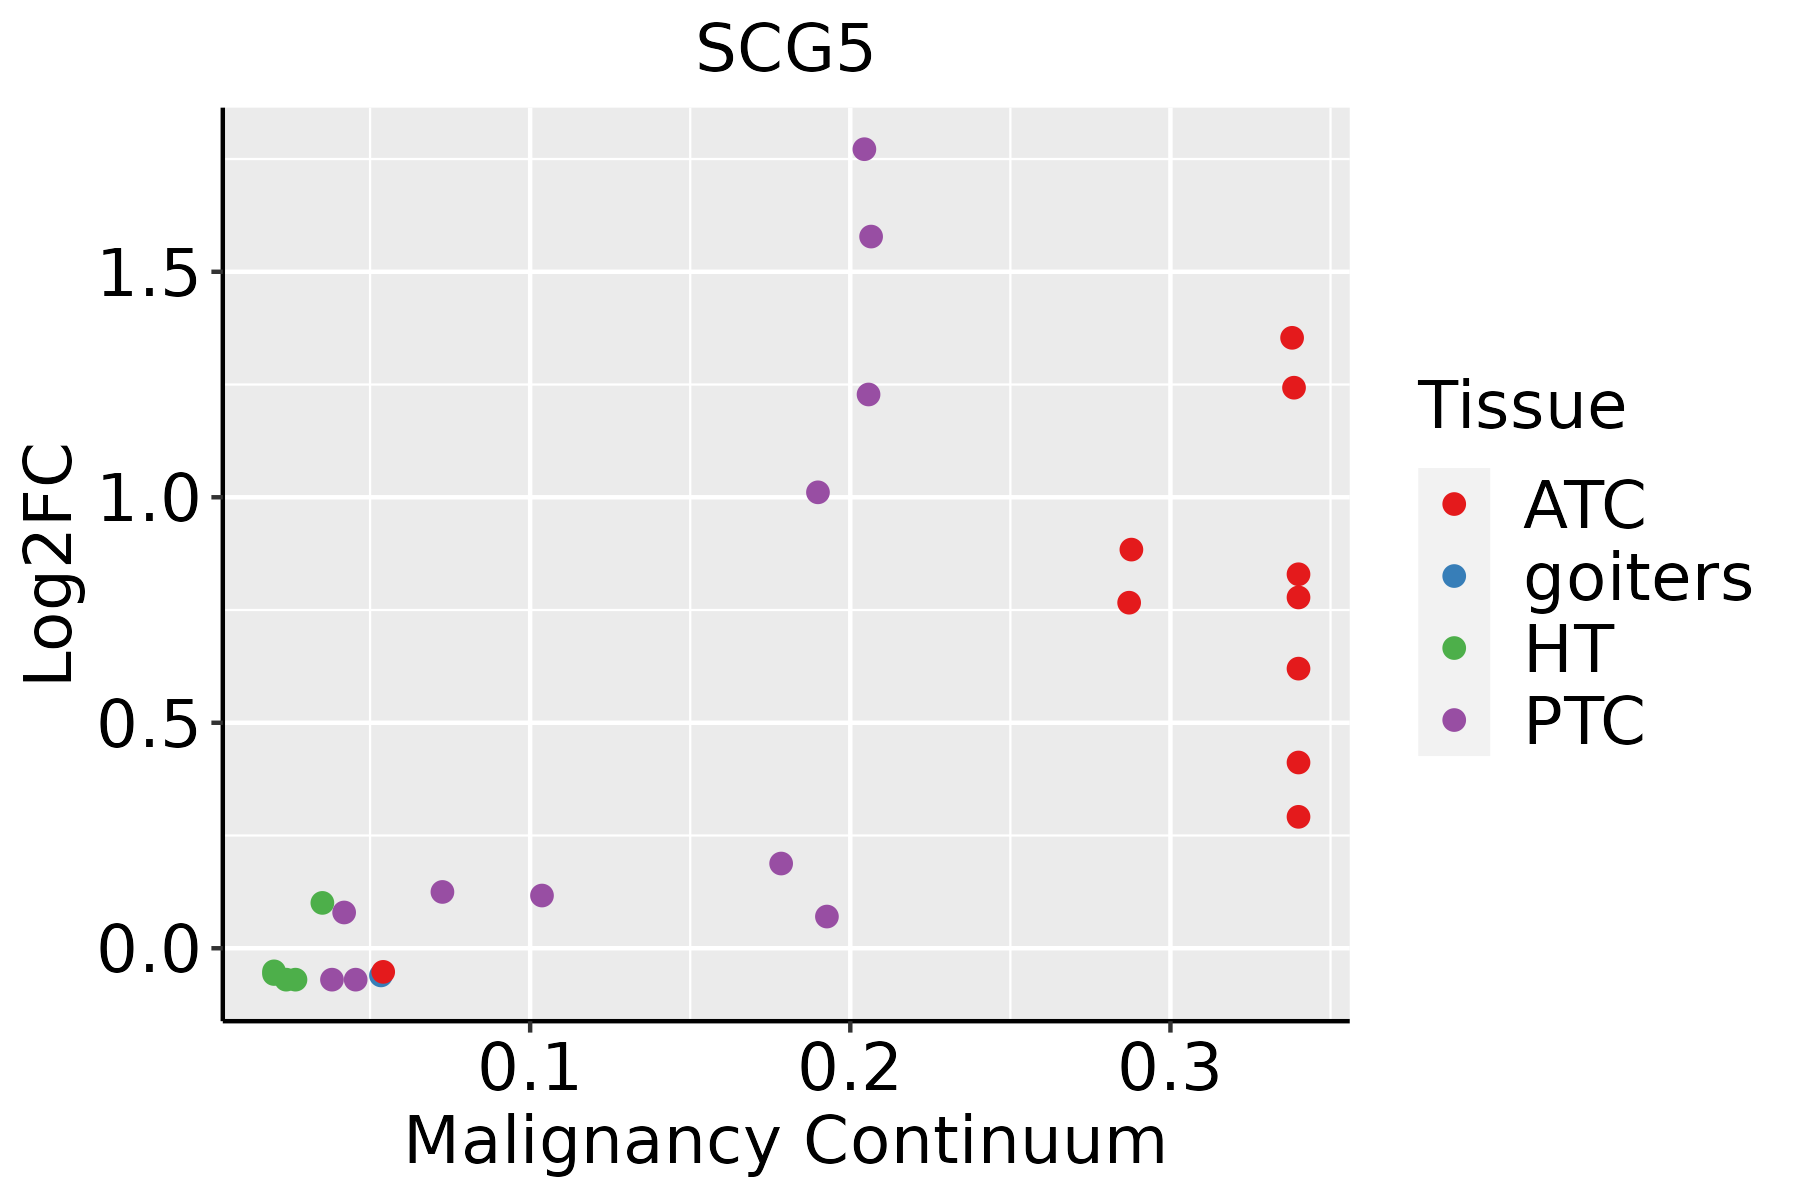 | ATC: Anaplastic thyroid cancer |
| HT: Hashimoto's thyroiditis | ||
| PTC: Papillary thyroid cancer |
| ∗log2FC in expression of this searched gene in stem-like cells from each diseased tissue sample relative to stem-like cells in normal samples in each tissue plotted against the malignancy continuum. Samples are colored based on if they are from different disease stage. |
Top |
Malignant transformation related pathway analysis |
| Find out the enriched GO biological processes and KEGG pathways involved in transition from healthy to precancer to cancer |
| Tissue | Disease Stage | Enriched GO biological Processes |
| Colorectum | AD |  |
| Colorectum | SER |  |
| Colorectum | MSS |  |
| Colorectum | MSI-H |  |
| Colorectum | FAP |  |
| ∗Top 15 enriched GO BP terms are showed in the bar plot of each disease state in each tissue. Each row represents a significant GO biological process which is colored according to the -log10(p.adjust). |
| Page: 1 2 3 4 5 6 7 8 9 |
| GO ID | Tissue | Disease Stage | Description | Gene Ratio | Bg Ratio | pvalue | p.adjust | Count |
| GO:005160410 | Oral cavity | OSCC | protein maturation | 170/7305 | 294/18723 | 3.97e-11 | 1.28e-09 | 170 |
| GO:00164856 | Oral cavity | OSCC | protein processing | 121/7305 | 225/18723 | 4.56e-06 | 5.23e-05 | 121 |
| GO:005160420 | Thyroid | PTC | protein maturation | 132/5968 | 294/18723 | 1.71e-06 | 2.39e-05 | 132 |
| GO:00164859 | Thyroid | PTC | protein processing | 95/5968 | 225/18723 | 6.60e-04 | 4.15e-03 | 95 |
| GO:0051604110 | Thyroid | ATC | protein maturation | 136/6293 | 294/18723 | 4.00e-06 | 4.42e-05 | 136 |
| GO:001648515 | Thyroid | ATC | protein processing | 100/6293 | 225/18723 | 4.39e-04 | 2.62e-03 | 100 |
| Page: 1 |
| Pathway ID | Tissue | Disease Stage | Description | Gene Ratio | Bg Ratio | pvalue | p.adjust | qvalue | Count |
| Page: 1 |
Top |
Cell-cell communication analysis |
| Identification of potential cell-cell interactions between two cell types and their ligand-receptor pairs for different disease states |
| Ligand | Receptor | LRpair | Pathway | Tissue | Disease Stage |
| Page: 1 |
Top |
Single-cell gene regulatory network inference analysis |
| Find out the significant the regulons (TFs) and the target genes of each regulon across cell types for different disease states |
| TF | Cell Type | Tissue | Disease Stage | Target Gene | RSS | Regulon Activity |
| ∗The dot plots of a searched regulon are shown for all cell subpopulations in each disease state of each tissue based on the regulon specific score inferred using pySCENIC and by calculating the average expression. |
| Page: 1 |
Top |
Somatic mutation of malignant transformation related genes |
| Annotation of somatic variants for genes involved in malignant transformation |
| Hugo Symbol | Variant Class | Variant Classification | dbSNP RS | HGVSc | HGVSp | HGVSp Short | SWISSPROT | BIOTYPE | SIFT | PolyPhen | Tumor Sample Barcode | Tissue | Histology | Sex | Age | Stage | Therapy Types | Drugs | Outcome |
| SCG5 | SNV | Missense_Mutation | novel | c.572N>C | p.Arg191Thr | p.R191T | P05408 | protein_coding | deleterious(0.03) | possibly_damaging(0.721) | TCGA-A7-A4SA-01 | Breast | breast invasive carcinoma | Female | <65 | I/II | Chemotherapy | doxorubicin | CR |
| SCG5 | SNV | Missense_Mutation | rs757352985 | c.539N>A | p.Arg180Gln | p.R180Q | P05408 | protein_coding | tolerated(0.12) | benign(0.005) | TCGA-BH-A1ES-06 | Breast | breast invasive carcinoma | Female | <65 | I/II | Unknown | Unknown | PD |
| SCG5 | SNV | Missense_Mutation | c.223N>A | p.Glu75Lys | p.E75K | P05408 | protein_coding | tolerated(0.11) | benign(0.433) | TCGA-C8-A12P-01 | Breast | breast invasive carcinoma | Female | <65 | I/II | Unknown | Unknown | SD | |
| SCG5 | deletion | Frame_Shift_Del | novel | c.503delN | p.Tyr169ThrfsTer4 | p.Y169Tfs*4 | P05408 | protein_coding | TCGA-D8-A27V-01 | Breast | breast invasive carcinoma | Female | <65 | I/II | Hormone Therapy | tamoxiphen | SD | ||
| SCG5 | deletion | Frame_Shift_Del | novel | c.23delN | p.Met9CysfsTer58 | p.M9Cfs*58 | P05408 | protein_coding | TCGA-EW-A2FV-01 | Breast | breast invasive carcinoma | Female | <65 | III/IV | Chemotherapy | docetaxel | SD | ||
| SCG5 | SNV | Missense_Mutation | novel | c.130N>T | p.Leu44Phe | p.L44F | P05408 | protein_coding | tolerated_low_confidence(0.07) | probably_damaging(0.969) | TCGA-2W-A8YY-01 | Cervix | cervical & endocervical cancer | Female | <65 | I/II | Chemotherapy | cisplatin | CR |
| SCG5 | SNV | Missense_Mutation | c.470N>G | p.Tyr157Cys | p.Y157C | P05408 | protein_coding | tolerated(0.11) | probably_damaging(0.934) | TCGA-2W-A8YY-01 | Cervix | cervical & endocervical cancer | Female | <65 | I/II | Chemotherapy | cisplatin | CR | |
| SCG5 | SNV | Missense_Mutation | novel | c.526N>A | p.Glu176Lys | p.E176K | P05408 | protein_coding | tolerated(0.46) | benign(0.014) | TCGA-JW-A5VL-01 | Cervix | cervical & endocervical cancer | Female | <65 | I/II | Unknown | Unknown | SD |
| SCG5 | insertion | Frame_Shift_Ins | novel | c.223_224insTC | p.Glu75ValfsTer25 | p.E75Vfs*25 | P05408 | protein_coding | TCGA-AM-5820-01 | Colorectum | colon adenocarcinoma | Female | <65 | I/II | Unknown | Unknown | SD | ||
| SCG5 | SNV | Missense_Mutation | c.253N>G | p.Leu85Val | p.L85V | P05408 | protein_coding | deleterious(0) | probably_damaging(0.998) | TCGA-AP-A056-01 | Endometrium | uterine corpus endometrioid carcinoma | Female | <65 | I/II | Unknown | Unknown | SD |
| Page: 1 2 3 |
Top |
Related drugs of malignant transformation related genes |
| Identification of chemicals and drugs interact with genes involved in malignant transfromation |
| (DGIdb 4.0) |
| Entrez ID | Symbol | Category | Interaction Types | Drug Claim Name | Drug Name | PMIDs |
| 6447 | SCG5 | CLINICALLY ACTIONABLE, DRUGGABLE GENOME | CAPSAICIN | CAPSAICIN | 3858706 | |
| 6447 | SCG5 | CLINICALLY ACTIONABLE, DRUGGABLE GENOME | TGFBETA1 | 14709802 | ||
| 6447 | SCG5 | CLINICALLY ACTIONABLE, DRUGGABLE GENOME | HISTONE DEACETYLASE INHIBITOR | 14709802 |
| Page: 1 |

Copyright 2023-Present -The University of Texas Health Science Center at Houston |