
|
|||||
|
 | |
| |
| |
| |
| |
| |
|
Gene: SCFD2 |
Gene summary for SCFD2 |
| Gene information | Species | Human | Gene symbol | SCFD2 | Gene ID | 152579 |
| Gene name | sec1 family domain containing 2 | |
| Gene Alias | STXBP1L1 | |
| Cytomap | 4q12 | |
| Gene Type | protein-coding | GO ID | GO:0006810 | UniProtAcc | Q8WU76 |
Top |
Malignant transformation analysis |
| Identification of the aberrant gene expression in precancerous and cancerous lesions by comparing the gene expression of stem-like cells in diseased tissues with normal stem cells |
| Entrez ID | Symbol | Replicates | Species | Organ | Tissue | Adj P-value | Log2FC | Malignancy |
| 152579 | SCFD2 | CCI_1 | Human | Cervix | CC | 1.71e-09 | 7.42e-01 | 0.528 |
| 152579 | SCFD2 | CCI_3 | Human | Cervix | CC | 2.61e-05 | 5.12e-01 | 0.516 |
| 152579 | SCFD2 | HTA11_3410_2000001011 | Human | Colorectum | AD | 4.48e-14 | -5.93e-01 | 0.0155 |
| 152579 | SCFD2 | HTA11_2487_2000001011 | Human | Colorectum | SER | 4.48e-02 | -4.87e-01 | -0.1808 |
| 152579 | SCFD2 | HTA11_2951_2000001011 | Human | Colorectum | AD | 1.28e-02 | -7.19e-01 | 0.0216 |
| 152579 | SCFD2 | HTA11_3361_2000001011 | Human | Colorectum | AD | 1.55e-04 | -5.34e-01 | -0.1207 |
| 152579 | SCFD2 | HTA11_696_2000001011 | Human | Colorectum | AD | 4.26e-10 | -4.73e-01 | -0.1464 |
| 152579 | SCFD2 | HTA11_866_2000001011 | Human | Colorectum | AD | 7.03e-10 | -4.60e-01 | -0.1001 |
| 152579 | SCFD2 | HTA11_5212_2000001011 | Human | Colorectum | AD | 3.09e-04 | -7.85e-01 | -0.2061 |
| 152579 | SCFD2 | HTA11_866_3004761011 | Human | Colorectum | AD | 1.29e-11 | -5.85e-01 | 0.096 |
| 152579 | SCFD2 | HTA11_8622_2000001021 | Human | Colorectum | SER | 1.82e-03 | -7.12e-01 | 0.0528 |
| 152579 | SCFD2 | HTA11_10711_2000001011 | Human | Colorectum | AD | 7.37e-07 | -5.71e-01 | 0.0338 |
| 152579 | SCFD2 | HTA11_7696_3000711011 | Human | Colorectum | AD | 3.12e-07 | -4.53e-01 | 0.0674 |
| 152579 | SCFD2 | HTA11_99999970781_79442 | Human | Colorectum | MSS | 3.36e-17 | -4.76e-01 | 0.294 |
| 152579 | SCFD2 | HTA11_99999973899_84307 | Human | Colorectum | MSS | 1.84e-04 | -6.91e-01 | 0.2585 |
| 152579 | SCFD2 | HTA11_99999974143_84620 | Human | Colorectum | MSS | 6.23e-12 | -5.53e-01 | 0.3005 |
| 152579 | SCFD2 | A001-C-207 | Human | Colorectum | FAP | 1.33e-03 | -3.55e-01 | 0.1278 |
| 152579 | SCFD2 | A015-C-203 | Human | Colorectum | FAP | 3.91e-31 | -6.18e-01 | -0.1294 |
| 152579 | SCFD2 | A015-C-204 | Human | Colorectum | FAP | 3.41e-08 | -4.52e-01 | -0.0228 |
| 152579 | SCFD2 | A014-C-040 | Human | Colorectum | FAP | 4.39e-06 | -5.80e-01 | -0.1184 |
| Page: 1 2 3 4 |
| Tissue | Expression Dynamics | Abbreviation |
| Cervix | 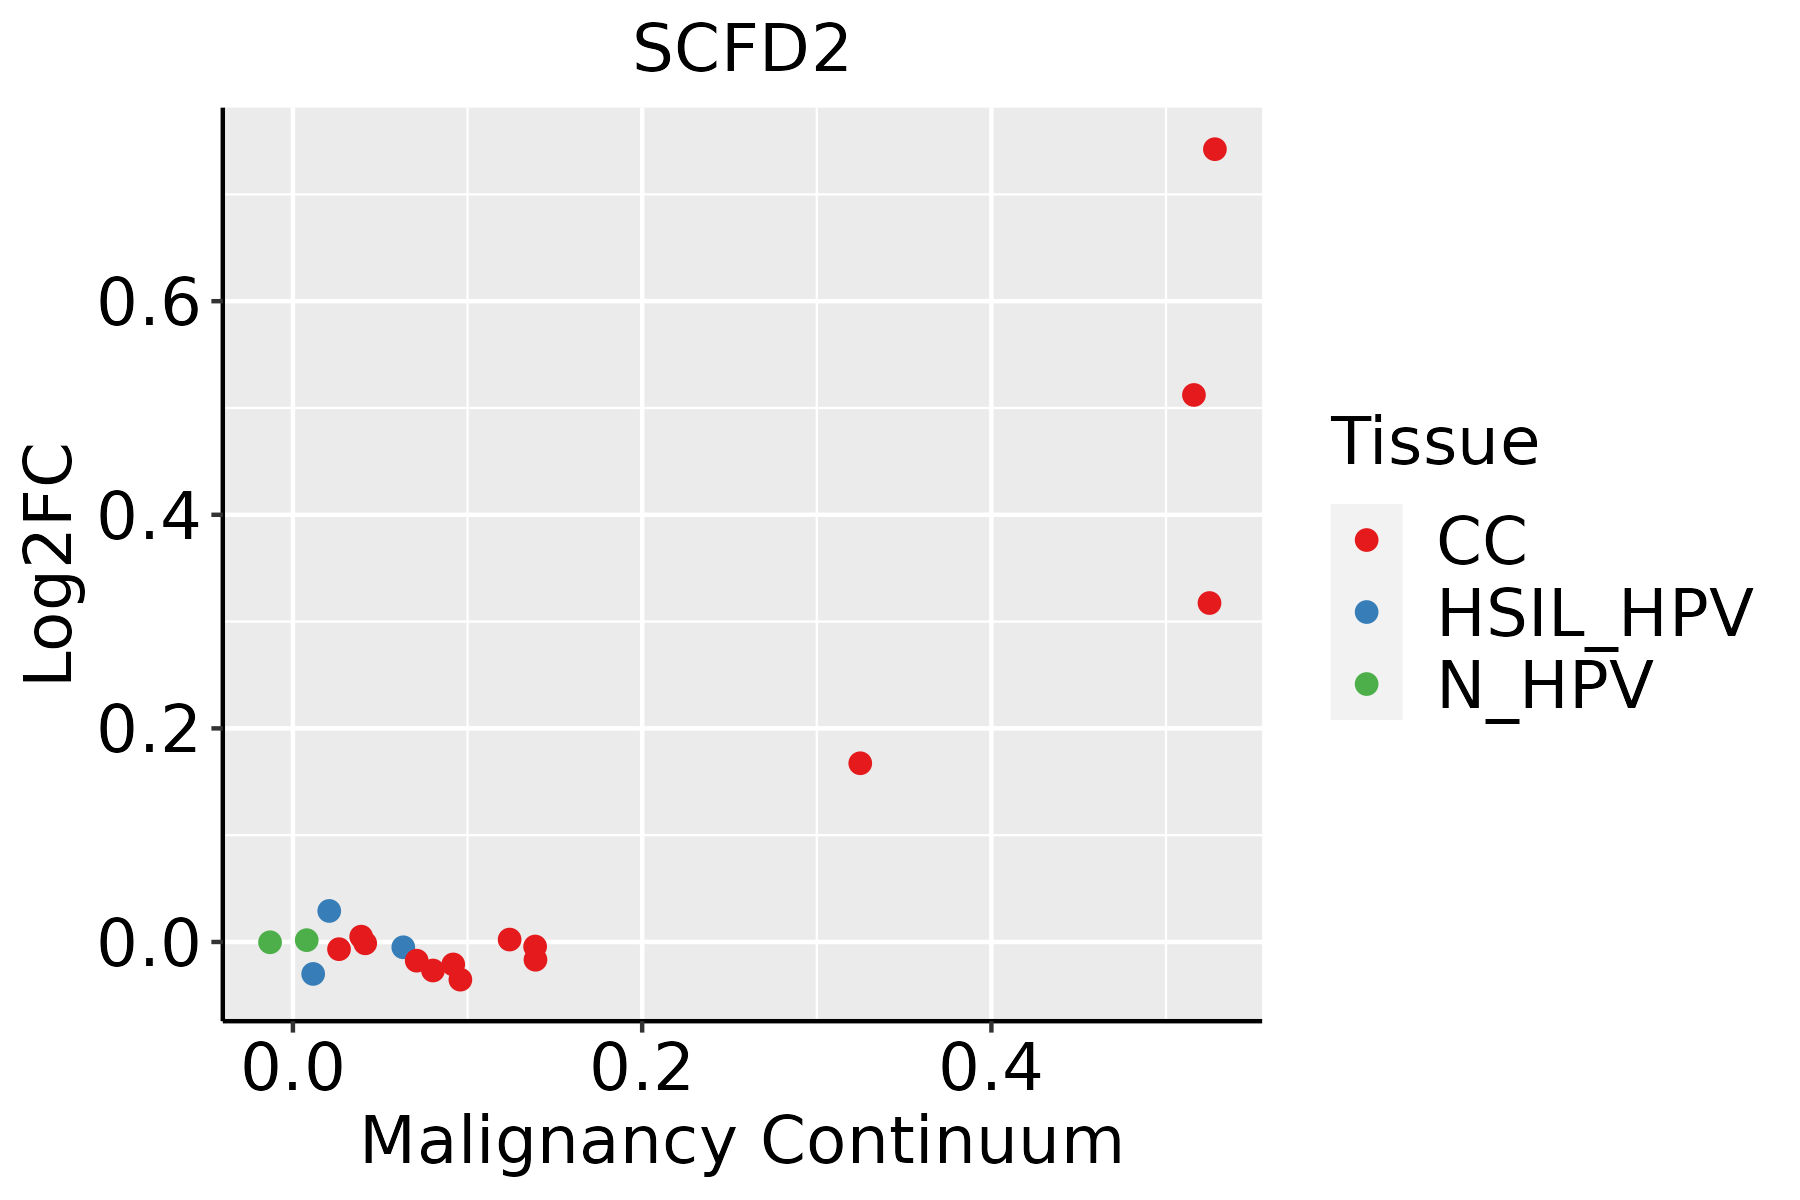 | CC: Cervix cancer |
| HSIL_HPV: HPV-infected high-grade squamous intraepithelial lesions | ||
| N_HPV: HPV-infected normal cervix | ||
| Colorectum (GSE201348) |  | FAP: Familial adenomatous polyposis |
| CRC: Colorectal cancer | ||
| Colorectum (HTA11) |  | AD: Adenomas |
| SER: Sessile serrated lesions | ||
| MSI-H: Microsatellite-high colorectal cancer | ||
| MSS: Microsatellite stable colorectal cancer | ||
| Endometrium | 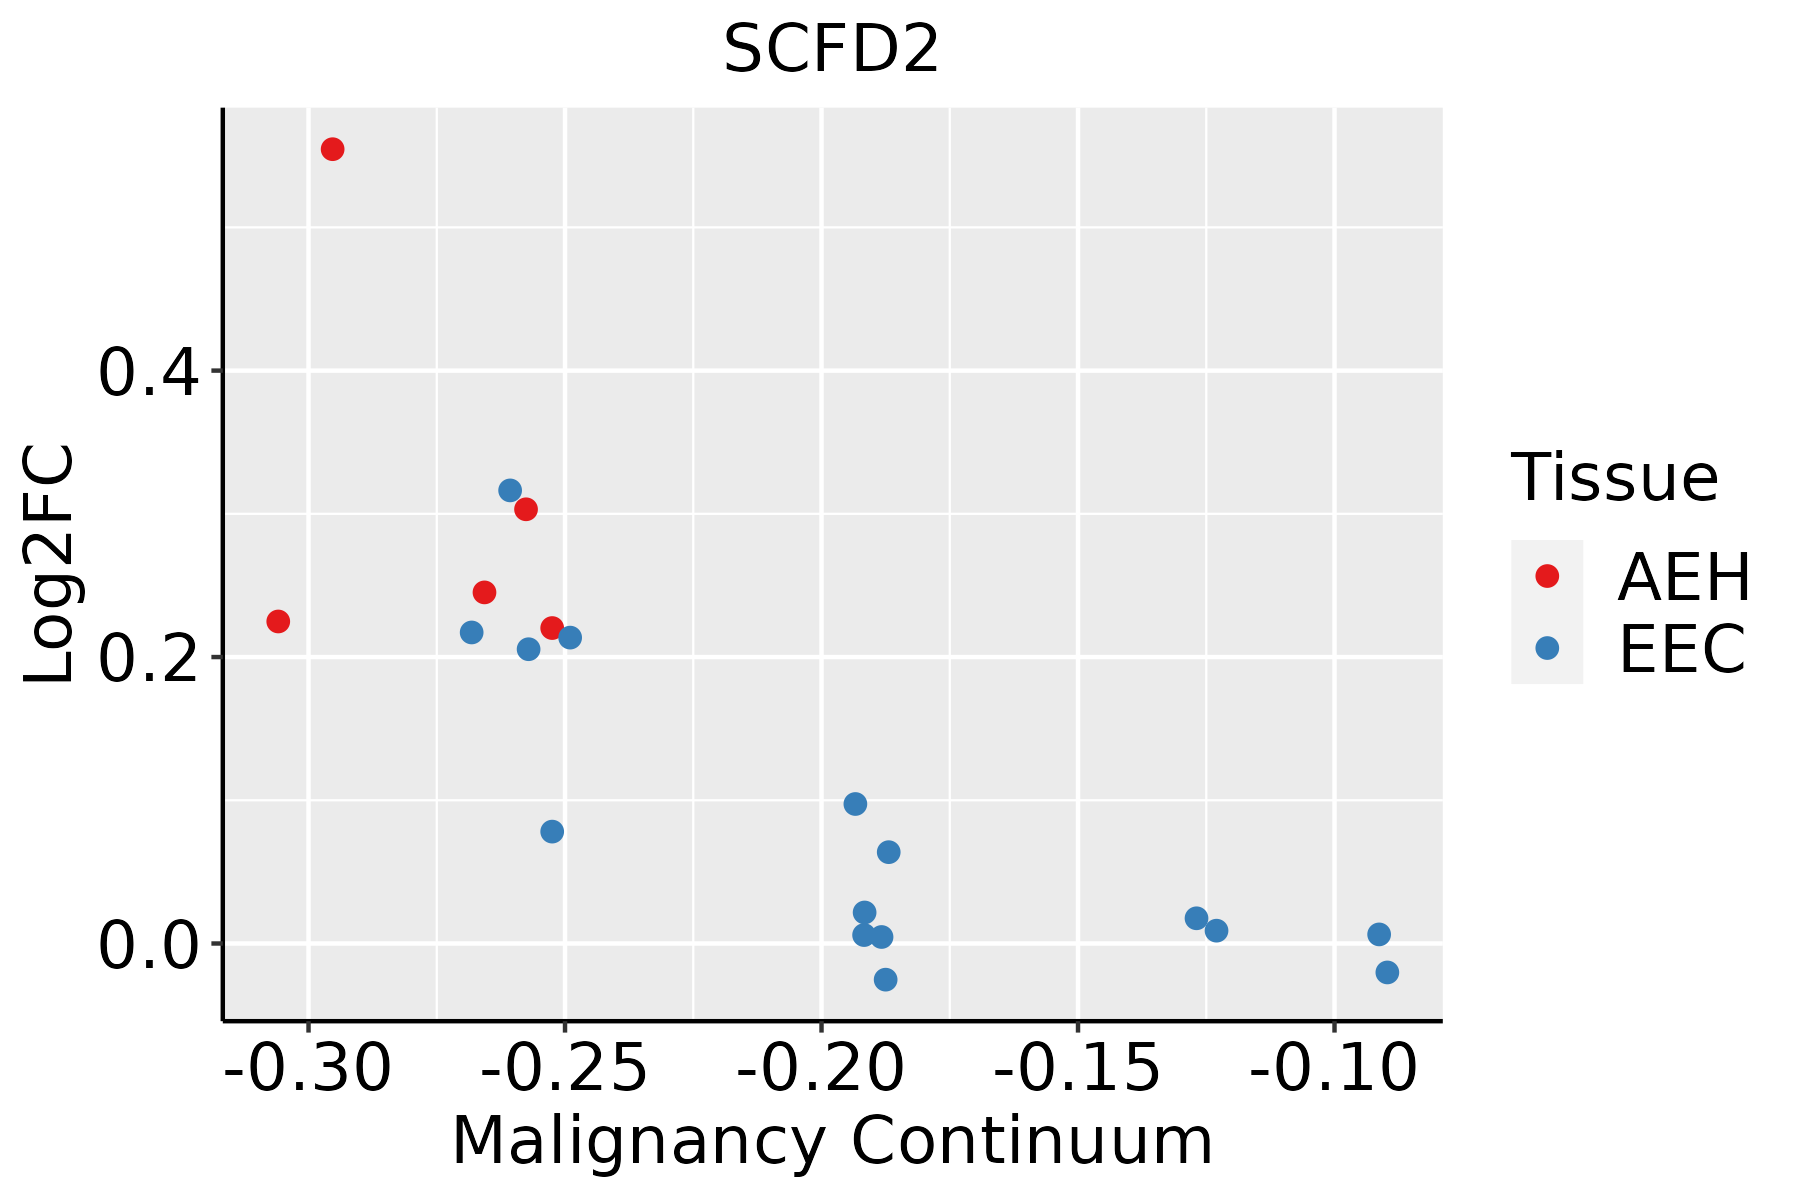 | AEH: Atypical endometrial hyperplasia |
| EEC: Endometrioid Cancer | ||
| Lung | 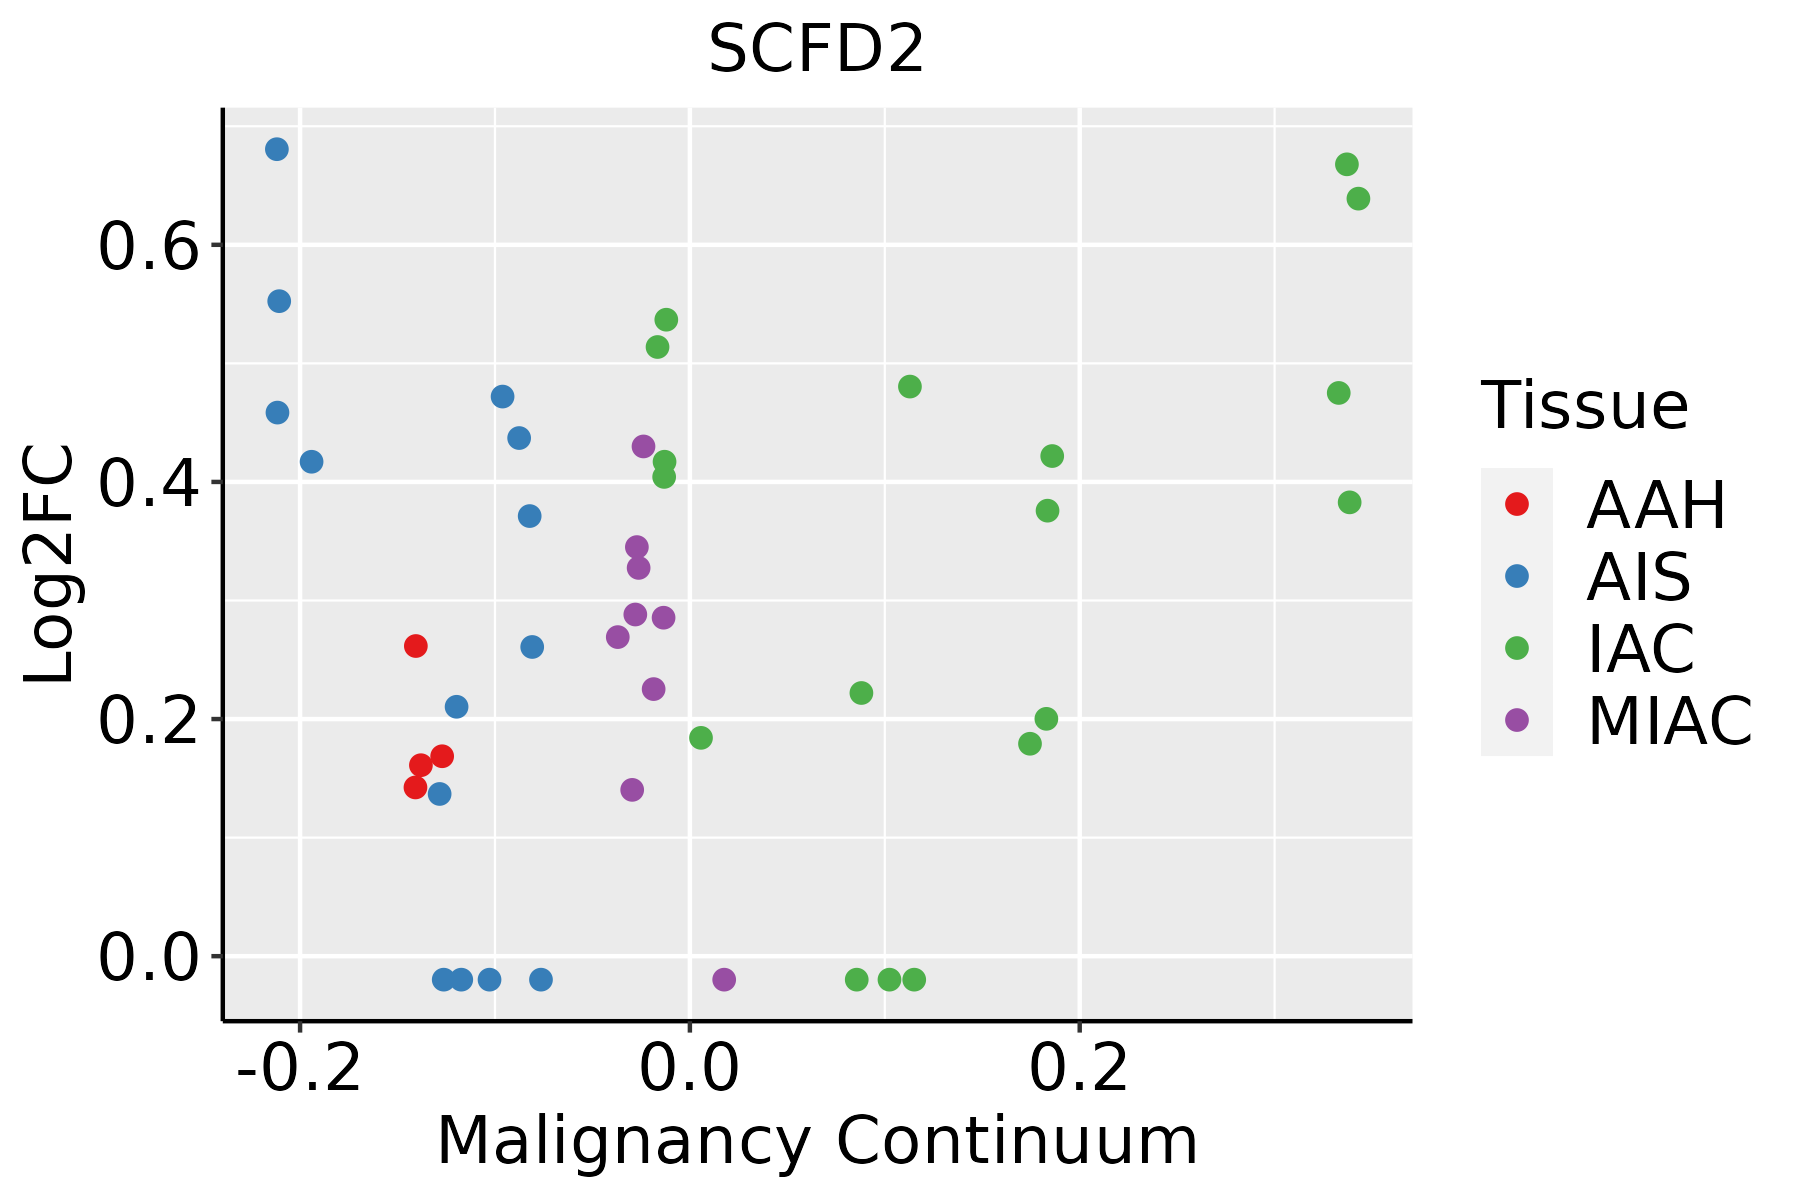 | AAH: Atypical adenomatous hyperplasia |
| AIS: Adenocarcinoma in situ | ||
| IAC: Invasive lung adenocarcinoma | ||
| MIA: Minimally invasive adenocarcinoma | ||
| Thyroid |  | ATC: Anaplastic thyroid cancer |
| HT: Hashimoto's thyroiditis | ||
| PTC: Papillary thyroid cancer |
| ∗log2FC in expression of this searched gene in stem-like cells from each diseased tissue sample relative to stem-like cells in normal samples in each tissue plotted against the malignancy continuum. Samples are colored based on if they are from different disease stage. |
Top |
Malignant transformation related pathway analysis |
| Find out the enriched GO biological processes and KEGG pathways involved in transition from healthy to precancer to cancer |
| Tissue | Disease Stage | Enriched GO biological Processes |
| Colorectum | AD |  |
| Colorectum | SER |  |
| Colorectum | MSS |  |
| Colorectum | MSI-H |  |
| Colorectum | FAP |  |
| ∗Top 15 enriched GO BP terms are showed in the bar plot of each disease state in each tissue. Each row represents a significant GO biological process which is colored according to the -log10(p.adjust). |
| Page: 1 2 3 4 5 6 7 8 9 |
| GO ID | Tissue | Disease Stage | Description | Gene Ratio | Bg Ratio | pvalue | p.adjust | Count |
| GO:00068873 | Cervix | CC | exocytosis | 59/2311 | 352/18723 | 8.74e-03 | 4.48e-02 | 59 |
| GO:0022406 | Colorectum | AD | membrane docking | 31/3918 | 86/18723 | 8.67e-04 | 8.45e-03 | 31 |
| GO:0140056 | Colorectum | AD | organelle localization by membrane tethering | 28/3918 | 77/18723 | 1.29e-03 | 1.14e-02 | 28 |
| GO:0006887 | Colorectum | AD | exocytosis | 96/3918 | 352/18723 | 2.48e-03 | 1.90e-02 | 96 |
| GO:00224061 | Colorectum | SER | membrane docking | 25/2897 | 86/18723 | 9.88e-04 | 1.17e-02 | 25 |
| GO:00068871 | Colorectum | SER | exocytosis | 75/2897 | 352/18723 | 2.05e-03 | 2.03e-02 | 75 |
| GO:01400561 | Colorectum | SER | organelle localization by membrane tethering | 22/2897 | 77/18723 | 2.46e-03 | 2.32e-02 | 22 |
| GO:00224062 | Colorectum | MSS | membrane docking | 28/3467 | 86/18723 | 1.27e-03 | 1.21e-02 | 28 |
| GO:01400562 | Colorectum | MSS | organelle localization by membrane tethering | 25/3467 | 77/18723 | 2.34e-03 | 1.91e-02 | 25 |
| GO:00224063 | Colorectum | FAP | membrane docking | 22/2622 | 86/18723 | 3.11e-03 | 2.33e-02 | 22 |
| GO:01400563 | Colorectum | FAP | organelle localization by membrane tethering | 19/2622 | 77/18723 | 8.67e-03 | 4.98e-02 | 19 |
| GO:00224064 | Colorectum | CRC | membrane docking | 20/2078 | 86/18723 | 9.78e-04 | 1.17e-02 | 20 |
| GO:01400564 | Colorectum | CRC | organelle localization by membrane tethering | 17/2078 | 77/18723 | 4.05e-03 | 3.35e-02 | 17 |
| GO:00068872 | Colorectum | CRC | exocytosis | 55/2078 | 352/18723 | 5.62e-03 | 4.24e-02 | 55 |
| GO:00224066 | Lung | IAC | membrane docking | 18/2061 | 86/18723 | 5.26e-03 | 3.99e-02 | 18 |
| GO:002240615 | Thyroid | PTC | membrane docking | 48/5968 | 86/18723 | 3.72e-06 | 4.73e-05 | 48 |
| GO:01400569 | Thyroid | PTC | organelle localization by membrane tethering | 40/5968 | 77/18723 | 1.98e-04 | 1.49e-03 | 40 |
| GO:00482783 | Thyroid | PTC | vesicle docking | 28/5968 | 59/18723 | 8.85e-03 | 3.68e-02 | 28 |
| GO:002240622 | Thyroid | ATC | membrane docking | 49/6293 | 86/18723 | 7.13e-06 | 7.34e-05 | 49 |
| GO:014005613 | Thyroid | ATC | organelle localization by membrane tethering | 41/6293 | 77/18723 | 2.97e-04 | 1.88e-03 | 41 |
| Page: 1 2 |
| Pathway ID | Tissue | Disease Stage | Description | Gene Ratio | Bg Ratio | pvalue | p.adjust | qvalue | Count |
| Page: 1 |
Top |
Cell-cell communication analysis |
| Identification of potential cell-cell interactions between two cell types and their ligand-receptor pairs for different disease states |
| Ligand | Receptor | LRpair | Pathway | Tissue | Disease Stage |
| Page: 1 |
Top |
Single-cell gene regulatory network inference analysis |
| Find out the significant the regulons (TFs) and the target genes of each regulon across cell types for different disease states |
| TF | Cell Type | Tissue | Disease Stage | Target Gene | RSS | Regulon Activity |
| ∗The dot plots of a searched regulon are shown for all cell subpopulations in each disease state of each tissue based on the regulon specific score inferred using pySCENIC and by calculating the average expression. |
| Page: 1 |
Top |
Somatic mutation of malignant transformation related genes |
| Annotation of somatic variants for genes involved in malignant transformation |
| Hugo Symbol | Variant Class | Variant Classification | dbSNP RS | HGVSc | HGVSp | HGVSp Short | SWISSPROT | BIOTYPE | SIFT | PolyPhen | Tumor Sample Barcode | Tissue | Histology | Sex | Age | Stage | Therapy Types | Drugs | Outcome |
| SCFD2 | SNV | Missense_Mutation | c.767C>G | p.Ala256Gly | p.A256G | Q8WU76 | protein_coding | deleterious(0) | possibly_damaging(0.609) | TCGA-A2-A0CW-01 | Breast | breast invasive carcinoma | Female | >=65 | I/II | Hormone Therapy | anastrozole | SD | |
| SCFD2 | SNV | Missense_Mutation | c.771N>C | p.Lys257Asn | p.K257N | Q8WU76 | protein_coding | deleterious(0) | probably_damaging(0.963) | TCGA-AC-A23H-01 | Breast | breast invasive carcinoma | Female | >=65 | I/II | Unknown | Unknown | PD | |
| SCFD2 | SNV | Missense_Mutation | c.877N>T | p.Ile293Phe | p.I293F | Q8WU76 | protein_coding | deleterious(0) | benign(0.034) | TCGA-AR-A0TZ-01 | Breast | breast invasive carcinoma | Female | <65 | III/IV | Unspecific | Doxorubicin | PD | |
| SCFD2 | SNV | Missense_Mutation | c.1861N>T | p.Ser621Cys | p.S621C | Q8WU76 | protein_coding | deleterious(0.01) | possibly_damaging(0.873) | TCGA-E2-A158-01 | Breast | breast invasive carcinoma | Female | <65 | I/II | Chemotherapy | arimidex | SD | |
| SCFD2 | insertion | Frame_Shift_Ins | novel | c.179_180insT | p.Glu60AspfsTer57 | p.E60Dfs*57 | Q8WU76 | protein_coding | TCGA-A2-A0CU-01 | Breast | breast invasive carcinoma | Female | >=65 | I/II | Hormone Therapy | tamoxiphen | SD | ||
| SCFD2 | insertion | Frame_Shift_Ins | novel | c.178_179insGAAGGAAAACTACTGCACAAGAAAACATAAA | p.Glu60GlyfsTer67 | p.E60Gfs*67 | Q8WU76 | protein_coding | TCGA-A2-A0CU-01 | Breast | breast invasive carcinoma | Female | >=65 | I/II | Hormone Therapy | tamoxiphen | SD | ||
| SCFD2 | insertion | In_Frame_Ins | novel | c.293_294insGTGCACCTGGGAAATTTTATTTTTAGAAATTTACGAATG | p.Phe98delinsLeuCysThrTrpGluIleLeuPheLeuGluIleTyrGluCys | p.F98delinsLCTWEILFLEIYEC | Q8WU76 | protein_coding | TCGA-A8-A07R-01 | Breast | breast invasive carcinoma | Female | >=65 | III/IV | Ancillary | zoledronic | SD | ||
| SCFD2 | insertion | Nonsense_Mutation | novel | c.582_583insCCTAGCCACTTCCAAGTCCAGGGAGAATAATC | p.Arg195ProfsTer10 | p.R195Pfs*10 | Q8WU76 | protein_coding | TCGA-AO-A0J5-01 | Breast | breast invasive carcinoma | Female | <65 | III/IV | Other, specify in notesBisphosphonate | zoledronic | PD | ||
| SCFD2 | insertion | Nonsense_Mutation | novel | c.1781_1782insGTATACTGAGAAACAAAGTACTGTTGTTTGATACAGACA | p.Ile594delinsMetTyrThrGluLysGlnSerThrValValTerTyrArgHis | p.I594delinsMYTEKQSTVV*YRH | Q8WU76 | protein_coding | TCGA-AO-A128-01 | Breast | breast invasive carcinoma | Female | <65 | I/II | Chemotherapy | doxorubicin | SD | ||
| SCFD2 | SNV | Missense_Mutation | novel | c.955N>C | p.Thr319Pro | p.T319P | Q8WU76 | protein_coding | tolerated(0.28) | benign(0) | TCGA-DS-A1OB-01 | Cervix | cervical & endocervical cancer | Female | <65 | I/II | Chemotherapy | carboplatin | PD |
| Page: 1 2 3 4 5 6 7 8 9 |
Top |
Related drugs of malignant transformation related genes |
| Identification of chemicals and drugs interact with genes involved in malignant transfromation |
| (DGIdb 4.0) |
| Entrez ID | Symbol | Category | Interaction Types | Drug Claim Name | Drug Name | PMIDs |
| Page: 1 |

Copyright 2023-Present -The University of Texas Health Science Center at Houston |