| Tissue | Expression Dynamics | Abbreviation |
| Cervix | 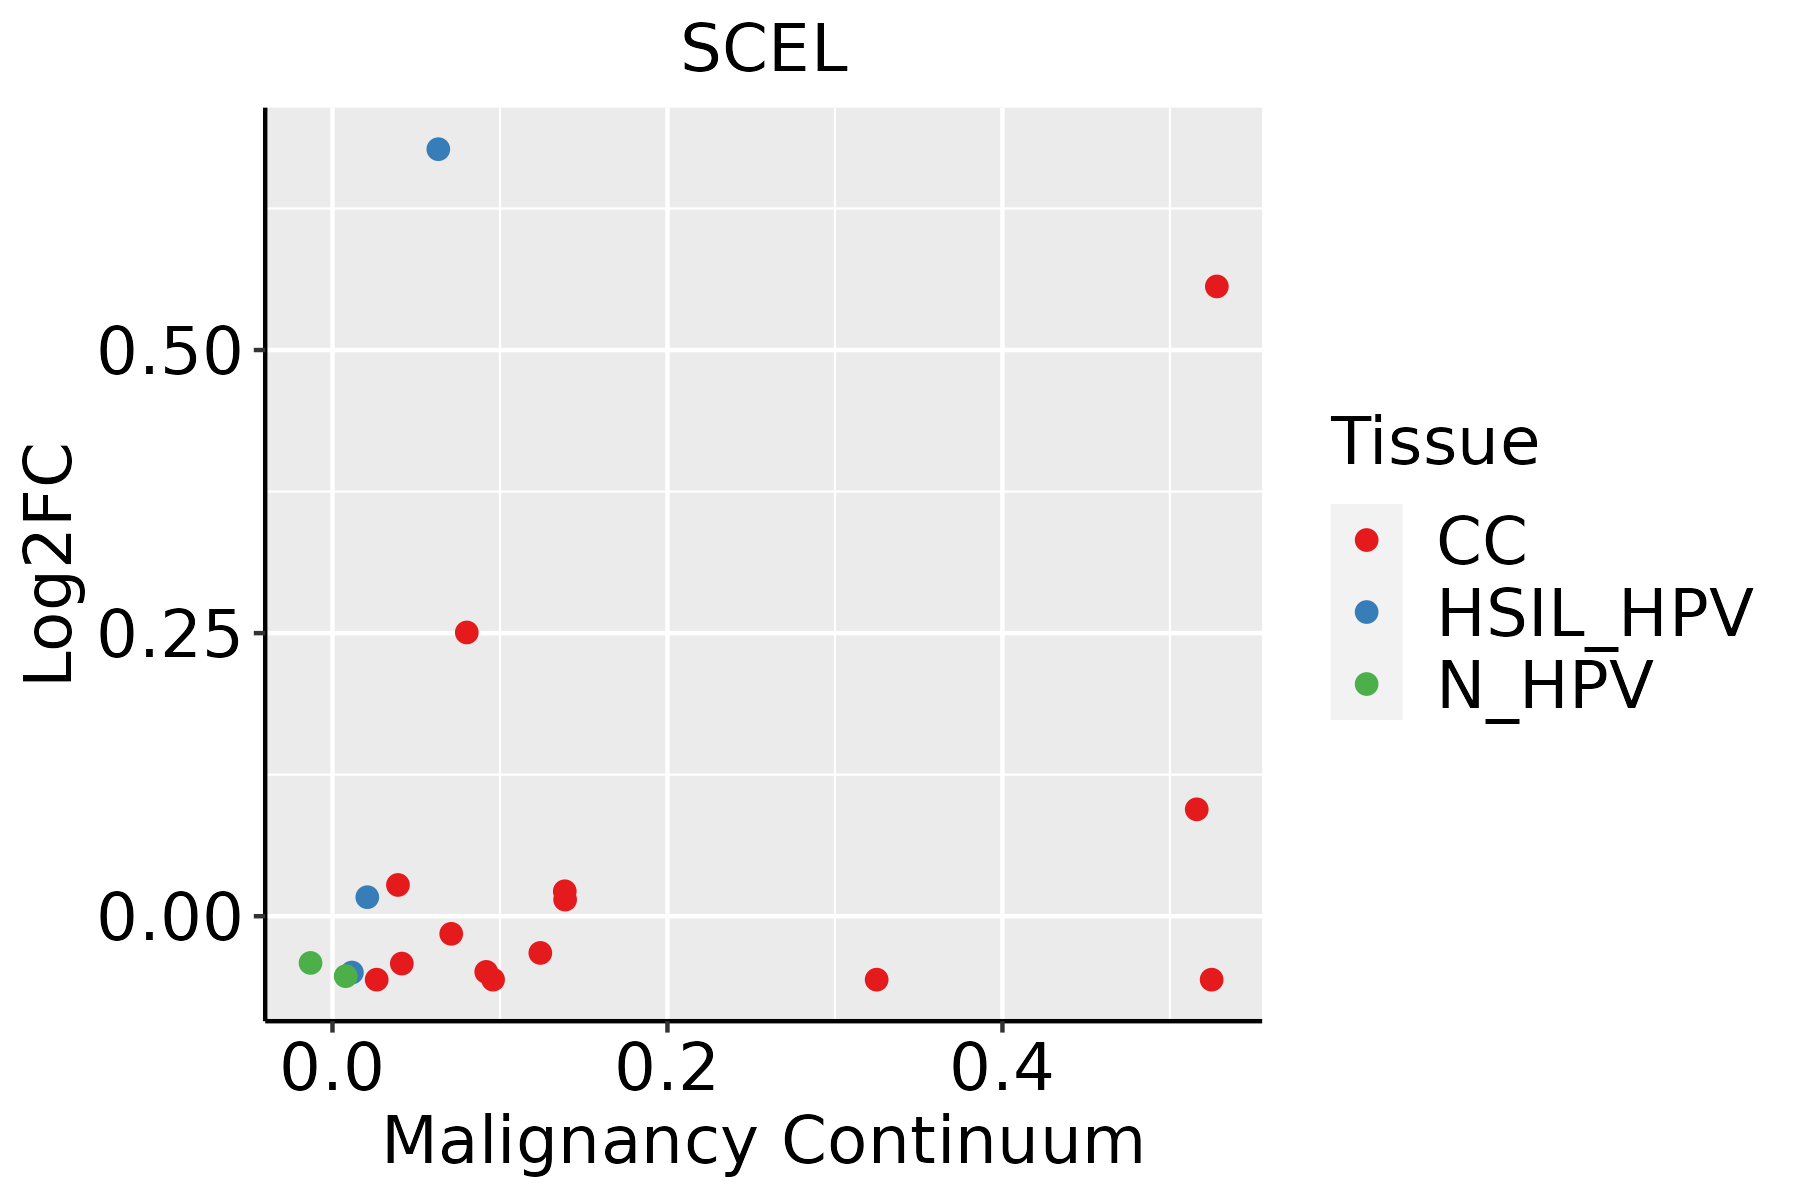 | CC: Cervix cancer |
| HSIL_HPV: HPV-infected high-grade squamous intraepithelial lesions |
| N_HPV: HPV-infected normal cervix |
| Esophagus | 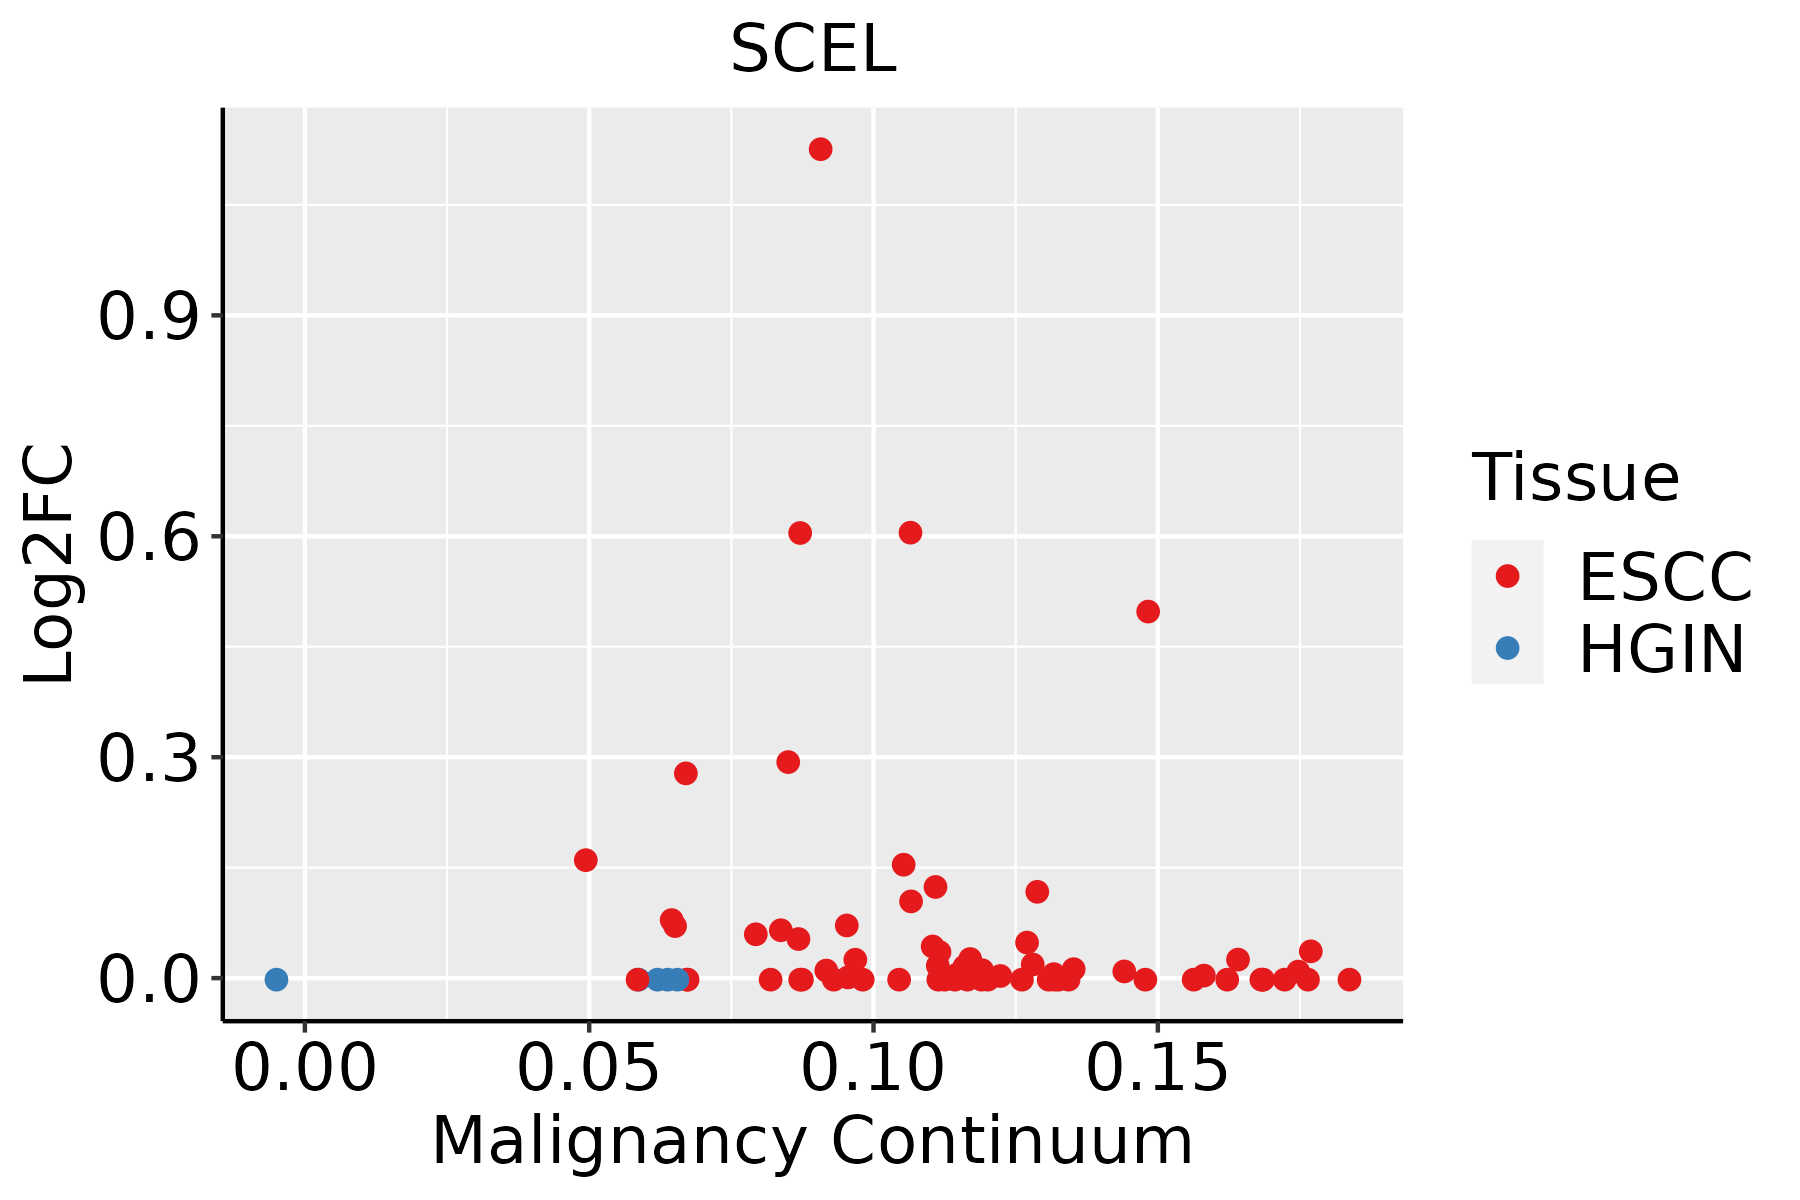 | ESCC: Esophageal squamous cell carcinoma |
| HGIN: High-grade intraepithelial neoplasias |
| LGIN: Low-grade intraepithelial neoplasias |
| Oral Cavity |  | EOLP: Erosive Oral lichen planus |
| LP: leukoplakia |
| NEOLP: Non-erosive oral lichen planus |
| OSCC: Oral squamous cell carcinoma |
| Thyroid |  | ATC: Anaplastic thyroid cancer |
| HT: Hashimoto's thyroiditis |
| PTC: Papillary thyroid cancer |
| GO ID | Tissue | Disease Stage | Description | Gene Ratio | Bg Ratio | pvalue | p.adjust | Count |
| GO:00085446 | Cervix | CC | epidermis development | 83/2311 | 324/18723 | 3.91e-11 | 8.54e-09 | 83 |
| GO:00435884 | Cervix | CC | skin development | 71/2311 | 263/18723 | 8.04e-11 | 1.46e-08 | 71 |
| GO:00160557 | Cervix | CC | Wnt signaling pathway | 98/2311 | 444/18723 | 4.82e-09 | 4.65e-07 | 98 |
| GO:01987387 | Cervix | CC | cell-cell signaling by wnt | 98/2311 | 446/18723 | 6.16e-09 | 5.58e-07 | 98 |
| GO:00302164 | Cervix | CC | keratinocyte differentiation | 42/2311 | 139/18723 | 1.74e-08 | 1.28e-06 | 42 |
| GO:00301117 | Cervix | CC | regulation of Wnt signaling pathway | 76/2311 | 328/18723 | 3.05e-08 | 2.08e-06 | 76 |
| GO:00099137 | Cervix | CC | epidermal cell differentiation | 53/2311 | 202/18723 | 5.48e-08 | 3.25e-06 | 53 |
| GO:00608287 | Cervix | CC | regulation of canonical Wnt signaling pathway | 58/2311 | 253/18723 | 1.83e-06 | 5.89e-05 | 58 |
| GO:00600707 | Cervix | CC | canonical Wnt signaling pathway | 66/2311 | 303/18723 | 2.47e-06 | 7.35e-05 | 66 |
| GO:00096127 | Cervix | CC | response to mechanical stimulus | 48/2311 | 216/18723 | 3.23e-05 | 5.29e-04 | 48 |
| GO:00301776 | Cervix | CC | positive regulation of Wnt signaling pathway | 31/2311 | 140/18723 | 8.01e-04 | 7.02e-03 | 31 |
| GO:00902636 | Cervix | CC | positive regulation of canonical Wnt signaling pathway | 22/2311 | 106/18723 | 9.52e-03 | 4.72e-02 | 22 |
| GO:000854413 | Cervix | HSIL_HPV | epidermis development | 38/737 | 324/18723 | 1.92e-09 | 3.23e-07 | 38 |
| GO:003021611 | Cervix | HSIL_HPV | keratinocyte differentiation | 22/737 | 139/18723 | 2.53e-08 | 2.18e-06 | 22 |
| GO:004358813 | Cervix | HSIL_HPV | skin development | 31/737 | 263/18723 | 5.32e-08 | 3.89e-06 | 31 |
| GO:000991313 | Cervix | HSIL_HPV | epidermal cell differentiation | 26/737 | 202/18723 | 1.10e-07 | 7.15e-06 | 26 |
| GO:000961212 | Cervix | HSIL_HPV | response to mechanical stimulus | 21/737 | 216/18723 | 1.31e-04 | 2.61e-03 | 21 |
| GO:001605517 | Esophagus | ESCC | Wnt signaling pathway | 268/8552 | 444/18723 | 2.32e-10 | 6.58e-09 | 268 |
| GO:019873817 | Esophagus | ESCC | cell-cell signaling by wnt | 269/8552 | 446/18723 | 2.41e-10 | 6.79e-09 | 269 |
| GO:00435888 | Esophagus | ESCC | skin development | 163/8552 | 263/18723 | 6.48e-08 | 1.14e-06 | 163 |
| Hugo Symbol | Variant Class | Variant Classification | dbSNP RS | HGVSc | HGVSp | HGVSp Short | SWISSPROT | BIOTYPE | SIFT | PolyPhen | Tumor Sample Barcode | Tissue | Histology | Sex | Age | Stage | Therapy Types | Drugs | Outcome |
| SCEL | SNV | Missense_Mutation | novel | c.1207N>T | p.Ser403Cys | p.S403C | O95171 | protein_coding | deleterious_low_confidence(0) | possibly_damaging(0.591) | TCGA-A8-A07I-01 | Breast | breast invasive carcinoma | Female | >=65 | III/IV | Chemotherapy | 5-fluorouracil | CR |
| SCEL | SNV | Missense_Mutation | novel | c.1445N>A | p.Thr482Asn | p.T482N | O95171 | protein_coding | tolerated(0.15) | benign(0.165) | TCGA-AC-A3QQ-01 | Breast | breast invasive carcinoma | Female | <65 | I/II | Unknown | Unknown | SD |
| SCEL | SNV | Missense_Mutation | novel | c.277N>T | p.Asp93Tyr | p.D93Y | O95171 | protein_coding | deleterious(0) | probably_damaging(0.998) | TCGA-AN-A046-01 | Breast | breast invasive carcinoma | Female | >=65 | I/II | Unknown | Unknown | SD |
| SCEL | SNV | Missense_Mutation | rs201091090 | c.991N>A | p.Glu331Lys | p.E331K | O95171 | protein_coding | tolerated(0.27) | benign(0.009) | TCGA-AN-A046-01 | Breast | breast invasive carcinoma | Female | >=65 | I/II | Unknown | Unknown | SD |
| SCEL | SNV | Missense_Mutation | | c.1547C>A | p.Pro516His | p.P516H | O95171 | protein_coding | deleterious(0) | probably_damaging(0.998) | TCGA-AN-A0AK-01 | Breast | breast invasive carcinoma | Female | >=65 | I/II | Unknown | Unknown | SD |
| SCEL | SNV | Missense_Mutation | | c.1638N>A | p.Asn546Lys | p.N546K | O95171 | protein_coding | deleterious(0.03) | benign(0.036) | TCGA-D8-A1XQ-01 | Breast | breast invasive carcinoma | Female | >=65 | I/II | Unknown | Unknown | SD |
| SCEL | insertion | Nonsense_Mutation | novel | c.2035_2036insCTTTTGGTAAATAGAAATATTTTCATTTATTACATTTTAGATC | p.Tyr679SerfsTer5 | p.Y679Sfs*5 | O95171 | protein_coding | | | TCGA-A8-A08H-01 | Breast | breast invasive carcinoma | Female | >=65 | I/II | Unknown | Unknown | SD |
| SCEL | deletion | Frame_Shift_Del | novel | c.741delN | p.Ser248ValfsTer13 | p.S248Vfs*13 | O95171 | protein_coding | | | TCGA-EW-A2FV-01 | Breast | breast invasive carcinoma | Female | <65 | III/IV | Chemotherapy | docetaxel | SD |
| SCEL | SNV | Missense_Mutation | novel | c.1166G>A | p.Ser389Asn | p.S389N | O95171 | protein_coding | tolerated_low_confidence(0.07) | possibly_damaging(0.652) | TCGA-2W-A8YY-01 | Cervix | cervical & endocervical cancer | Female | <65 | I/II | Chemotherapy | cisplatin | CR |
| SCEL | SNV | Missense_Mutation | novel | c.1476C>G | p.Ile492Met | p.I492M | O95171 | protein_coding | deleterious(0) | probably_damaging(0.93) | TCGA-HM-A4S6-01 | Cervix | cervical & endocervical cancer | Female | <65 | III/IV | Chemotherapy | cisplatin | CR |


