
|
|||||
|
 | |
| |
| |
| |
| |
| |
|
Gene: SCD |
Gene summary for SCD |
| Gene information | Species | Human | Gene symbol | SCD | Gene ID | 6319 |
| Gene name | stearoyl-CoA desaturase | |
| Gene Alias | FADS5 | |
| Cytomap | 10q24.31 | |
| Gene Type | protein-coding | GO ID | GO:0001659 | UniProtAcc | O00767 |
Top |
Malignant transformation analysis |
| Identification of the aberrant gene expression in precancerous and cancerous lesions by comparing the gene expression of stem-like cells in diseased tissues with normal stem cells |
| Entrez ID | Symbol | Replicates | Species | Organ | Tissue | Adj P-value | Log2FC | Malignancy |
| 6319 | SCD | GSM4909281 | Human | Breast | IDC | 3.45e-14 | 4.26e-01 | 0.21 |
| 6319 | SCD | GSM4909282 | Human | Breast | IDC | 4.70e-07 | 2.95e-01 | -0.0288 |
| 6319 | SCD | GSM4909290 | Human | Breast | IDC | 9.97e-60 | 1.21e+00 | 0.2096 |
| 6319 | SCD | GSM4909291 | Human | Breast | IDC | 6.68e-15 | 6.06e-01 | 0.1753 |
| 6319 | SCD | GSM4909296 | Human | Breast | IDC | 3.21e-03 | 2.18e-01 | 0.1524 |
| 6319 | SCD | GSM4909301 | Human | Breast | IDC | 1.04e-15 | 4.60e-01 | 0.1577 |
| 6319 | SCD | GSM4909302 | Human | Breast | IDC | 8.03e-07 | 3.75e-01 | 0.1545 |
| 6319 | SCD | GSM4909304 | Human | Breast | IDC | 6.68e-101 | 1.36e+00 | 0.1636 |
| 6319 | SCD | GSM4909306 | Human | Breast | IDC | 1.01e-06 | 2.58e-01 | 0.1564 |
| 6319 | SCD | GSM4909307 | Human | Breast | IDC | 4.44e-04 | 2.22e-01 | 0.1569 |
| 6319 | SCD | GSM4909311 | Human | Breast | IDC | 5.48e-04 | 1.87e-01 | 0.1534 |
| 6319 | SCD | GSM4909312 | Human | Breast | IDC | 1.19e-13 | 5.36e-01 | 0.1552 |
| 6319 | SCD | GSM4909315 | Human | Breast | IDC | 3.05e-11 | 3.81e-01 | 0.21 |
| 6319 | SCD | GSM4909317 | Human | Breast | IDC | 4.74e-21 | 6.29e-01 | 0.1355 |
| 6319 | SCD | GSM4909319 | Human | Breast | IDC | 2.48e-09 | 2.07e-01 | 0.1563 |
| 6319 | SCD | GSM4909320 | Human | Breast | IDC | 2.02e-03 | 4.47e-01 | 0.1575 |
| 6319 | SCD | GSM4909321 | Human | Breast | IDC | 3.07e-06 | 3.15e-01 | 0.1559 |
| 6319 | SCD | brca2 | Human | Breast | Precancer | 9.27e-18 | 4.27e-01 | -0.024 |
| 6319 | SCD | M1 | Human | Breast | IDC | 2.41e-18 | 6.19e-01 | 0.1577 |
| 6319 | SCD | M2 | Human | Breast | IDC | 3.21e-07 | 6.87e-01 | 0.21 |
| Page: 1 2 3 4 5 6 7 8 9 10 |
| Tissue | Expression Dynamics | Abbreviation |
| Breast | 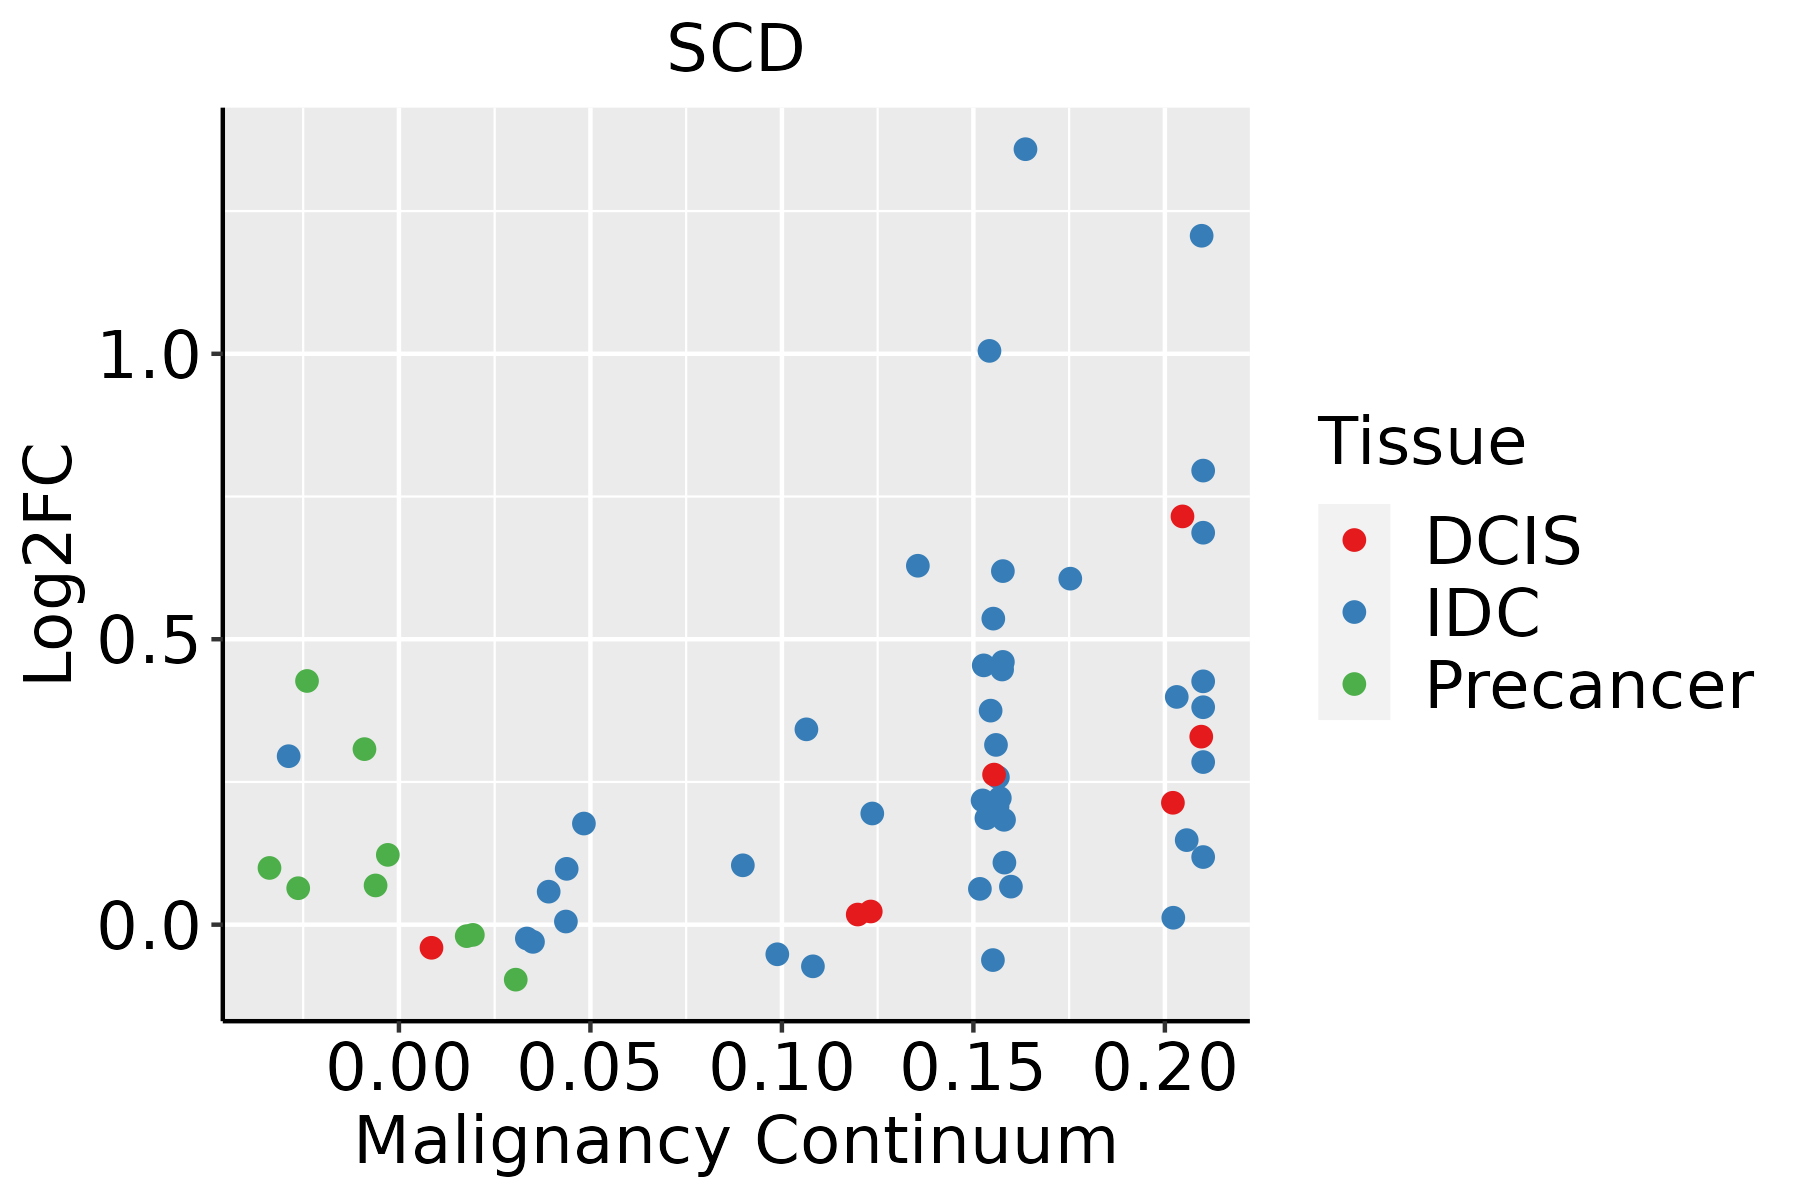 | IDC: Invasive ductal carcinoma |
| DCIS: Ductal carcinoma in situ | ||
| Precancer(BRCA1-mut): Precancerous lesion from BRCA1 mutation carriers | ||
| Colorectum (GSE201348) | 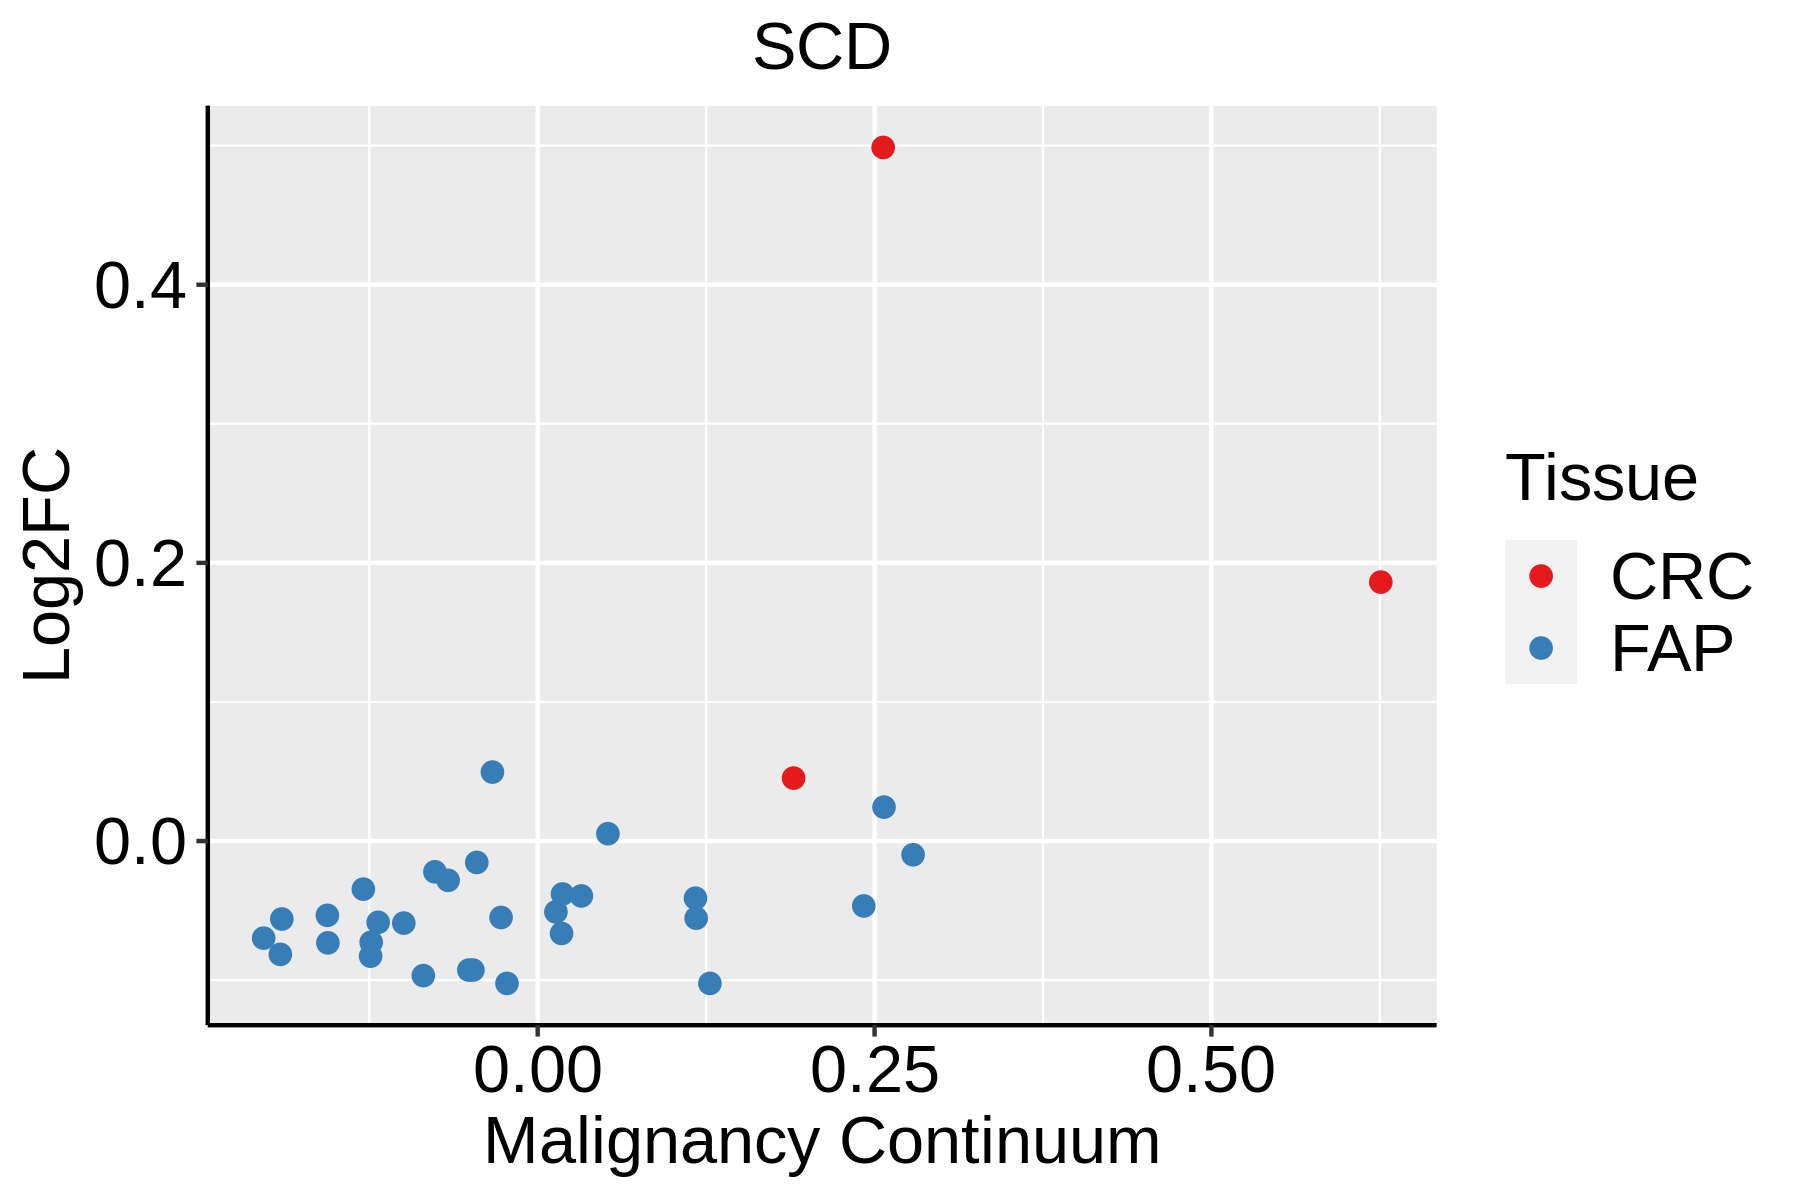 | FAP: Familial adenomatous polyposis |
| CRC: Colorectal cancer | ||
| Colorectum (HTA11) |  | AD: Adenomas |
| SER: Sessile serrated lesions | ||
| MSI-H: Microsatellite-high colorectal cancer | ||
| MSS: Microsatellite stable colorectal cancer | ||
| Esophagus |  | ESCC: Esophageal squamous cell carcinoma |
| HGIN: High-grade intraepithelial neoplasias | ||
| LGIN: Low-grade intraepithelial neoplasias | ||
| GC | 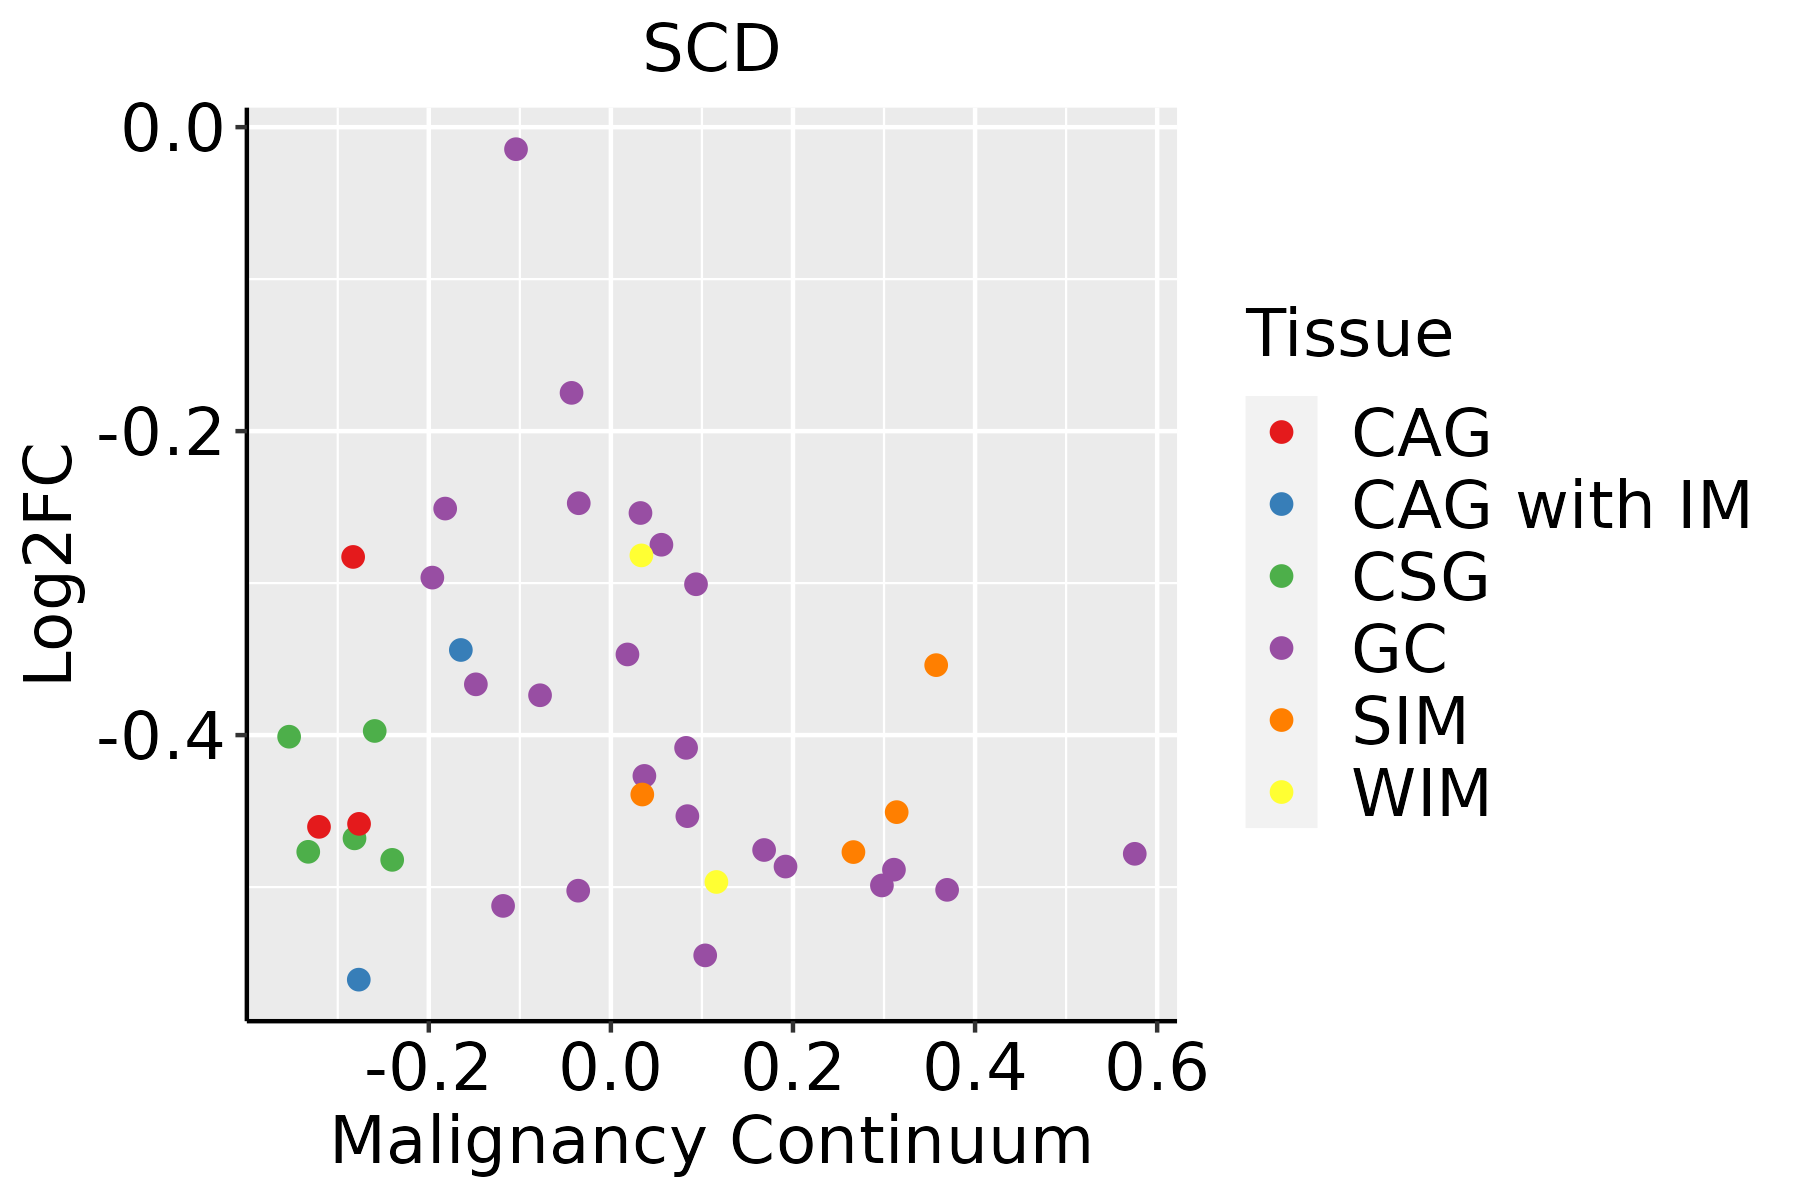 | CAG: Chronic atrophic gastritis |
| CAG with IM: Chronic atrophic gastritis with intestinal metaplasia | ||
| CSG: Chronic superficial gastritis | ||
| GC: Gastric cancer | ||
| SIM: Severe intestinal metaplasia | ||
| WIM: Wild intestinal metaplasia | ||
| Liver |  | HCC: Hepatocellular carcinoma |
| NAFLD: Non-alcoholic fatty liver disease | ||
| Lung | 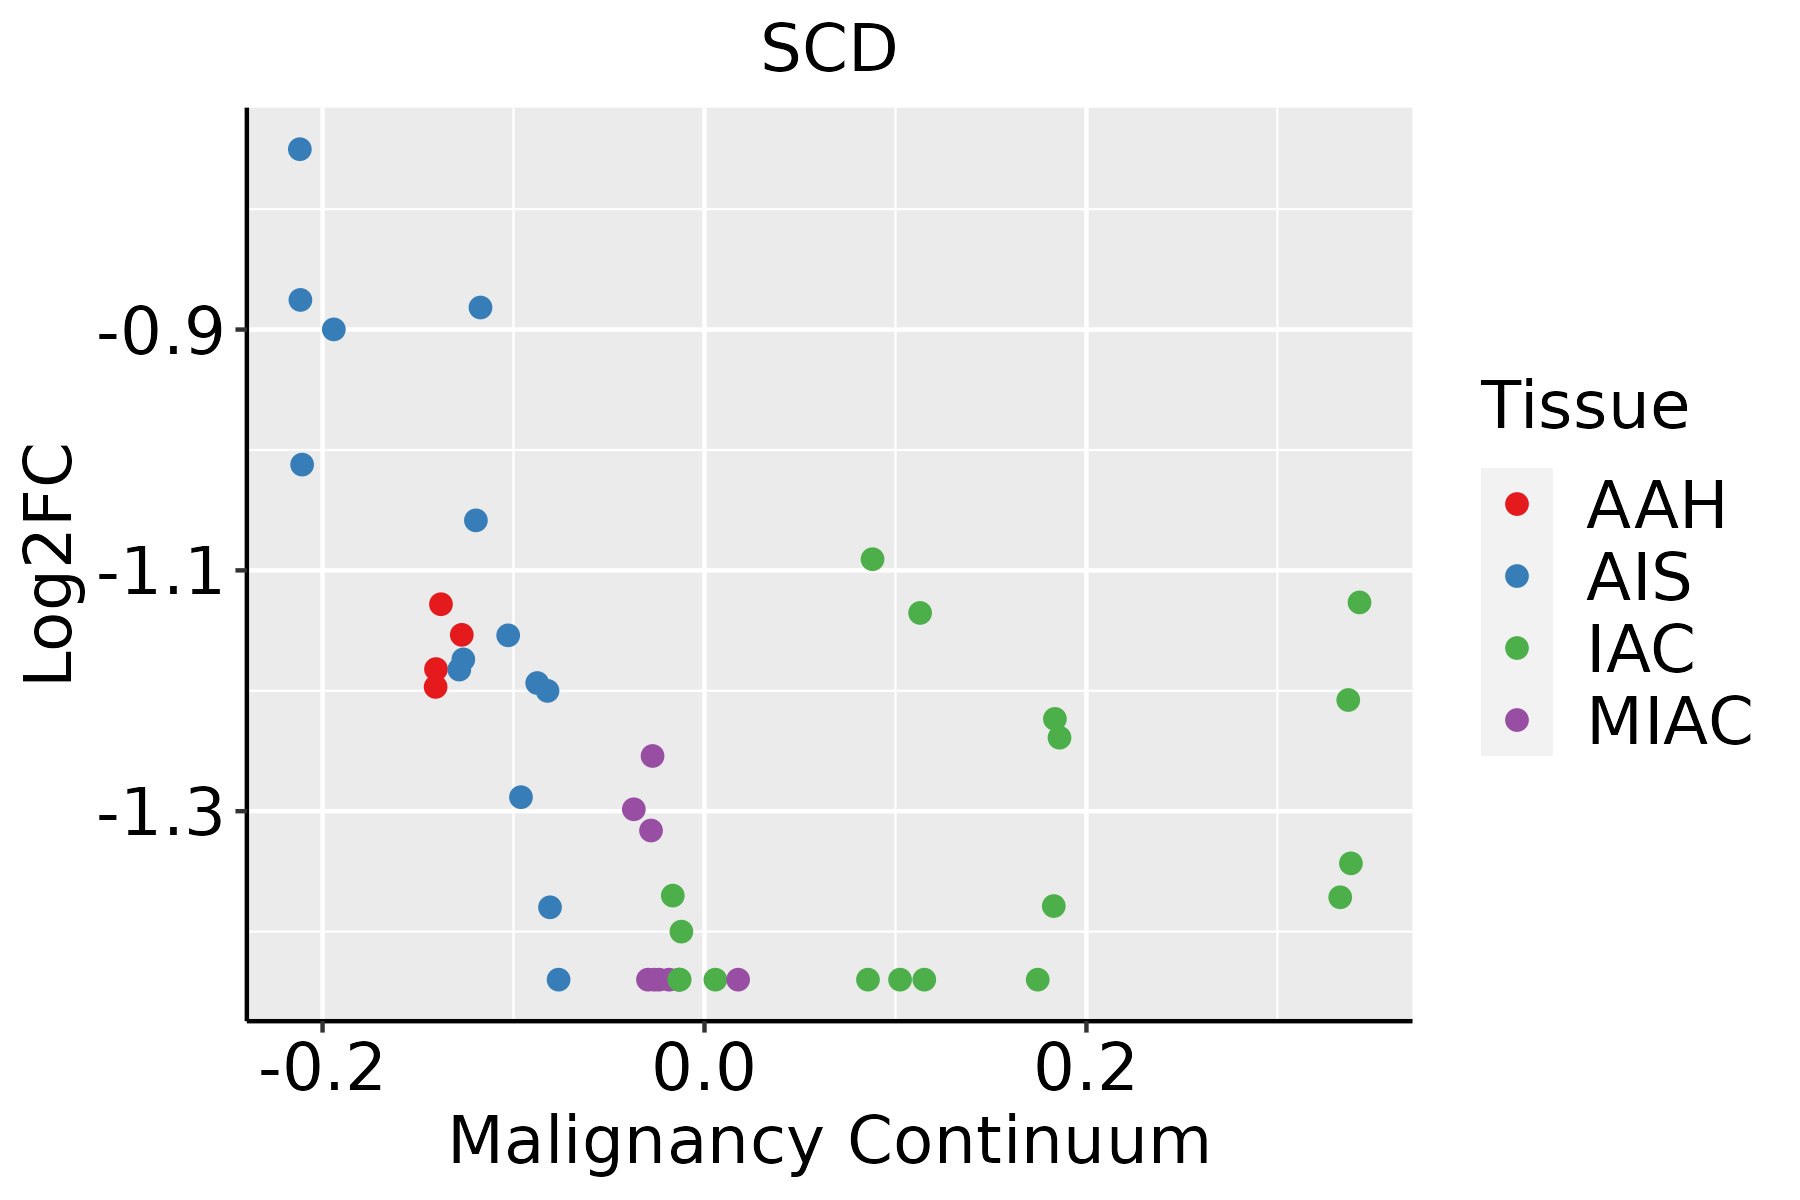 | AAH: Atypical adenomatous hyperplasia |
| AIS: Adenocarcinoma in situ | ||
| IAC: Invasive lung adenocarcinoma | ||
| MIA: Minimally invasive adenocarcinoma | ||
| Oral Cavity | 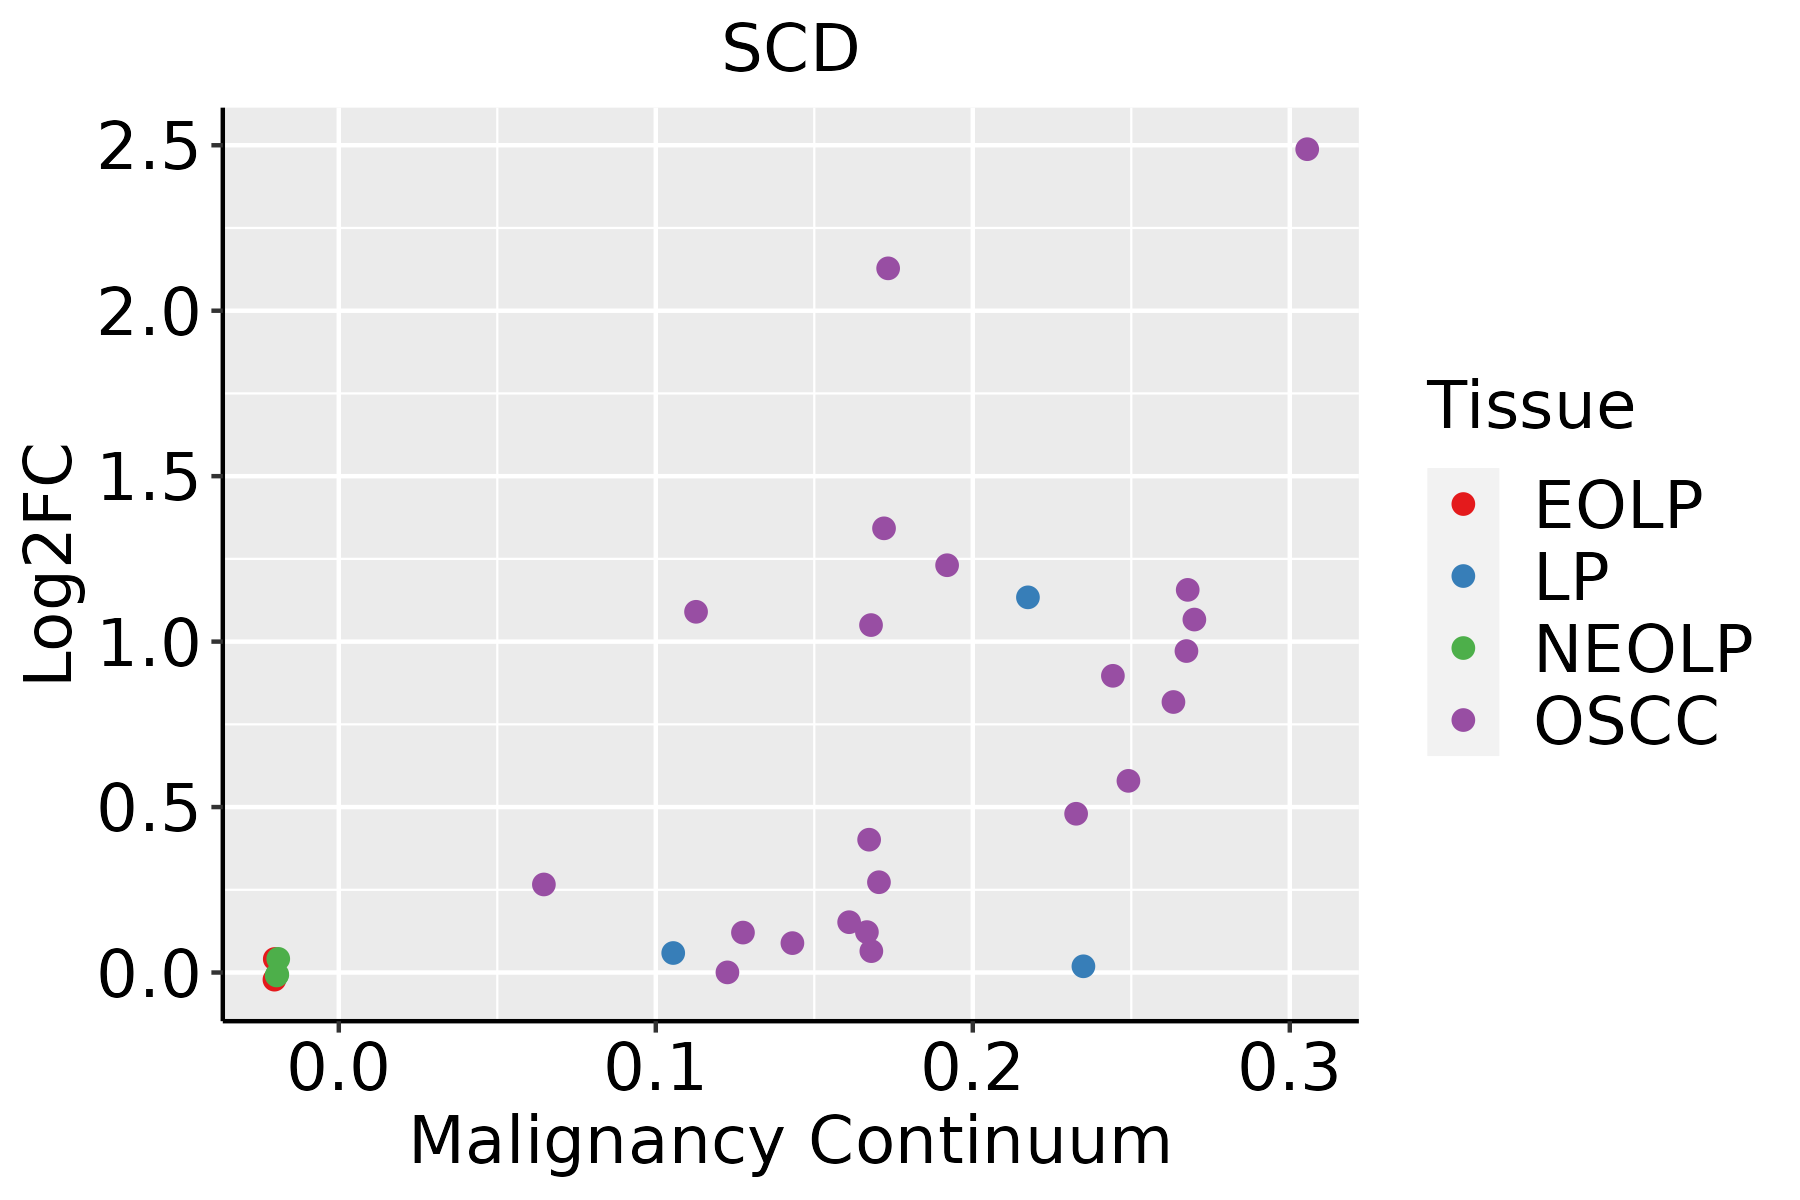 | EOLP: Erosive Oral lichen planus |
| LP: leukoplakia | ||
| NEOLP: Non-erosive oral lichen planus | ||
| OSCC: Oral squamous cell carcinoma | ||
| Prostate |  | BPH: Benign Prostatic Hyperplasia |
| Skin |  | AK: Actinic keratosis |
| cSCC: Cutaneous squamous cell carcinoma | ||
| SCCIS:squamous cell carcinoma in situ |
| ∗log2FC in expression of this searched gene in stem-like cells from each diseased tissue sample relative to stem-like cells in normal samples in each tissue plotted against the malignancy continuum. Samples are colored based on if they are from different disease stage. |
Top |
Malignant transformation related pathway analysis |
| Find out the enriched GO biological processes and KEGG pathways involved in transition from healthy to precancer to cancer |
| Tissue | Disease Stage | Enriched GO biological Processes |
| Colorectum | AD |  |
| Colorectum | SER |  |
| Colorectum | MSS |  |
| Colorectum | MSI-H |  |
| Colorectum | FAP |  |
| ∗Top 15 enriched GO BP terms are showed in the bar plot of each disease state in each tissue. Each row represents a significant GO biological process which is colored according to the -log10(p.adjust). |
| Page: 1 2 3 4 5 6 7 8 9 |
| GO ID | Tissue | Disease Stage | Description | Gene Ratio | Bg Ratio | pvalue | p.adjust | Count |
| GO:00463946 | Breast | Precancer | carboxylic acid biosynthetic process | 32/1080 | 314/18723 | 1.30e-03 | 1.38e-02 | 32 |
| GO:00723304 | Breast | Precancer | monocarboxylic acid biosynthetic process | 24/1080 | 214/18723 | 1.41e-03 | 1.48e-02 | 24 |
| GO:00160536 | Breast | Precancer | organic acid biosynthetic process | 32/1080 | 316/18723 | 1.44e-03 | 1.50e-02 | 32 |
| GO:00066335 | Breast | Precancer | fatty acid biosynthetic process | 19/1080 | 163/18723 | 2.74e-03 | 2.42e-02 | 19 |
| GO:007233012 | Breast | IDC | monocarboxylic acid biosynthetic process | 29/1434 | 214/18723 | 1.91e-03 | 1.83e-02 | 29 |
| GO:001605313 | Breast | IDC | organic acid biosynthetic process | 39/1434 | 316/18723 | 2.13e-03 | 1.99e-02 | 39 |
| GO:000663312 | Breast | IDC | fatty acid biosynthetic process | 23/1434 | 163/18723 | 3.21e-03 | 2.70e-02 | 23 |
| GO:004639413 | Breast | IDC | carboxylic acid biosynthetic process | 38/1434 | 314/18723 | 3.39e-03 | 2.83e-02 | 38 |
| GO:001605322 | Breast | DCIS | organic acid biosynthetic process | 38/1390 | 316/18723 | 2.22e-03 | 2.04e-02 | 38 |
| GO:007233022 | Breast | DCIS | monocarboxylic acid biosynthetic process | 28/1390 | 214/18723 | 2.43e-03 | 2.18e-02 | 28 |
| GO:004639422 | Breast | DCIS | carboxylic acid biosynthetic process | 37/1390 | 314/18723 | 3.56e-03 | 2.92e-02 | 37 |
| GO:000663322 | Breast | DCIS | fatty acid biosynthetic process | 22/1390 | 163/18723 | 4.62e-03 | 3.52e-02 | 22 |
| GO:0006631 | Colorectum | AD | fatty acid metabolic process | 114/3918 | 390/18723 | 5.58e-05 | 9.44e-04 | 114 |
| GO:0120162 | Colorectum | AD | positive regulation of cold-induced thermogenesis | 32/3918 | 97/18723 | 3.74e-03 | 2.63e-02 | 32 |
| GO:0106106 | Colorectum | AD | cold-induced thermogenesis | 43/3918 | 144/18723 | 7.05e-03 | 4.31e-02 | 43 |
| GO:0120161 | Colorectum | AD | regulation of cold-induced thermogenesis | 43/3918 | 144/18723 | 7.05e-03 | 4.31e-02 | 43 |
| GO:1990845 | Colorectum | AD | adaptive thermogenesis | 46/3918 | 157/18723 | 7.97e-03 | 4.73e-02 | 46 |
| GO:00066312 | Colorectum | MSS | fatty acid metabolic process | 95/3467 | 390/18723 | 2.20e-03 | 1.84e-02 | 95 |
| GO:0070542 | Colorectum | MSS | response to fatty acid | 21/3467 | 64/18723 | 4.39e-03 | 3.11e-02 | 21 |
| GO:0046394 | Colorectum | MSS | carboxylic acid biosynthetic process | 76/3467 | 314/18723 | 6.71e-03 | 4.38e-02 | 76 |
| Page: 1 2 3 4 5 6 |
| Pathway ID | Tissue | Disease Stage | Description | Gene Ratio | Bg Ratio | pvalue | p.adjust | qvalue | Count |
| hsa04152 | Colorectum | AD | AMPK signaling pathway | 47/2092 | 121/8465 | 3.74e-04 | 2.82e-03 | 1.80e-03 | 47 |
| hsa041521 | Colorectum | AD | AMPK signaling pathway | 47/2092 | 121/8465 | 3.74e-04 | 2.82e-03 | 1.80e-03 | 47 |
| hsa041522 | Colorectum | MSS | AMPK signaling pathway | 41/1875 | 121/8465 | 1.91e-03 | 9.83e-03 | 6.03e-03 | 41 |
| hsa041523 | Colorectum | MSS | AMPK signaling pathway | 41/1875 | 121/8465 | 1.91e-03 | 9.83e-03 | 6.03e-03 | 41 |
| hsa01212 | Colorectum | CRC | Fatty acid metabolism | 14/1091 | 57/8465 | 1.17e-02 | 4.99e-02 | 3.38e-02 | 14 |
| hsa012121 | Colorectum | CRC | Fatty acid metabolism | 14/1091 | 57/8465 | 1.17e-02 | 4.99e-02 | 3.38e-02 | 14 |
| hsa0415210 | Esophagus | ESCC | AMPK signaling pathway | 80/4205 | 121/8465 | 1.73e-04 | 6.67e-04 | 3.42e-04 | 80 |
| hsa012129 | Esophagus | ESCC | Fatty acid metabolism | 41/4205 | 57/8465 | 5.13e-04 | 1.75e-03 | 8.98e-04 | 41 |
| hsa0415213 | Esophagus | ESCC | AMPK signaling pathway | 80/4205 | 121/8465 | 1.73e-04 | 6.67e-04 | 3.42e-04 | 80 |
| hsa0121214 | Esophagus | ESCC | Fatty acid metabolism | 41/4205 | 57/8465 | 5.13e-04 | 1.75e-03 | 8.98e-04 | 41 |
| hsa033206 | Liver | NAFLD | PPAR signaling pathway | 25/1043 | 75/8465 | 1.61e-06 | 6.62e-05 | 5.33e-05 | 25 |
| hsa012126 | Liver | NAFLD | Fatty acid metabolism | 17/1043 | 57/8465 | 3.43e-04 | 5.93e-03 | 4.78e-03 | 17 |
| hsa0332011 | Liver | NAFLD | PPAR signaling pathway | 25/1043 | 75/8465 | 1.61e-06 | 6.62e-05 | 5.33e-05 | 25 |
| hsa0121211 | Liver | NAFLD | Fatty acid metabolism | 17/1043 | 57/8465 | 3.43e-04 | 5.93e-03 | 4.78e-03 | 17 |
| hsa012122 | Liver | Cirrhotic | Fatty acid metabolism | 32/2530 | 57/8465 | 3.12e-05 | 2.47e-04 | 1.52e-04 | 32 |
| hsa04936 | Liver | Cirrhotic | Alcoholic liver disease | 60/2530 | 142/8465 | 1.07e-03 | 5.85e-03 | 3.61e-03 | 60 |
| hsa0415221 | Liver | Cirrhotic | AMPK signaling pathway | 49/2530 | 121/8465 | 7.90e-03 | 2.74e-02 | 1.69e-02 | 49 |
| hsa0332021 | Liver | Cirrhotic | PPAR signaling pathway | 32/2530 | 75/8465 | 1.24e-02 | 3.92e-02 | 2.42e-02 | 32 |
| hsa01040 | Liver | Cirrhotic | Biosynthesis of unsaturated fatty acids | 14/2530 | 27/8465 | 1.36e-02 | 4.25e-02 | 2.62e-02 | 14 |
| hsa012123 | Liver | Cirrhotic | Fatty acid metabolism | 32/2530 | 57/8465 | 3.12e-05 | 2.47e-04 | 1.52e-04 | 32 |
| Page: 1 2 3 |
Top |
Cell-cell communication analysis |
| Identification of potential cell-cell interactions between two cell types and their ligand-receptor pairs for different disease states |
| Ligand | Receptor | LRpair | Pathway | Tissue | Disease Stage |
| Page: 1 |
Top |
Single-cell gene regulatory network inference analysis |
| Find out the significant the regulons (TFs) and the target genes of each regulon across cell types for different disease states |
| TF | Cell Type | Tissue | Disease Stage | Target Gene | RSS | Regulon Activity |
| ∗The dot plots of a searched regulon are shown for all cell subpopulations in each disease state of each tissue based on the regulon specific score inferred using pySCENIC and by calculating the average expression. |
| Page: 1 |
Top |
Somatic mutation of malignant transformation related genes |
| Annotation of somatic variants for genes involved in malignant transformation |
| Hugo Symbol | Variant Class | Variant Classification | dbSNP RS | HGVSc | HGVSp | HGVSp Short | SWISSPROT | BIOTYPE | SIFT | PolyPhen | Tumor Sample Barcode | Tissue | Histology | Sex | Age | Stage | Therapy Types | Drugs | Outcome |
| SCD | SNV | Missense_Mutation | novel | c.926C>G | p.Ser309Cys | p.S309C | O00767 | protein_coding | deleterious(0) | probably_damaging(0.918) | TCGA-5L-AAT1-01 | Breast | breast invasive carcinoma | Female | <65 | III/IV | Hormone Therapy | letrozol | SD |
| SCD | SNV | Missense_Mutation | c.309N>C | p.Trp103Cys | p.W103C | O00767 | protein_coding | deleterious(0.01) | probably_damaging(0.951) | TCGA-BH-A0DG-01 | Breast | breast invasive carcinoma | Female | <65 | I/II | Chemotherapy | taxotere | CR | |
| SCD | SNV | Missense_Mutation | novel | c.782C>A | p.Thr261Asn | p.T261N | O00767 | protein_coding | deleterious(0) | probably_damaging(0.994) | TCGA-2W-A8YY-01 | Cervix | cervical & endocervical cancer | Female | <65 | I/II | Chemotherapy | cisplatin | CR |
| SCD | SNV | Missense_Mutation | rs200630764 | c.985G>A | p.Ala329Thr | p.A329T | O00767 | protein_coding | tolerated(0.39) | benign(0.018) | TCGA-AA-3877-01 | Colorectum | colon adenocarcinoma | Female | >=65 | I/II | Unknown | Unknown | SD |
| SCD | SNV | Missense_Mutation | c.807N>A | p.His269Gln | p.H269Q | O00767 | protein_coding | deleterious(0) | probably_damaging(0.999) | TCGA-AA-A01K-01 | Colorectum | colon adenocarcinoma | Female | >=65 | III/IV | Chemotherapy | folinic | CR | |
| SCD | SNV | Missense_Mutation | rs200146571 | c.65N>G | p.Ala22Gly | p.A22G | O00767 | protein_coding | tolerated(0.14) | benign(0.31) | TCGA-AA-A02W-01 | Colorectum | colon adenocarcinoma | Female | >=65 | I/II | Unknown | Unknown | PD |
| SCD | SNV | Missense_Mutation | c.563N>A | p.Arg188His | p.R188H | O00767 | protein_coding | deleterious(0.01) | probably_damaging(0.996) | TCGA-D5-6530-01 | Colorectum | colon adenocarcinoma | Male | <65 | I/II | Unknown | Unknown | SD | |
| SCD | SNV | Missense_Mutation | c.719N>G | p.Glu240Gly | p.E240G | O00767 | protein_coding | deleterious(0) | probably_damaging(1) | TCGA-D5-6926-01 | Colorectum | colon adenocarcinoma | Male | >=65 | III/IV | Chemotherapy | 5-fluorouracil | SD | |
| SCD | SNV | Missense_Mutation | c.954C>G | p.Asn318Lys | p.N318K | O00767 | protein_coding | deleterious(0) | probably_damaging(0.931) | TCGA-QL-A97D-01 | Colorectum | colon adenocarcinoma | Female | >=65 | I/II | Unknown | Unknown | SD | |
| SCD | SNV | Missense_Mutation | novel | c.557N>C | p.Leu186Pro | p.L186P | O00767 | protein_coding | deleterious(0) | probably_damaging(0.995) | TCGA-AG-A00Y-01 | Colorectum | rectum adenocarcinoma | Male | >=65 | I/II | Unknown | Unknown | PD |
| Page: 1 2 3 4 |
Top |
Related drugs of malignant transformation related genes |
| Identification of chemicals and drugs interact with genes involved in malignant transfromation |
| (DGIdb 4.0) |
| Entrez ID | Symbol | Category | Interaction Types | Drug Claim Name | Drug Name | PMIDs |
| 6319 | SCD | DRUGGABLE GENOME, ENZYME | COLCHICINE | COLCHICINE | 6148915 | |
| 6319 | SCD | DRUGGABLE GENOME, ENZYME | MK-8245 | MK-8245 | ||
| 6319 | SCD | DRUGGABLE GENOME, ENZYME | CLOFIBRATE | CLOFIBRATE | 11162472 | |
| 6319 | SCD | DRUGGABLE GENOME, ENZYME | ROSIGLITAZONE | ROSIGLITAZONE | 15855323 | |
| 6319 | SCD | DRUGGABLE GENOME, ENZYME | Aramchol | ARAMCHOL | ||
| 6319 | SCD | DRUGGABLE GENOME, ENZYME | Isoxyl | |||
| 6319 | SCD | DRUGGABLE GENOME, ENZYME | VITAMIN A | 12538081 |
| Page: 1 |

Copyright 2023-Present -The University of Texas Health Science Center at Houston |