
|
|||||
|
 | |
| |
| |
| |
| |
| |
|
Gene: SCARB1 |
Gene summary for SCARB1 |
| Gene information | Species | Human | Gene symbol | SCARB1 | Gene ID | 949 |
| Gene name | scavenger receptor class B member 1 | |
| Gene Alias | CD36L1 | |
| Cytomap | 12q24.31 | |
| Gene Type | protein-coding | GO ID | GO:0001667 | UniProtAcc | Q8WTV0 |
Top |
Malignant transformation analysis |
| Identification of the aberrant gene expression in precancerous and cancerous lesions by comparing the gene expression of stem-like cells in diseased tissues with normal stem cells |
| Entrez ID | Symbol | Replicates | Species | Organ | Tissue | Adj P-value | Log2FC | Malignancy |
| 949 | SCARB1 | LZE7T | Human | Esophagus | ESCC | 4.72e-04 | 1.87e-01 | 0.0667 |
| 949 | SCARB1 | LZE20T | Human | Esophagus | ESCC | 6.97e-03 | 1.09e-01 | 0.0662 |
| 949 | SCARB1 | LZE22T | Human | Esophagus | ESCC | 7.08e-03 | 3.18e-01 | 0.068 |
| 949 | SCARB1 | LZE24T | Human | Esophagus | ESCC | 5.02e-03 | 1.88e-01 | 0.0596 |
| 949 | SCARB1 | P1T-E | Human | Esophagus | ESCC | 3.31e-04 | 2.51e-01 | 0.0875 |
| 949 | SCARB1 | P2T-E | Human | Esophagus | ESCC | 1.86e-68 | 1.32e+00 | 0.1177 |
| 949 | SCARB1 | P4T-E | Human | Esophagus | ESCC | 3.95e-13 | 4.31e-01 | 0.1323 |
| 949 | SCARB1 | P5T-E | Human | Esophagus | ESCC | 3.46e-16 | 3.51e-01 | 0.1327 |
| 949 | SCARB1 | P8T-E | Human | Esophagus | ESCC | 6.80e-16 | 1.22e-01 | 0.0889 |
| 949 | SCARB1 | P9T-E | Human | Esophagus | ESCC | 3.92e-08 | 1.18e-01 | 0.1131 |
| 949 | SCARB1 | P10T-E | Human | Esophagus | ESCC | 1.39e-14 | 2.22e-01 | 0.116 |
| 949 | SCARB1 | P11T-E | Human | Esophagus | ESCC | 1.87e-10 | 6.18e-01 | 0.1426 |
| 949 | SCARB1 | P12T-E | Human | Esophagus | ESCC | 3.10e-17 | 2.17e-01 | 0.1122 |
| 949 | SCARB1 | P15T-E | Human | Esophagus | ESCC | 2.77e-10 | 2.40e-01 | 0.1149 |
| 949 | SCARB1 | P16T-E | Human | Esophagus | ESCC | 3.85e-59 | 1.30e+00 | 0.1153 |
| 949 | SCARB1 | P17T-E | Human | Esophagus | ESCC | 1.85e-10 | 6.24e-01 | 0.1278 |
| 949 | SCARB1 | P19T-E | Human | Esophagus | ESCC | 1.24e-03 | 6.04e-01 | 0.1662 |
| 949 | SCARB1 | P20T-E | Human | Esophagus | ESCC | 7.11e-05 | 1.14e-01 | 0.1124 |
| 949 | SCARB1 | P21T-E | Human | Esophagus | ESCC | 1.15e-26 | 4.85e-01 | 0.1617 |
| 949 | SCARB1 | P22T-E | Human | Esophagus | ESCC | 1.30e-16 | 2.12e-01 | 0.1236 |
| Page: 1 2 3 4 5 |
| Tissue | Expression Dynamics | Abbreviation |
| Esophagus |  | ESCC: Esophageal squamous cell carcinoma |
| HGIN: High-grade intraepithelial neoplasias | ||
| LGIN: Low-grade intraepithelial neoplasias | ||
| Liver | 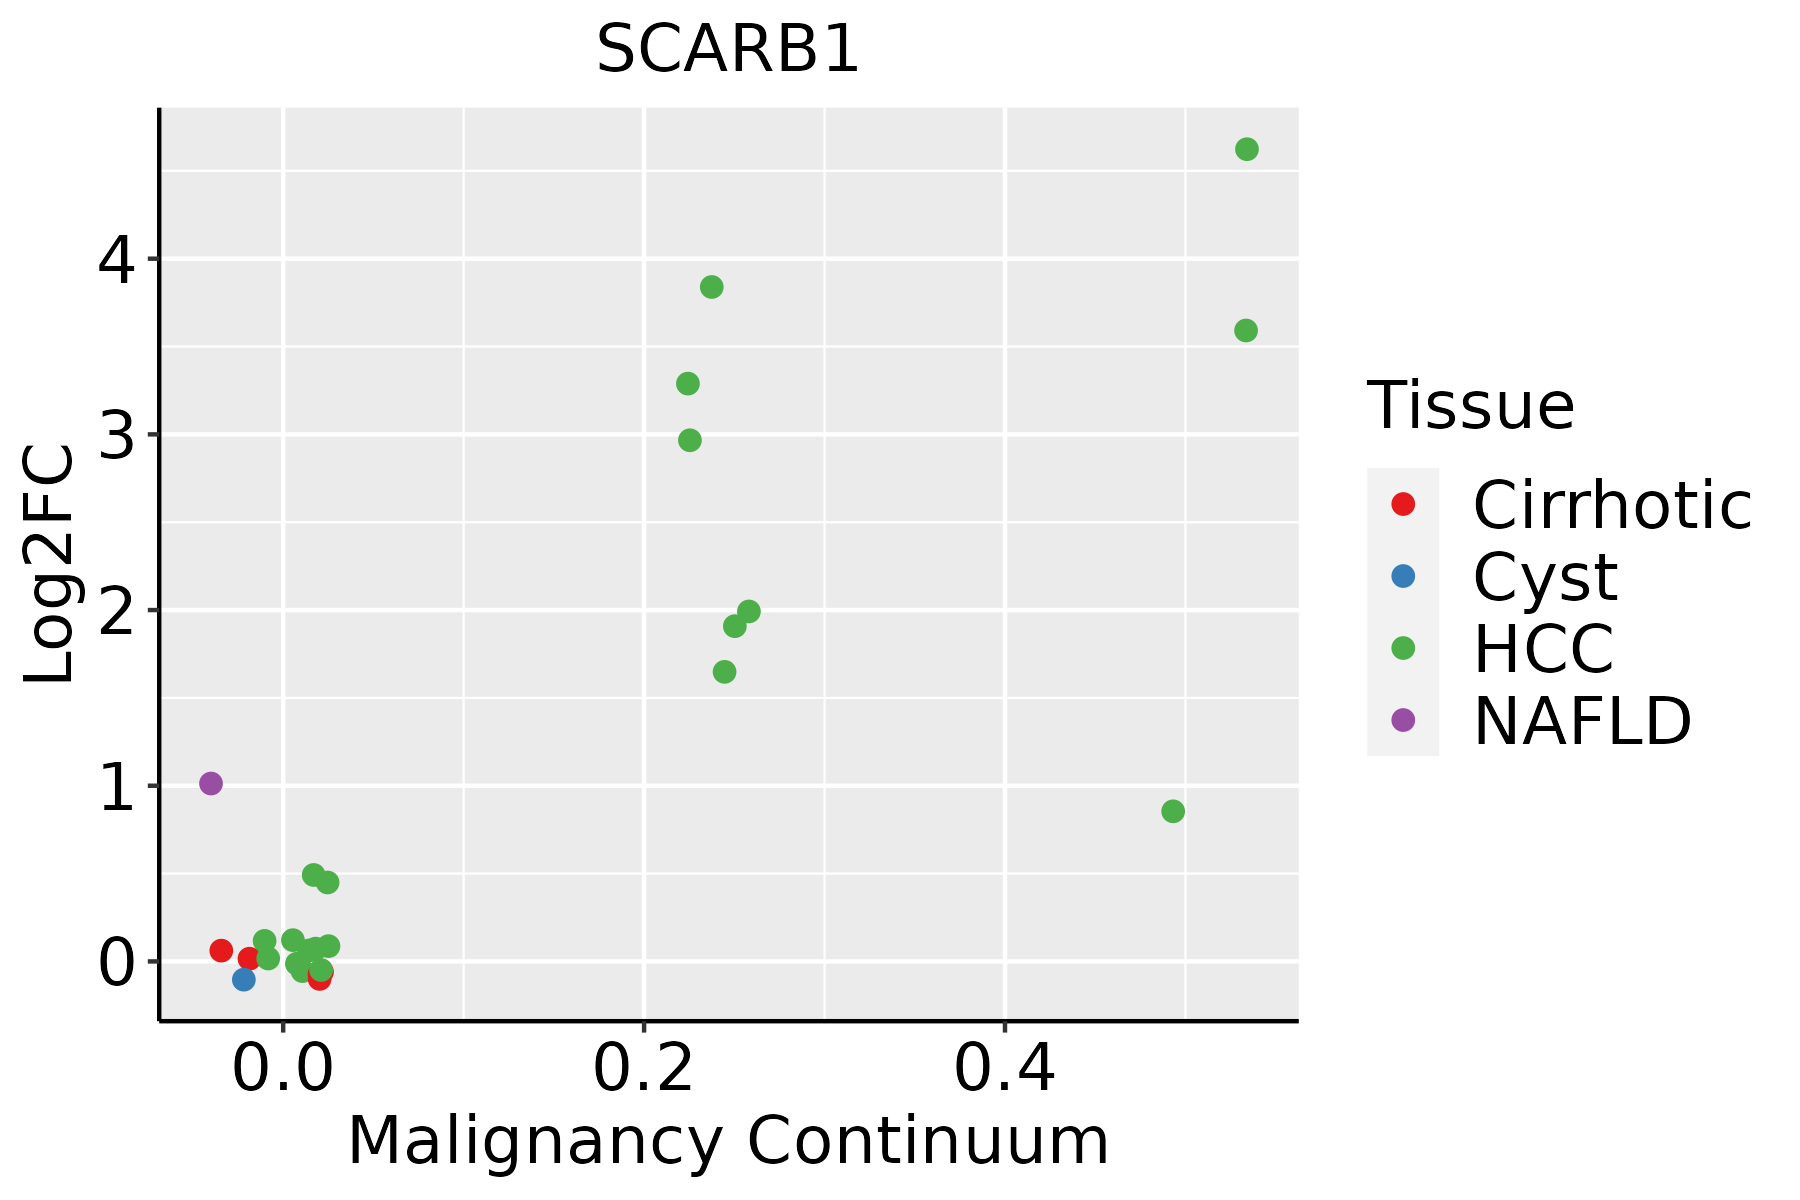 | HCC: Hepatocellular carcinoma |
| NAFLD: Non-alcoholic fatty liver disease | ||
| Oral Cavity | 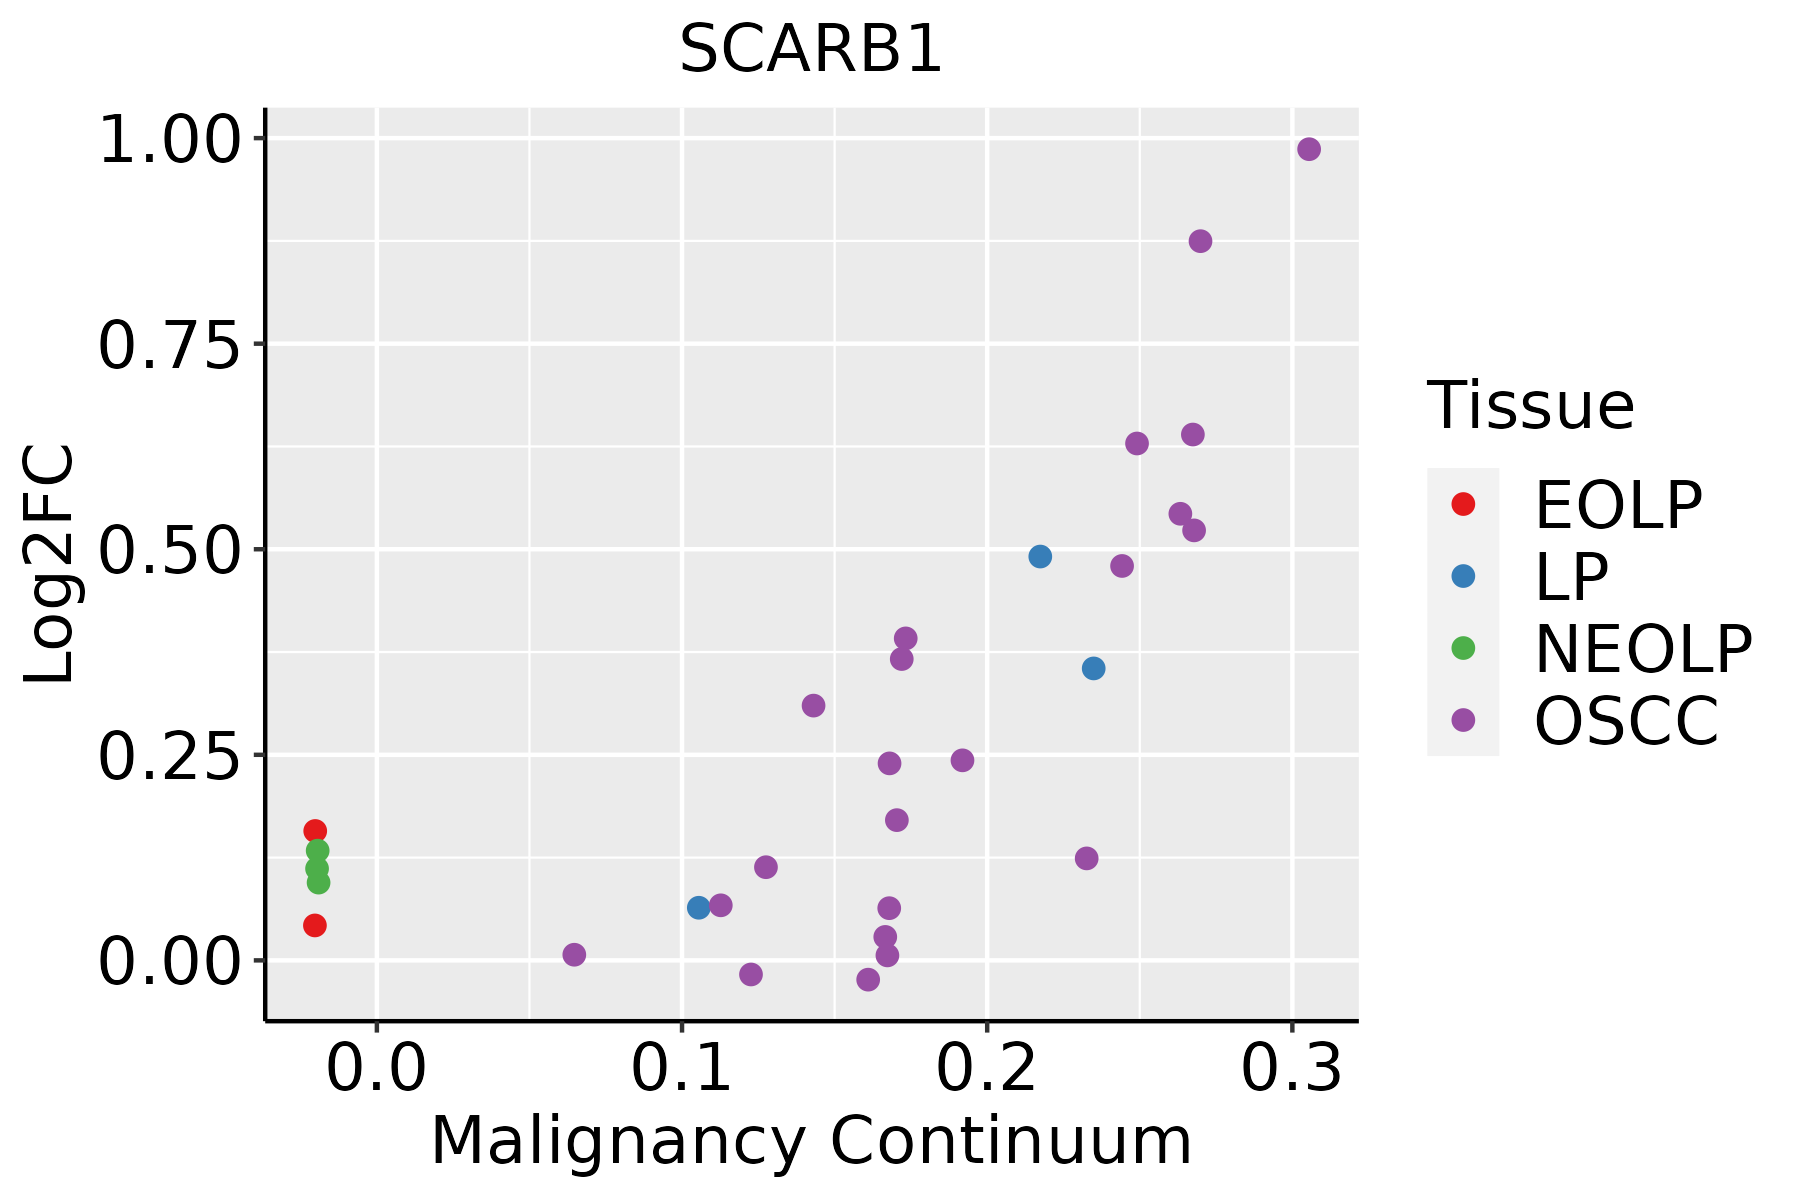 | EOLP: Erosive Oral lichen planus |
| LP: leukoplakia | ||
| NEOLP: Non-erosive oral lichen planus | ||
| OSCC: Oral squamous cell carcinoma |
| ∗log2FC in expression of this searched gene in stem-like cells from each diseased tissue sample relative to stem-like cells in normal samples in each tissue plotted against the malignancy continuum. Samples are colored based on if they are from different disease stage. |
Top |
Malignant transformation related pathway analysis |
| Find out the enriched GO biological processes and KEGG pathways involved in transition from healthy to precancer to cancer |
| Tissue | Disease Stage | Enriched GO biological Processes |
| Colorectum | AD |  |
| Colorectum | SER |  |
| Colorectum | MSS |  |
| Colorectum | MSI-H |  |
| Colorectum | FAP |  |
| ∗Top 15 enriched GO BP terms are showed in the bar plot of each disease state in each tissue. Each row represents a significant GO biological process which is colored according to the -log10(p.adjust). |
| Page: 1 2 3 4 5 6 7 8 9 |
| GO ID | Tissue | Disease Stage | Description | Gene Ratio | Bg Ratio | pvalue | p.adjust | Count |
| GO:0016032111 | Esophagus | ESCC | viral process | 301/8552 | 415/18723 | 3.34e-29 | 1.32e-26 | 301 |
| GO:0019058111 | Esophagus | ESCC | viral life cycle | 226/8552 | 317/18723 | 1.17e-20 | 1.76e-18 | 226 |
| GO:190136118 | Esophagus | ESCC | organic cyclic compound catabolic process | 307/8552 | 495/18723 | 9.99e-14 | 4.80e-12 | 307 |
| GO:0044403111 | Esophagus | ESCC | biological process involved in symbiotic interaction | 186/8552 | 290/18723 | 1.43e-10 | 4.16e-09 | 186 |
| GO:0051701111 | Esophagus | ESCC | biological process involved in interaction with host | 135/8552 | 203/18723 | 1.49e-09 | 3.49e-08 | 135 |
| GO:0051235110 | Esophagus | ESCC | maintenance of location | 200/8552 | 327/18723 | 1.01e-08 | 2.02e-07 | 200 |
| GO:0052126111 | Esophagus | ESCC | movement in host environment | 117/8552 | 175/18723 | 1.14e-08 | 2.26e-07 | 117 |
| GO:004206027 | Esophagus | ESCC | wound healing | 243/8552 | 422/18723 | 4.62e-07 | 6.25e-06 | 243 |
| GO:00450175 | Esophagus | ESCC | glycerolipid biosynthetic process | 154/8552 | 252/18723 | 5.20e-07 | 6.96e-06 | 154 |
| GO:00066446 | Esophagus | ESCC | phospholipid metabolic process | 218/8552 | 383/18723 | 5.37e-06 | 5.59e-05 | 218 |
| GO:0044409111 | Esophagus | ESCC | entry into host | 96/8552 | 151/18723 | 6.73e-06 | 6.84e-05 | 96 |
| GO:00060668 | Esophagus | ESCC | alcohol metabolic process | 202/8552 | 353/18723 | 7.32e-06 | 7.26e-05 | 202 |
| GO:00066505 | Esophagus | ESCC | glycerophospholipid metabolic process | 174/8552 | 306/18723 | 4.92e-05 | 3.85e-04 | 174 |
| GO:00199155 | Esophagus | ESCC | lipid storage | 58/8552 | 87/18723 | 6.15e-05 | 4.72e-04 | 58 |
| GO:004671827 | Esophagus | ESCC | viral entry into host cell | 89/8552 | 144/18723 | 6.84e-05 | 5.18e-04 | 89 |
| GO:003249619 | Esophagus | ESCC | response to lipopolysaccharide | 191/8552 | 343/18723 | 1.11e-04 | 7.73e-04 | 191 |
| GO:005067318 | Esophagus | ESCC | epithelial cell proliferation | 238/8552 | 437/18723 | 1.19e-04 | 8.20e-04 | 238 |
| GO:00464864 | Esophagus | ESCC | glycerolipid metabolic process | 211/8552 | 392/18723 | 6.51e-04 | 3.46e-03 | 211 |
| GO:19026524 | Esophagus | ESCC | secondary alcohol metabolic process | 87/8552 | 147/18723 | 6.58e-04 | 3.50e-03 | 87 |
| GO:00442427 | Esophagus | ESCC | cellular lipid catabolic process | 121/8552 | 214/18723 | 8.63e-04 | 4.43e-03 | 121 |
| Page: 1 2 3 4 5 6 7 8 9 10 11 12 13 |
| Pathway ID | Tissue | Disease Stage | Description | Gene Ratio | Bg Ratio | pvalue | p.adjust | qvalue | Count |
| hsa051609 | Esophagus | ESCC | Hepatitis C | 107/4205 | 157/8465 | 1.75e-06 | 1.08e-05 | 5.55e-06 | 107 |
| hsa0414530 | Esophagus | ESCC | Phagosome | 100/4205 | 152/8465 | 3.81e-05 | 1.72e-04 | 8.82e-05 | 100 |
| hsa0516016 | Esophagus | ESCC | Hepatitis C | 107/4205 | 157/8465 | 1.75e-06 | 1.08e-05 | 5.55e-06 | 107 |
| hsa04145114 | Esophagus | ESCC | Phagosome | 100/4205 | 152/8465 | 3.81e-05 | 1.72e-04 | 8.82e-05 | 100 |
| hsa049796 | Liver | NAFLD | Cholesterol metabolism | 20/1043 | 51/8465 | 9.73e-07 | 4.56e-05 | 3.67e-05 | 20 |
| hsa049762 | Liver | NAFLD | Bile secretion | 20/1043 | 89/8465 | 5.08e-03 | 4.43e-02 | 3.57e-02 | 20 |
| hsa0497911 | Liver | NAFLD | Cholesterol metabolism | 20/1043 | 51/8465 | 9.73e-07 | 4.56e-05 | 3.67e-05 | 20 |
| hsa0497611 | Liver | NAFLD | Bile secretion | 20/1043 | 89/8465 | 5.08e-03 | 4.43e-02 | 3.57e-02 | 20 |
| hsa049794 | Liver | HCC | Cholesterol metabolism | 41/4020 | 51/8465 | 1.33e-06 | 1.35e-05 | 7.49e-06 | 41 |
| hsa0414521 | Liver | HCC | Phagosome | 93/4020 | 152/8465 | 4.27e-04 | 1.88e-03 | 1.05e-03 | 93 |
| hsa0516021 | Liver | HCC | Hepatitis C | 94/4020 | 157/8465 | 1.11e-03 | 4.10e-03 | 2.28e-03 | 94 |
| hsa049795 | Liver | HCC | Cholesterol metabolism | 41/4020 | 51/8465 | 1.33e-06 | 1.35e-05 | 7.49e-06 | 41 |
| hsa0414531 | Liver | HCC | Phagosome | 93/4020 | 152/8465 | 4.27e-04 | 1.88e-03 | 1.05e-03 | 93 |
| hsa0516031 | Liver | HCC | Hepatitis C | 94/4020 | 157/8465 | 1.11e-03 | 4.10e-03 | 2.28e-03 | 94 |
| hsa051608 | Oral cavity | OSCC | Hepatitis C | 103/3704 | 157/8465 | 2.17e-08 | 1.96e-07 | 9.99e-08 | 103 |
| hsa0414528 | Oral cavity | OSCC | Phagosome | 88/3704 | 152/8465 | 2.83e-04 | 9.13e-04 | 4.65e-04 | 88 |
| hsa0516015 | Oral cavity | OSCC | Hepatitis C | 103/3704 | 157/8465 | 2.17e-08 | 1.96e-07 | 9.99e-08 | 103 |
| hsa04145113 | Oral cavity | OSCC | Phagosome | 88/3704 | 152/8465 | 2.83e-04 | 9.13e-04 | 4.65e-04 | 88 |
| hsa0414529 | Oral cavity | LP | Phagosome | 73/2418 | 152/8465 | 2.37e-07 | 3.29e-06 | 2.12e-06 | 73 |
| hsa0516024 | Oral cavity | LP | Hepatitis C | 73/2418 | 157/8465 | 1.14e-06 | 1.36e-05 | 8.74e-06 | 73 |
| Page: 1 2 |
Top |
Cell-cell communication analysis |
| Identification of potential cell-cell interactions between two cell types and their ligand-receptor pairs for different disease states |
| Ligand | Receptor | LRpair | Pathway | Tissue | Disease Stage |
| Page: 1 |
Top |
Single-cell gene regulatory network inference analysis |
| Find out the significant the regulons (TFs) and the target genes of each regulon across cell types for different disease states |
| TF | Cell Type | Tissue | Disease Stage | Target Gene | RSS | Regulon Activity |
| ∗The dot plots of a searched regulon are shown for all cell subpopulations in each disease state of each tissue based on the regulon specific score inferred using pySCENIC and by calculating the average expression. |
| Page: 1 |
Top |
Somatic mutation of malignant transformation related genes |
| Annotation of somatic variants for genes involved in malignant transformation |
| Hugo Symbol | Variant Class | Variant Classification | dbSNP RS | HGVSc | HGVSp | HGVSp Short | SWISSPROT | BIOTYPE | SIFT | PolyPhen | Tumor Sample Barcode | Tissue | Histology | Sex | Age | Stage | Therapy Types | Drugs | Outcome |
| SCARB1 | SNV | Missense_Mutation | c.1234C>G | p.Pro412Ala | p.P412A | Q8WTV0 | protein_coding | deleterious(0) | probably_damaging(1) | TCGA-A8-A0AD-01 | Breast | breast invasive carcinoma | Female | >=65 | I/II | Hormone Therapy | tamoxiphen | SD | |
| SCARB1 | SNV | Missense_Mutation | novel | c.556C>T | p.Pro186Ser | p.P186S | Q8WTV0 | protein_coding | tolerated(0.08) | probably_damaging(0.977) | TCGA-AC-A3W5-01 | Breast | breast invasive carcinoma | Female | >=65 | I/II | Chemotherapy | docetaxel | CR |
| SCARB1 | SNV | Missense_Mutation | c.652N>T | p.Leu218Phe | p.L218F | Q8WTV0 | protein_coding | deleterious(0.01) | possibly_damaging(0.856) | TCGA-AO-A0J6-01 | Breast | breast invasive carcinoma | Female | <65 | I/II | Chemotherapy | doxorubicin | SD | |
| SCARB1 | SNV | Missense_Mutation | rs368337422 | c.133N>T | p.Arg45Cys | p.R45C | Q8WTV0 | protein_coding | tolerated(0.09) | benign(0.038) | TCGA-D8-A1XK-01 | Breast | breast invasive carcinoma | Female | <65 | I/II | Chemotherapy | doxorubicine+cyclophosphamide | SD |
| SCARB1 | SNV | Missense_Mutation | novel | c.989N>G | p.Asn330Ser | p.N330S | Q8WTV0 | protein_coding | deleterious(0.02) | probably_damaging(0.991) | TCGA-2W-A8YY-01 | Cervix | cervical & endocervical cancer | Female | <65 | I/II | Chemotherapy | cisplatin | CR |
| SCARB1 | SNV | Missense_Mutation | novel | c.1182G>C | p.Met394Ile | p.M394I | Q8WTV0 | protein_coding | tolerated(1) | benign(0.001) | TCGA-JW-A5VL-01 | Cervix | cervical & endocervical cancer | Female | <65 | I/II | Unknown | Unknown | SD |
| SCARB1 | SNV | Missense_Mutation | c.899G>T | p.Arg300Leu | p.R300L | Q8WTV0 | protein_coding | deleterious(0) | probably_damaging(0.987) | TCGA-A6-2685-01 | Colorectum | colon adenocarcinoma | Female | <65 | I/II | Unknown | Unknown | PD | |
| SCARB1 | SNV | Missense_Mutation | c.1474N>A | p.Glu492Lys | p.E492K | Q8WTV0 | protein_coding | deleterious(0.02) | probably_damaging(0.921) | TCGA-AA-A017-01 | Colorectum | colon adenocarcinoma | Female | <65 | I/II | Unknown | Unknown | SD | |
| SCARB1 | SNV | Missense_Mutation | novel | c.704N>G | p.Asp235Gly | p.D235G | Q8WTV0 | protein_coding | deleterious(0) | benign(0.082) | TCGA-CA-6717-01 | Colorectum | colon adenocarcinoma | Male | <65 | I/II | Chemotherapy | oxaliplatin | CR |
| SCARB1 | SNV | Missense_Mutation | c.280N>C | p.Tyr94His | p.Y94H | Q8WTV0 | protein_coding | deleterious(0) | probably_damaging(0.961) | TCGA-CM-6171-01 | Colorectum | colon adenocarcinoma | Female | >=65 | I/II | Unknown | Unknown | SD |
| Page: 1 2 3 4 5 |
Top |
Related drugs of malignant transformation related genes |
| Identification of chemicals and drugs interact with genes involved in malignant transfromation |
| (DGIdb 4.0) |
| Entrez ID | Symbol | Category | Interaction Types | Drug Claim Name | Drug Name | PMIDs |
| 949 | SCARB1 | TRANSPORTER, CELL SURFACE, DRUGGABLE GENOME | peginterferon alfa-2a | |||
| 949 | SCARB1 | TRANSPORTER, CELL SURFACE, DRUGGABLE GENOME | ribavirin | RIBAVIRIN | ||
| 949 | SCARB1 | TRANSPORTER, CELL SURFACE, DRUGGABLE GENOME | atorvastatin | ATORVASTATIN | 20064494 | |
| 949 | SCARB1 | TRANSPORTER, CELL SURFACE, DRUGGABLE GENOME | fenofibrate | FENOFIBRATE |
| Page: 1 |

Copyright 2023-Present -The University of Texas Health Science Center at Houston |