
|
|||||
|
 | |
| |
| |
| |
| |
| |
|
Gene: SCARA3 |
Gene summary for SCARA3 |
| Gene information | Species | Human | Gene symbol | SCARA3 | Gene ID | 51435 |
| Gene name | scavenger receptor class A member 3 | |
| Gene Alias | APC7 | |
| Cytomap | 8p21.1 | |
| Gene Type | protein-coding | GO ID | GO:0006810 | UniProtAcc | Q6AZY7 |
Top |
Malignant transformation analysis |
| Identification of the aberrant gene expression in precancerous and cancerous lesions by comparing the gene expression of stem-like cells in diseased tissues with normal stem cells |
| Entrez ID | Symbol | Replicates | Species | Organ | Tissue | Adj P-value | Log2FC | Malignancy |
| 51435 | SCARA3 | P1T-E | Human | Esophagus | ESCC | 1.77e-03 | 5.14e-01 | 0.0875 |
| 51435 | SCARA3 | P2T-E | Human | Esophagus | ESCC | 4.96e-17 | 2.81e-01 | 0.1177 |
| 51435 | SCARA3 | P4T-E | Human | Esophagus | ESCC | 2.36e-04 | 7.99e-02 | 0.1323 |
| 51435 | SCARA3 | P8T-E | Human | Esophagus | ESCC | 7.53e-06 | 5.39e-02 | 0.0889 |
| 51435 | SCARA3 | P9T-E | Human | Esophagus | ESCC | 1.20e-02 | 6.60e-02 | 0.1131 |
| 51435 | SCARA3 | P10T-E | Human | Esophagus | ESCC | 1.33e-09 | 8.60e-02 | 0.116 |
| 51435 | SCARA3 | P11T-E | Human | Esophagus | ESCC | 1.77e-03 | 2.60e-01 | 0.1426 |
| 51435 | SCARA3 | P12T-E | Human | Esophagus | ESCC | 8.92e-04 | 1.15e-02 | 0.1122 |
| 51435 | SCARA3 | P21T-E | Human | Esophagus | ESCC | 5.14e-07 | 5.74e-02 | 0.1617 |
| 51435 | SCARA3 | P22T-E | Human | Esophagus | ESCC | 8.94e-04 | -2.73e-02 | 0.1236 |
| 51435 | SCARA3 | P26T-E | Human | Esophagus | ESCC | 1.11e-04 | -3.83e-02 | 0.1276 |
| 51435 | SCARA3 | P27T-E | Human | Esophagus | ESCC | 3.17e-05 | -7.78e-02 | 0.1055 |
| 51435 | SCARA3 | P28T-E | Human | Esophagus | ESCC | 2.74e-09 | 9.96e-02 | 0.1149 |
| 51435 | SCARA3 | P30T-E | Human | Esophagus | ESCC | 3.79e-05 | 3.52e-01 | 0.137 |
| 51435 | SCARA3 | P31T-E | Human | Esophagus | ESCC | 3.86e-03 | -1.01e-02 | 0.1251 |
| 51435 | SCARA3 | P37T-E | Human | Esophagus | ESCC | 4.29e-03 | 1.23e-01 | 0.1371 |
| 51435 | SCARA3 | P39T-E | Human | Esophagus | ESCC | 5.73e-03 | -5.04e-02 | 0.0894 |
| 51435 | SCARA3 | P42T-E | Human | Esophagus | ESCC | 3.07e-03 | 3.55e-01 | 0.1175 |
| 51435 | SCARA3 | P47T-E | Human | Esophagus | ESCC | 1.03e-04 | 5.24e-02 | 0.1067 |
| 51435 | SCARA3 | P48T-E | Human | Esophagus | ESCC | 3.38e-10 | 1.73e-01 | 0.0959 |
| Page: 1 2 |
| Tissue | Expression Dynamics | Abbreviation |
| Esophagus |  | ESCC: Esophageal squamous cell carcinoma |
| HGIN: High-grade intraepithelial neoplasias | ||
| LGIN: Low-grade intraepithelial neoplasias | ||
| Thyroid | 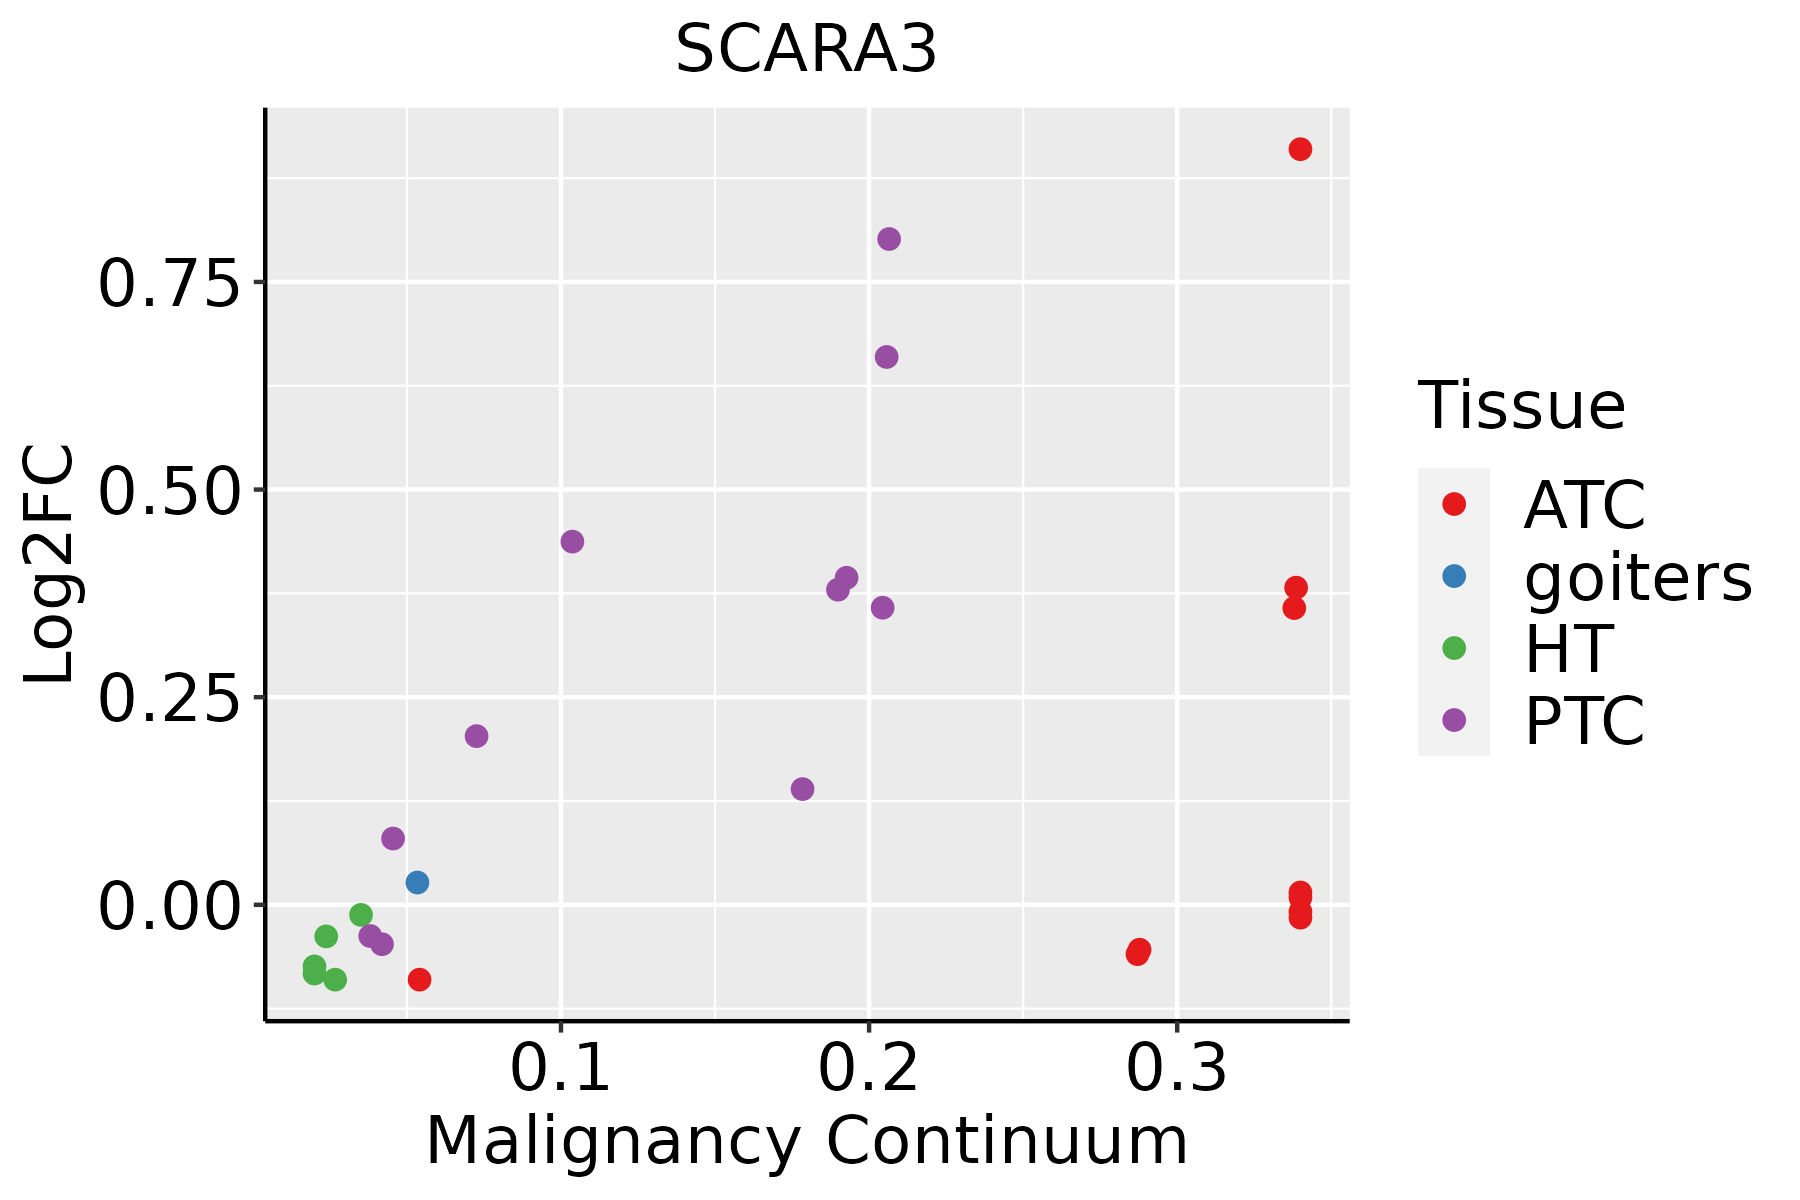 | ATC: Anaplastic thyroid cancer |
| HT: Hashimoto's thyroiditis | ||
| PTC: Papillary thyroid cancer |
| ∗log2FC in expression of this searched gene in stem-like cells from each diseased tissue sample relative to stem-like cells in normal samples in each tissue plotted against the malignancy continuum. Samples are colored based on if they are from different disease stage. |
Top |
Malignant transformation related pathway analysis |
| Find out the enriched GO biological processes and KEGG pathways involved in transition from healthy to precancer to cancer |
| Tissue | Disease Stage | Enriched GO biological Processes |
| Colorectum | AD |  |
| Colorectum | SER |  |
| Colorectum | MSS |  |
| Colorectum | MSI-H |  |
| Colorectum | FAP |  |
| ∗Top 15 enriched GO BP terms are showed in the bar plot of each disease state in each tissue. Each row represents a significant GO biological process which is colored according to the -log10(p.adjust). |
| Page: 1 2 3 4 5 6 7 8 9 |
| GO ID | Tissue | Disease Stage | Description | Gene Ratio | Bg Ratio | pvalue | p.adjust | Count |
| GO:0006979111 | Esophagus | ESCC | response to oxidative stress | 303/8552 | 446/18723 | 7.15e-22 | 1.30e-19 | 303 |
| GO:000941113 | Esophagus | ESCC | response to UV | 115/8552 | 149/18723 | 3.29e-15 | 1.93e-13 | 115 |
| GO:000931419 | Esophagus | ESCC | response to radiation | 277/8552 | 456/18723 | 4.42e-11 | 1.43e-09 | 277 |
| GO:000941611 | Esophagus | ESCC | response to light stimulus | 183/8552 | 320/18723 | 2.03e-05 | 1.76e-04 | 183 |
| GO:0009650 | Esophagus | ESCC | UV protection | 12/8552 | 13/18723 | 6.18e-04 | 3.32e-03 | 12 |
| GO:0006979113 | Thyroid | PTC | response to oxidative stress | 234/5968 | 446/18723 | 6.97e-20 | 9.77e-18 | 234 |
| GO:0009314111 | Thyroid | PTC | response to radiation | 195/5968 | 456/18723 | 5.10e-07 | 8.27e-06 | 195 |
| GO:00094117 | Thyroid | PTC | response to UV | 76/5968 | 149/18723 | 8.97e-07 | 1.36e-05 | 76 |
| GO:00094167 | Thyroid | PTC | response to light stimulus | 127/5968 | 320/18723 | 1.76e-03 | 9.58e-03 | 127 |
| GO:000697934 | Thyroid | ATC | response to oxidative stress | 246/6293 | 446/18723 | 2.98e-21 | 6.09e-19 | 246 |
| GO:000941115 | Thyroid | ATC | response to UV | 84/6293 | 149/18723 | 8.97e-09 | 1.90e-07 | 84 |
| GO:000931426 | Thyroid | ATC | response to radiation | 210/6293 | 456/18723 | 1.69e-08 | 3.39e-07 | 210 |
| GO:000941613 | Thyroid | ATC | response to light stimulus | 139/6293 | 320/18723 | 1.42e-04 | 9.88e-04 | 139 |
| Page: 1 |
| Pathway ID | Tissue | Disease Stage | Description | Gene Ratio | Bg Ratio | pvalue | p.adjust | qvalue | Count |
| Page: 1 |
Top |
Cell-cell communication analysis |
| Identification of potential cell-cell interactions between two cell types and their ligand-receptor pairs for different disease states |
| Ligand | Receptor | LRpair | Pathway | Tissue | Disease Stage |
| Page: 1 |
Top |
Single-cell gene regulatory network inference analysis |
| Find out the significant the regulons (TFs) and the target genes of each regulon across cell types for different disease states |
| TF | Cell Type | Tissue | Disease Stage | Target Gene | RSS | Regulon Activity |
| ∗The dot plots of a searched regulon are shown for all cell subpopulations in each disease state of each tissue based on the regulon specific score inferred using pySCENIC and by calculating the average expression. |
| Page: 1 |
Top |
Somatic mutation of malignant transformation related genes |
| Annotation of somatic variants for genes involved in malignant transformation |
| Hugo Symbol | Variant Class | Variant Classification | dbSNP RS | HGVSc | HGVSp | HGVSp Short | SWISSPROT | BIOTYPE | SIFT | PolyPhen | Tumor Sample Barcode | Tissue | Histology | Sex | Age | Stage | Therapy Types | Drugs | Outcome |
| SCARA3 | SNV | Missense_Mutation | c.233N>A | p.Arg78Lys | p.R78K | Q6AZY7 | protein_coding | tolerated(0.45) | benign(0) | TCGA-AC-A23H-01 | Breast | breast invasive carcinoma | Female | >=65 | I/II | Unknown | Unknown | PD | |
| SCARA3 | SNV | Missense_Mutation | rs774402743 | c.1141N>A | p.Val381Met | p.V381M | Q6AZY7 | protein_coding | deleterious(0.03) | probably_damaging(0.925) | TCGA-D8-A142-01 | Breast | breast invasive carcinoma | Female | >=65 | I/II | Chemotherapy | cyclophosphamid | SD |
| SCARA3 | SNV | Missense_Mutation | c.1673N>T | p.Ser558Leu | p.S558L | Q6AZY7 | protein_coding | tolerated(0.32) | benign(0) | TCGA-E2-A159-01 | Breast | breast invasive carcinoma | Female | <65 | I/II | Chemotherapy | cyclophosphamide | SD | |
| SCARA3 | insertion | Frame_Shift_Ins | novel | c.862_863insCTTTTATTATAGCATACTGTTCTAAT | p.Gln288ProfsTer121 | p.Q288Pfs*121 | Q6AZY7 | protein_coding | TCGA-A8-A0A1-01 | Breast | breast invasive carcinoma | Female | >=65 | I/II | Hormone Therapy | tamoxiphen | SD | ||
| SCARA3 | insertion | In_Frame_Ins | novel | c.961_962insTCACCCAGGAGTGCT | p.His321delinsLeuThrGlnGluCysTyr | p.H321delinsLTQECY | Q6AZY7 | protein_coding | TCGA-AN-A0FX-01 | Breast | breast invasive carcinoma | Female | <65 | I/II | Unknown | Unknown | SD | ||
| SCARA3 | SNV | Missense_Mutation | novel | c.1025N>T | p.Arg342Met | p.R342M | Q6AZY7 | protein_coding | deleterious(0) | probably_damaging(0.986) | TCGA-2W-A8YY-01 | Cervix | cervical & endocervical cancer | Female | <65 | I/II | Chemotherapy | cisplatin | CR |
| SCARA3 | SNV | Missense_Mutation | rs750778244 | c.1378N>A | p.Gly460Ser | p.G460S | Q6AZY7 | protein_coding | deleterious(0.03) | probably_damaging(0.913) | TCGA-EA-A3HS-01 | Cervix | cervical & endocervical cancer | Female | <65 | I/II | Unknown | Unknown | SD |
| SCARA3 | SNV | Missense_Mutation | novel | c.1591G>A | p.Gly531Arg | p.G531R | Q6AZY7 | protein_coding | tolerated(0.35) | benign(0.243) | TCGA-UC-A7PG-06 | Cervix | cervical & endocervical cancer | Female | <65 | III/IV | Chemotherapy | cisplatin | PD |
| SCARA3 | SNV | Missense_Mutation | rs146536900 | c.121N>T | p.Arg41Cys | p.R41C | Q6AZY7 | protein_coding | tolerated(0.05) | benign(0.153) | TCGA-A6-6137-01 | Colorectum | colon adenocarcinoma | Male | <65 | III/IV | Chemotherapy | fluorouracil | SD |
| SCARA3 | SNV | Missense_Mutation | c.1060N>A | p.Glu354Lys | p.E354K | Q6AZY7 | protein_coding | deleterious(0.01) | possibly_damaging(0.771) | TCGA-AA-3977-01 | Colorectum | colon adenocarcinoma | Male | >=65 | I/II | Unknown | Unknown | SD |
| Page: 1 2 3 4 5 6 |
Top |
Related drugs of malignant transformation related genes |
| Identification of chemicals and drugs interact with genes involved in malignant transfromation |
| (DGIdb 4.0) |
| Entrez ID | Symbol | Category | Interaction Types | Drug Claim Name | Drug Name | PMIDs |
| Page: 1 |

Copyright 2023-Present -The University of Texas Health Science Center at Houston |