
|
|||||
|
 | |
| |
| |
| |
| |
| |
|
Gene: SCAPER |
Gene summary for SCAPER |
| Gene information | Species | Human | Gene symbol | SCAPER | Gene ID | 49855 |
| Gene name | S-phase cyclin A associated protein in the ER | |
| Gene Alias | IDDRP | |
| Cytomap | 15q24.3 | |
| Gene Type | protein-coding | GO ID | GO:0005575 | UniProtAcc | Q9BY12 |
Top |
Malignant transformation analysis |
| Identification of the aberrant gene expression in precancerous and cancerous lesions by comparing the gene expression of stem-like cells in diseased tissues with normal stem cells |
| Entrez ID | Symbol | Replicates | Species | Organ | Tissue | Adj P-value | Log2FC | Malignancy |
| 49855 | SCAPER | CCI_1 | Human | Cervix | CC | 1.87e-09 | 1.48e+00 | 0.528 |
| 49855 | SCAPER | CCI_3 | Human | Cervix | CC | 5.49e-13 | 1.01e+00 | 0.516 |
| 49855 | SCAPER | HTA11_3410_2000001011 | Human | Colorectum | AD | 1.66e-12 | -6.18e-01 | 0.0155 |
| 49855 | SCAPER | HTA11_2487_2000001011 | Human | Colorectum | SER | 3.15e-02 | -4.56e-01 | -0.1808 |
| 49855 | SCAPER | HTA11_3361_2000001011 | Human | Colorectum | AD | 4.77e-07 | -6.54e-01 | -0.1207 |
| 49855 | SCAPER | HTA11_5212_2000001011 | Human | Colorectum | AD | 1.65e-02 | -6.09e-01 | -0.2061 |
| 49855 | SCAPER | HTA11_866_3004761011 | Human | Colorectum | AD | 7.36e-10 | -5.65e-01 | 0.096 |
| 49855 | SCAPER | HTA11_10711_2000001011 | Human | Colorectum | AD | 3.74e-03 | -4.50e-01 | 0.0338 |
| 49855 | SCAPER | HTA11_7696_3000711011 | Human | Colorectum | AD | 3.59e-09 | -4.63e-01 | 0.0674 |
| 49855 | SCAPER | HTA11_99999970781_79442 | Human | Colorectum | MSS | 5.61e-03 | -3.59e-01 | 0.294 |
| 49855 | SCAPER | HTA11_99999971662_82457 | Human | Colorectum | MSS | 1.90e-23 | -6.86e-01 | 0.3859 |
| 49855 | SCAPER | HTA11_99999974143_84620 | Human | Colorectum | MSS | 2.37e-07 | -4.74e-01 | 0.3005 |
| 49855 | SCAPER | A015-C-203 | Human | Colorectum | FAP | 9.99e-24 | -2.62e-01 | -0.1294 |
| 49855 | SCAPER | A015-C-204 | Human | Colorectum | FAP | 9.84e-05 | -2.05e-01 | -0.0228 |
| 49855 | SCAPER | A014-C-040 | Human | Colorectum | FAP | 2.19e-03 | -3.99e-02 | -0.1184 |
| 49855 | SCAPER | A002-C-201 | Human | Colorectum | FAP | 1.95e-10 | -2.22e-01 | 0.0324 |
| 49855 | SCAPER | A001-C-119 | Human | Colorectum | FAP | 2.68e-03 | -1.32e-01 | -0.1557 |
| 49855 | SCAPER | A001-C-108 | Human | Colorectum | FAP | 8.33e-12 | -3.07e-02 | -0.0272 |
| 49855 | SCAPER | A002-C-205 | Human | Colorectum | FAP | 9.44e-20 | -2.19e-01 | -0.1236 |
| 49855 | SCAPER | A015-C-006 | Human | Colorectum | FAP | 5.27e-15 | -4.68e-01 | -0.0994 |
| Page: 1 2 3 4 5 6 7 8 9 |
| Tissue | Expression Dynamics | Abbreviation |
| Cervix |  | CC: Cervix cancer |
| HSIL_HPV: HPV-infected high-grade squamous intraepithelial lesions | ||
| N_HPV: HPV-infected normal cervix | ||
| Colorectum (GSE201348) |  | FAP: Familial adenomatous polyposis |
| CRC: Colorectal cancer | ||
| Colorectum (HTA11) |  | AD: Adenomas |
| SER: Sessile serrated lesions | ||
| MSI-H: Microsatellite-high colorectal cancer | ||
| MSS: Microsatellite stable colorectal cancer | ||
| Endometrium |  | AEH: Atypical endometrial hyperplasia |
| EEC: Endometrioid Cancer | ||
| Esophagus |  | ESCC: Esophageal squamous cell carcinoma |
| HGIN: High-grade intraepithelial neoplasias | ||
| LGIN: Low-grade intraepithelial neoplasias | ||
| Liver |  | HCC: Hepatocellular carcinoma |
| NAFLD: Non-alcoholic fatty liver disease | ||
| Lung |  | AAH: Atypical adenomatous hyperplasia |
| AIS: Adenocarcinoma in situ | ||
| IAC: Invasive lung adenocarcinoma | ||
| MIA: Minimally invasive adenocarcinoma | ||
| Prostate | 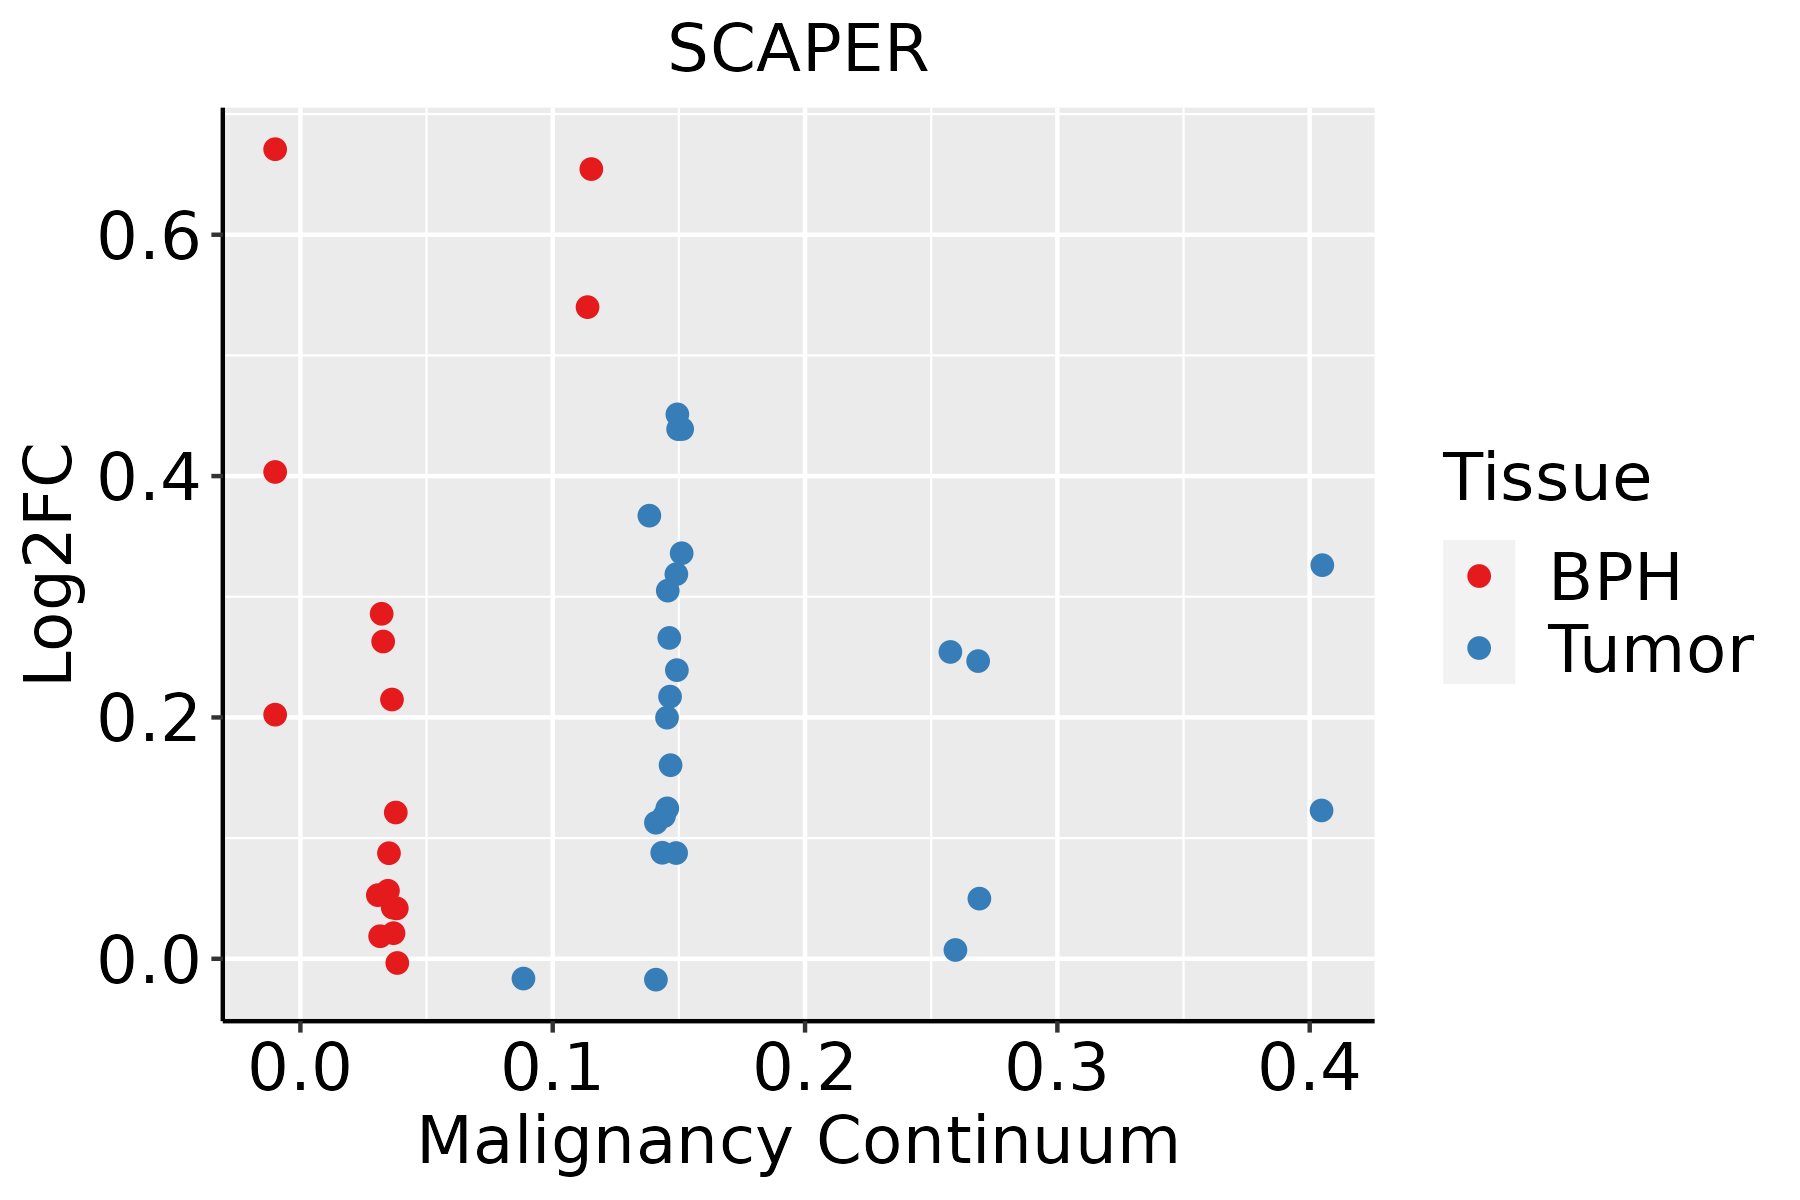 | BPH: Benign Prostatic Hyperplasia |
| Thyroid |  | ATC: Anaplastic thyroid cancer |
| HT: Hashimoto's thyroiditis | ||
| PTC: Papillary thyroid cancer |
| ∗log2FC in expression of this searched gene in stem-like cells from each diseased tissue sample relative to stem-like cells in normal samples in each tissue plotted against the malignancy continuum. Samples are colored based on if they are from different disease stage. |
Top |
Malignant transformation related pathway analysis |
| Find out the enriched GO biological processes and KEGG pathways involved in transition from healthy to precancer to cancer |
| Tissue | Disease Stage | Enriched GO biological Processes |
| Colorectum | AD |  |
| Colorectum | SER |  |
| Colorectum | MSS |  |
| Colorectum | MSI-H |  |
| Colorectum | FAP |  |
| ∗Top 15 enriched GO BP terms are showed in the bar plot of each disease state in each tissue. Each row represents a significant GO biological process which is colored according to the -log10(p.adjust). |
| Page: 1 2 3 4 5 6 7 8 9 |
| GO ID | Tissue | Disease Stage | Description | Gene Ratio | Bg Ratio | pvalue | p.adjust | Count |
| Page: 1 |
| Pathway ID | Tissue | Disease Stage | Description | Gene Ratio | Bg Ratio | pvalue | p.adjust | qvalue | Count |
| Page: 1 |
Top |
Cell-cell communication analysis |
| Identification of potential cell-cell interactions between two cell types and their ligand-receptor pairs for different disease states |
| Ligand | Receptor | LRpair | Pathway | Tissue | Disease Stage |
| Page: 1 |
Top |
Single-cell gene regulatory network inference analysis |
| Find out the significant the regulons (TFs) and the target genes of each regulon across cell types for different disease states |
| TF | Cell Type | Tissue | Disease Stage | Target Gene | RSS | Regulon Activity |
| ∗The dot plots of a searched regulon are shown for all cell subpopulations in each disease state of each tissue based on the regulon specific score inferred using pySCENIC and by calculating the average expression. |
| Page: 1 |
Top |
Somatic mutation of malignant transformation related genes |
| Annotation of somatic variants for genes involved in malignant transformation |
| Hugo Symbol | Variant Class | Variant Classification | dbSNP RS | HGVSc | HGVSp | HGVSp Short | SWISSPROT | BIOTYPE | SIFT | PolyPhen | Tumor Sample Barcode | Tissue | Histology | Sex | Age | Stage | Therapy Types | Drugs | Outcome |
| SCAPER | SNV | Missense_Mutation | rs758863663 | c.1685N>A | p.Arg562His | p.R562H | Q9BY12 | protein_coding | tolerated(0.11) | benign(0.347) | TCGA-A1-A0SH-01 | Breast | breast invasive carcinoma | Female | <65 | I/II | Chemotherapy | tc | SD |
| SCAPER | SNV | Missense_Mutation | c.649N>G | p.Pro217Ala | p.P217A | Q9BY12 | protein_coding | tolerated(0.29) | benign(0.005) | TCGA-A2-A0CX-01 | Breast | breast invasive carcinoma | Female | <65 | I/II | Chemotherapy | adriamycin | SD | |
| SCAPER | SNV | Missense_Mutation | c.1972N>C | p.Glu658Gln | p.E658Q | Q9BY12 | protein_coding | deleterious(0.01) | possibly_damaging(0.899) | TCGA-A2-A0EQ-01 | Breast | breast invasive carcinoma | Female | <65 | I/II | Chemotherapy | adriamycin | SD | |
| SCAPER | SNV | Missense_Mutation | novel | c.1465N>T | p.Asp489Tyr | p.D489Y | Q9BY12 | protein_coding | deleterious(0) | probably_damaging(0.976) | TCGA-A8-A06X-01 | Breast | breast invasive carcinoma | Female | >=65 | I/II | Unknown | Unknown | SD |
| SCAPER | SNV | Missense_Mutation | c.649C>T | p.Pro217Ser | p.P217S | Q9BY12 | protein_coding | tolerated(0.59) | benign(0.005) | TCGA-A8-A094-01 | Breast | breast invasive carcinoma | Female | >=65 | I/II | Unknown | Unknown | SD | |
| SCAPER | SNV | Missense_Mutation | rs532766890 | c.868G>A | p.Glu290Lys | p.E290K | Q9BY12 | protein_coding | tolerated(0.49) | benign(0.272) | TCGA-A8-A096-01 | Breast | breast invasive carcinoma | Female | >=65 | I/II | Unknown | Unknown | SD |
| SCAPER | SNV | Missense_Mutation | novel | c.1804G>A | p.Glu602Lys | p.E602K | Q9BY12 | protein_coding | deleterious(0.02) | possibly_damaging(0.908) | TCGA-AC-A5XS-01 | Breast | breast invasive carcinoma | Female | >=65 | I/II | Hormone Therapy | femara | SD |
| SCAPER | SNV | Missense_Mutation | novel | c.596G>A | p.Arg199Gln | p.R199Q | Q9BY12 | protein_coding | deleterious(0) | probably_damaging(0.973) | TCGA-AN-A046-01 | Breast | breast invasive carcinoma | Female | >=65 | I/II | Unknown | Unknown | SD |
| SCAPER | SNV | Missense_Mutation | c.1951A>G | p.Arg651Gly | p.R651G | Q9BY12 | protein_coding | deleterious(0) | probably_damaging(0.98) | TCGA-AN-A0AS-01 | Breast | breast invasive carcinoma | Female | >=65 | III/IV | Unknown | Unknown | SD | |
| SCAPER | SNV | Missense_Mutation | c.1700N>C | p.Leu567Ser | p.L567S | Q9BY12 | protein_coding | tolerated(0.37) | possibly_damaging(0.503) | TCGA-BH-A18G-01 | Breast | breast invasive carcinoma | Female | >=65 | I/II | Unknown | Unknown | SD |
| Page: 1 2 3 4 5 6 7 8 9 10 11 12 13 14 15 16 |
Top |
Related drugs of malignant transformation related genes |
| Identification of chemicals and drugs interact with genes involved in malignant transfromation |
| (DGIdb 4.0) |
| Entrez ID | Symbol | Category | Interaction Types | Drug Claim Name | Drug Name | PMIDs |
| Page: 1 |

Copyright 2023-Present -The University of Texas Health Science Center at Houston |