
|
|||||
|
 | |
| |
| |
| |
| |
| |
|
Gene: SCAMP2 |
Gene summary for SCAMP2 |
| Gene information | Species | Human | Gene symbol | SCAMP2 | Gene ID | 10066 |
| Gene name | secretory carrier membrane protein 2 | |
| Gene Alias | SCAMP2 | |
| Cytomap | 15q24.1 | |
| Gene Type | protein-coding | GO ID | GO:0006810 | UniProtAcc | A8K769 |
Top |
Malignant transformation analysis |
| Identification of the aberrant gene expression in precancerous and cancerous lesions by comparing the gene expression of stem-like cells in diseased tissues with normal stem cells |
| Entrez ID | Symbol | Replicates | Species | Organ | Tissue | Adj P-value | Log2FC | Malignancy |
| 10066 | SCAMP2 | HTA11_3410_2000001011 | Human | Colorectum | AD | 8.17e-06 | 3.53e-01 | 0.0155 |
| 10066 | SCAMP2 | HTA11_2487_2000001011 | Human | Colorectum | SER | 7.45e-30 | 1.19e+00 | -0.1808 |
| 10066 | SCAMP2 | HTA11_1938_2000001011 | Human | Colorectum | AD | 4.93e-19 | 9.54e-01 | -0.0811 |
| 10066 | SCAMP2 | HTA11_78_2000001011 | Human | Colorectum | AD | 2.97e-13 | 7.06e-01 | -0.1088 |
| 10066 | SCAMP2 | HTA11_347_2000001011 | Human | Colorectum | AD | 3.64e-53 | 1.27e+00 | -0.1954 |
| 10066 | SCAMP2 | HTA11_411_2000001011 | Human | Colorectum | SER | 2.74e-12 | 1.90e+00 | -0.2602 |
| 10066 | SCAMP2 | HTA11_2112_2000001011 | Human | Colorectum | SER | 8.13e-08 | 1.05e+00 | -0.2196 |
| 10066 | SCAMP2 | HTA11_3361_2000001011 | Human | Colorectum | AD | 5.14e-19 | 9.02e-01 | -0.1207 |
| 10066 | SCAMP2 | HTA11_83_2000001011 | Human | Colorectum | SER | 8.04e-15 | 8.48e-01 | -0.1526 |
| 10066 | SCAMP2 | HTA11_696_2000001011 | Human | Colorectum | AD | 1.40e-44 | 1.17e+00 | -0.1464 |
| 10066 | SCAMP2 | HTA11_866_2000001011 | Human | Colorectum | AD | 1.91e-20 | 8.42e-01 | -0.1001 |
| 10066 | SCAMP2 | HTA11_1391_2000001011 | Human | Colorectum | AD | 1.62e-27 | 1.03e+00 | -0.059 |
| 10066 | SCAMP2 | HTA11_2992_2000001011 | Human | Colorectum | SER | 5.98e-05 | 8.65e-01 | -0.1706 |
| 10066 | SCAMP2 | HTA11_5212_2000001011 | Human | Colorectum | AD | 2.82e-15 | 1.10e+00 | -0.2061 |
| 10066 | SCAMP2 | HTA11_5216_2000001011 | Human | Colorectum | SER | 2.61e-13 | 1.09e+00 | -0.1462 |
| 10066 | SCAMP2 | HTA11_546_2000001011 | Human | Colorectum | AD | 1.70e-18 | 1.10e+00 | -0.0842 |
| 10066 | SCAMP2 | HTA11_7862_2000001011 | Human | Colorectum | AD | 3.34e-07 | 5.71e-01 | -0.0179 |
| 10066 | SCAMP2 | HTA11_866_3004761011 | Human | Colorectum | AD | 2.23e-19 | 6.51e-01 | 0.096 |
| 10066 | SCAMP2 | HTA11_9408_2000001011 | Human | Colorectum | AD | 1.55e-02 | 4.98e-01 | 0.0451 |
| 10066 | SCAMP2 | HTA11_8622_2000001021 | Human | Colorectum | SER | 5.59e-05 | 6.27e-01 | 0.0528 |
| Page: 1 2 3 4 5 6 7 8 9 |
| Tissue | Expression Dynamics | Abbreviation |
| Colorectum (GSE201348) | 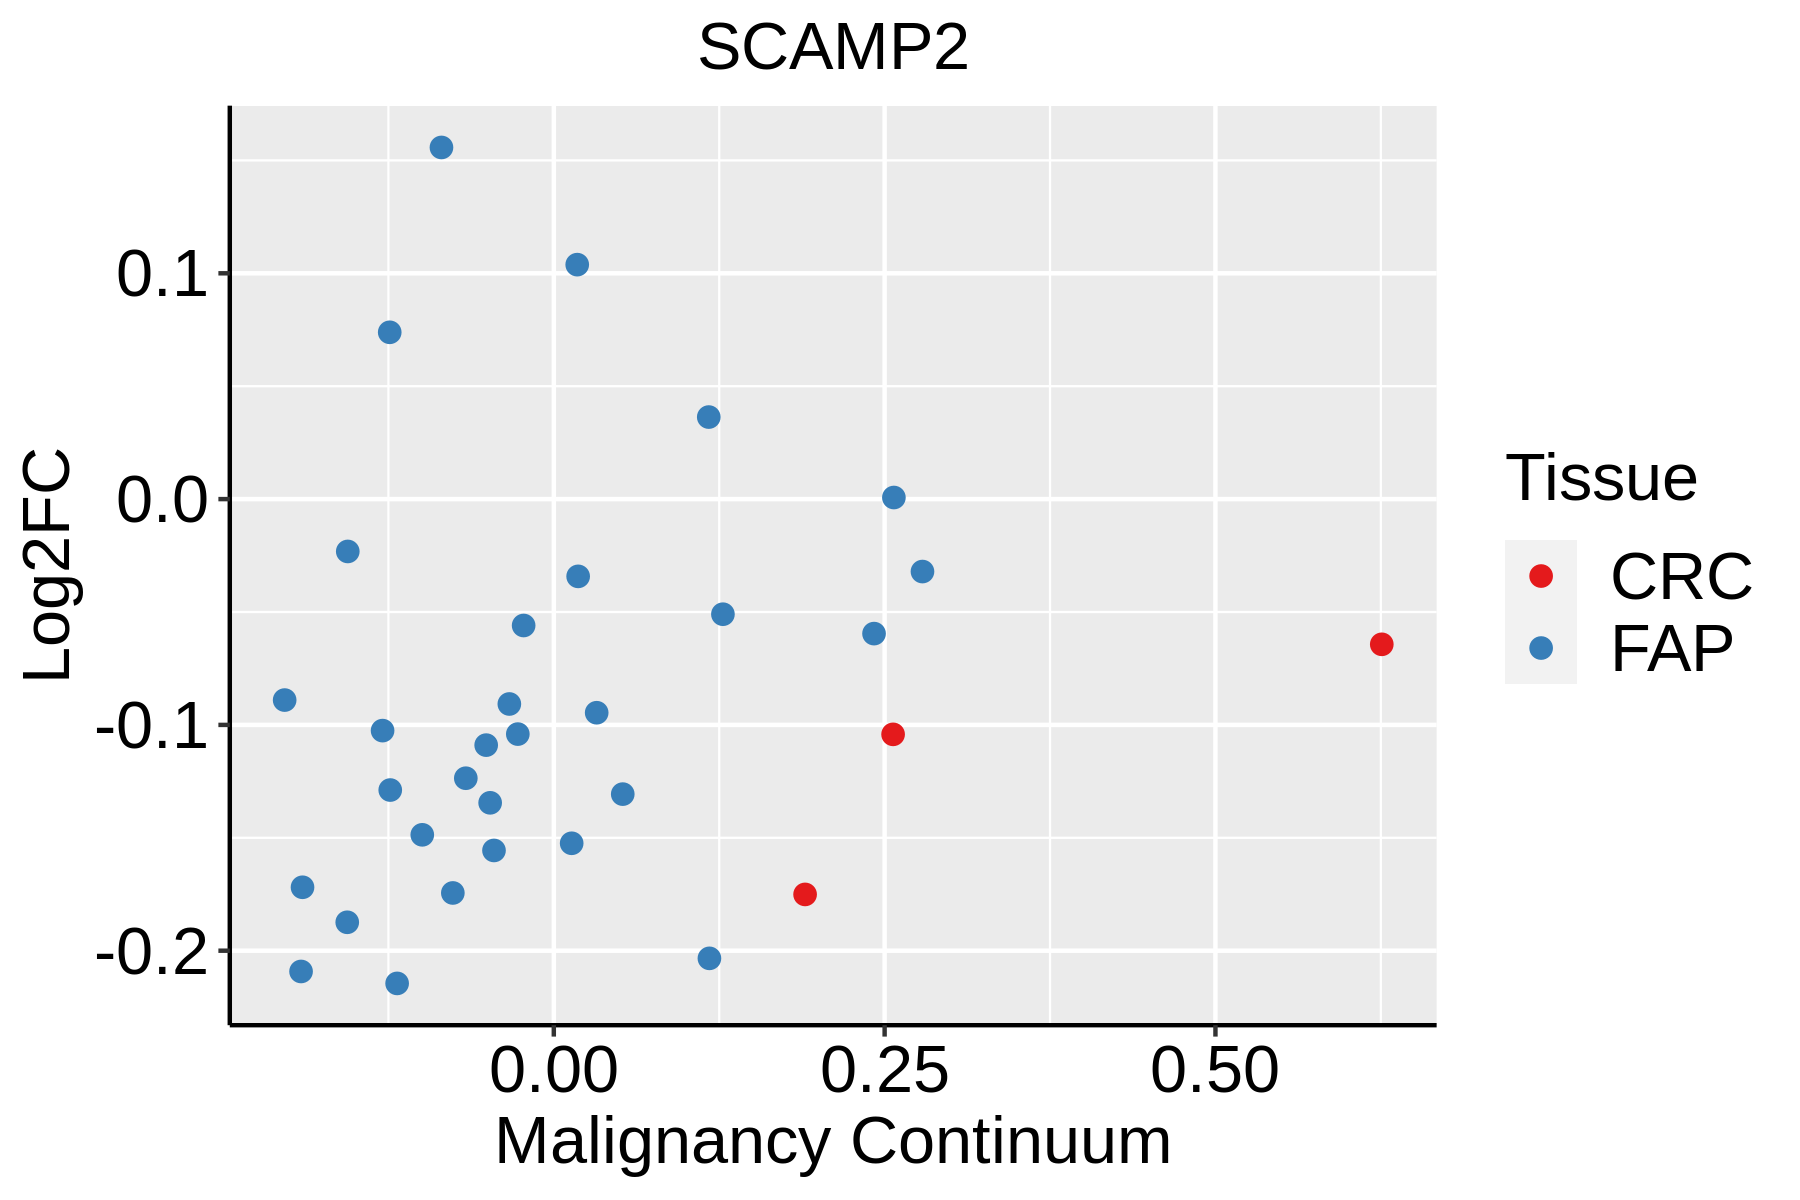 | FAP: Familial adenomatous polyposis |
| CRC: Colorectal cancer | ||
| Colorectum (HTA11) |  | AD: Adenomas |
| SER: Sessile serrated lesions | ||
| MSI-H: Microsatellite-high colorectal cancer | ||
| MSS: Microsatellite stable colorectal cancer | ||
| Esophagus | 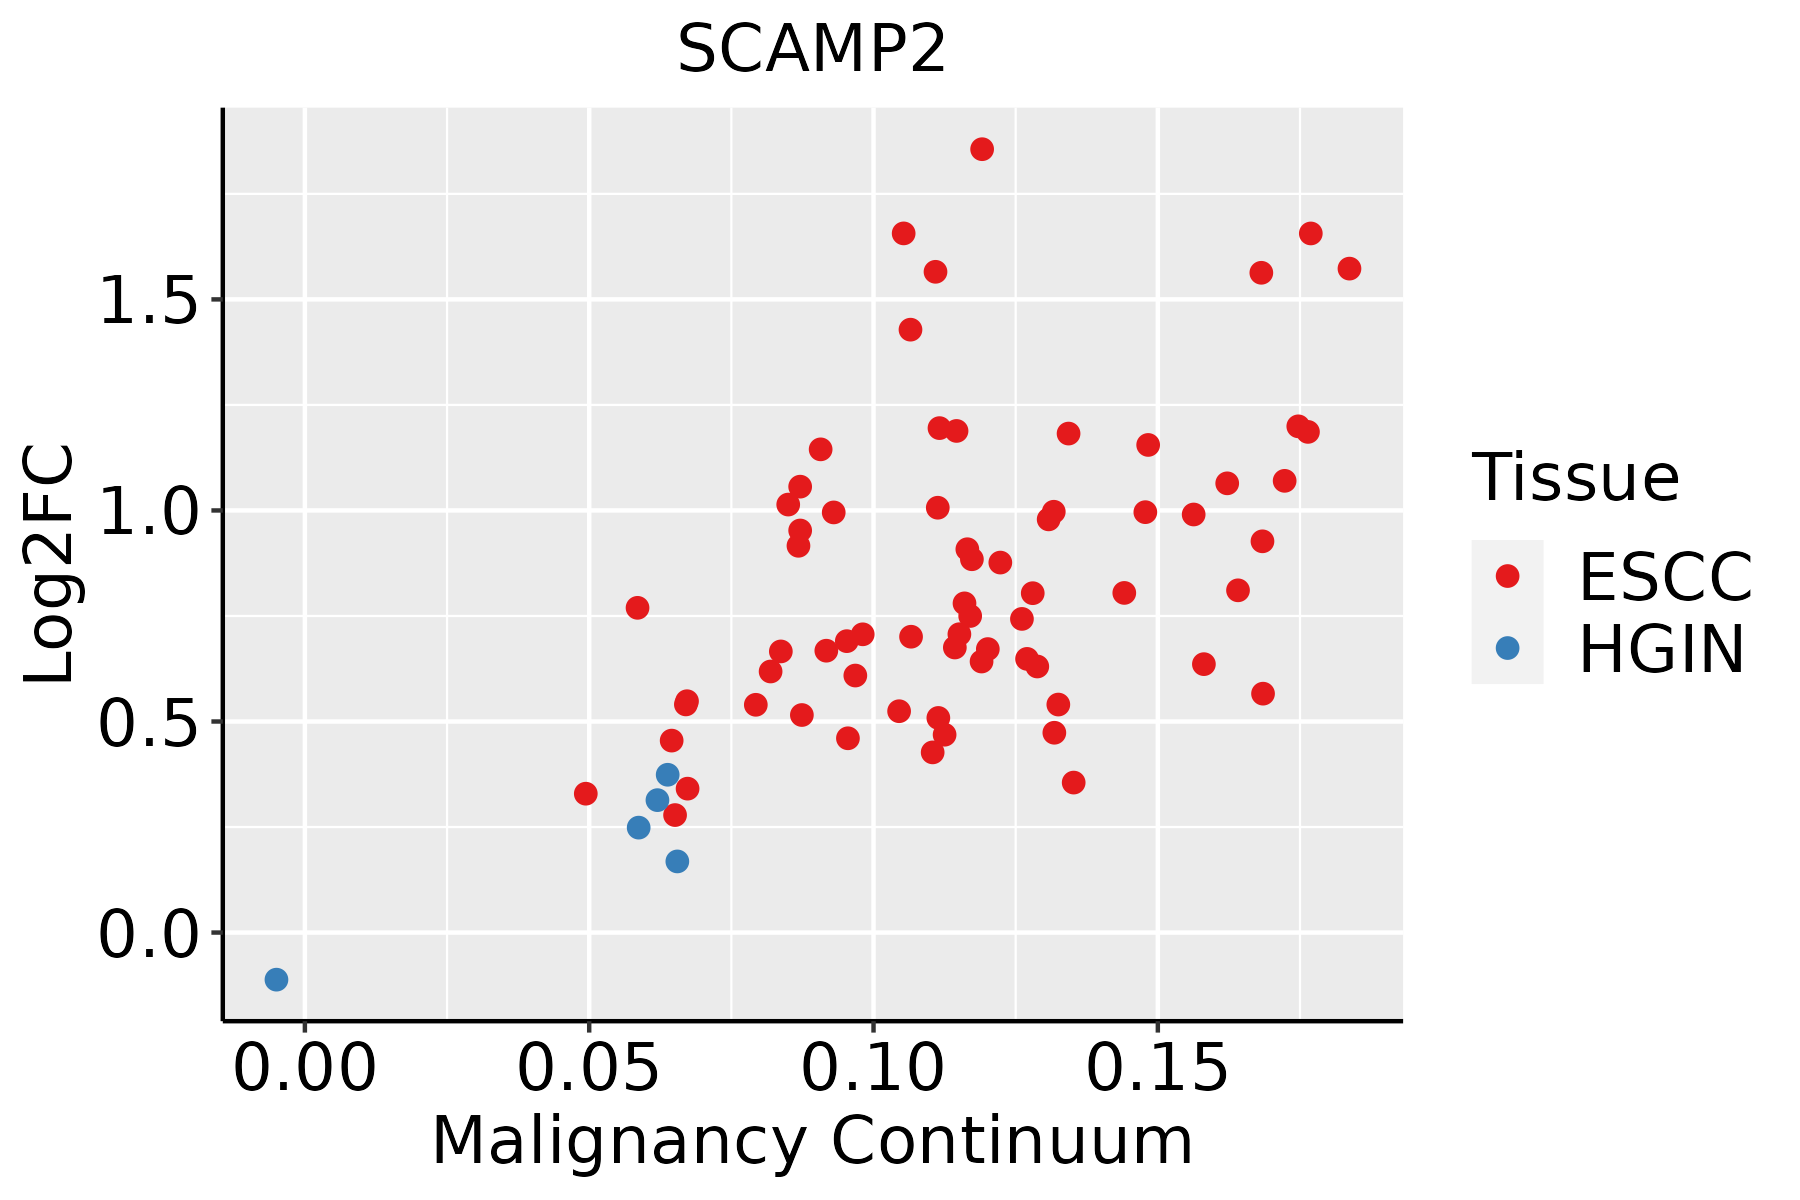 | ESCC: Esophageal squamous cell carcinoma |
| HGIN: High-grade intraepithelial neoplasias | ||
| LGIN: Low-grade intraepithelial neoplasias | ||
| Liver | 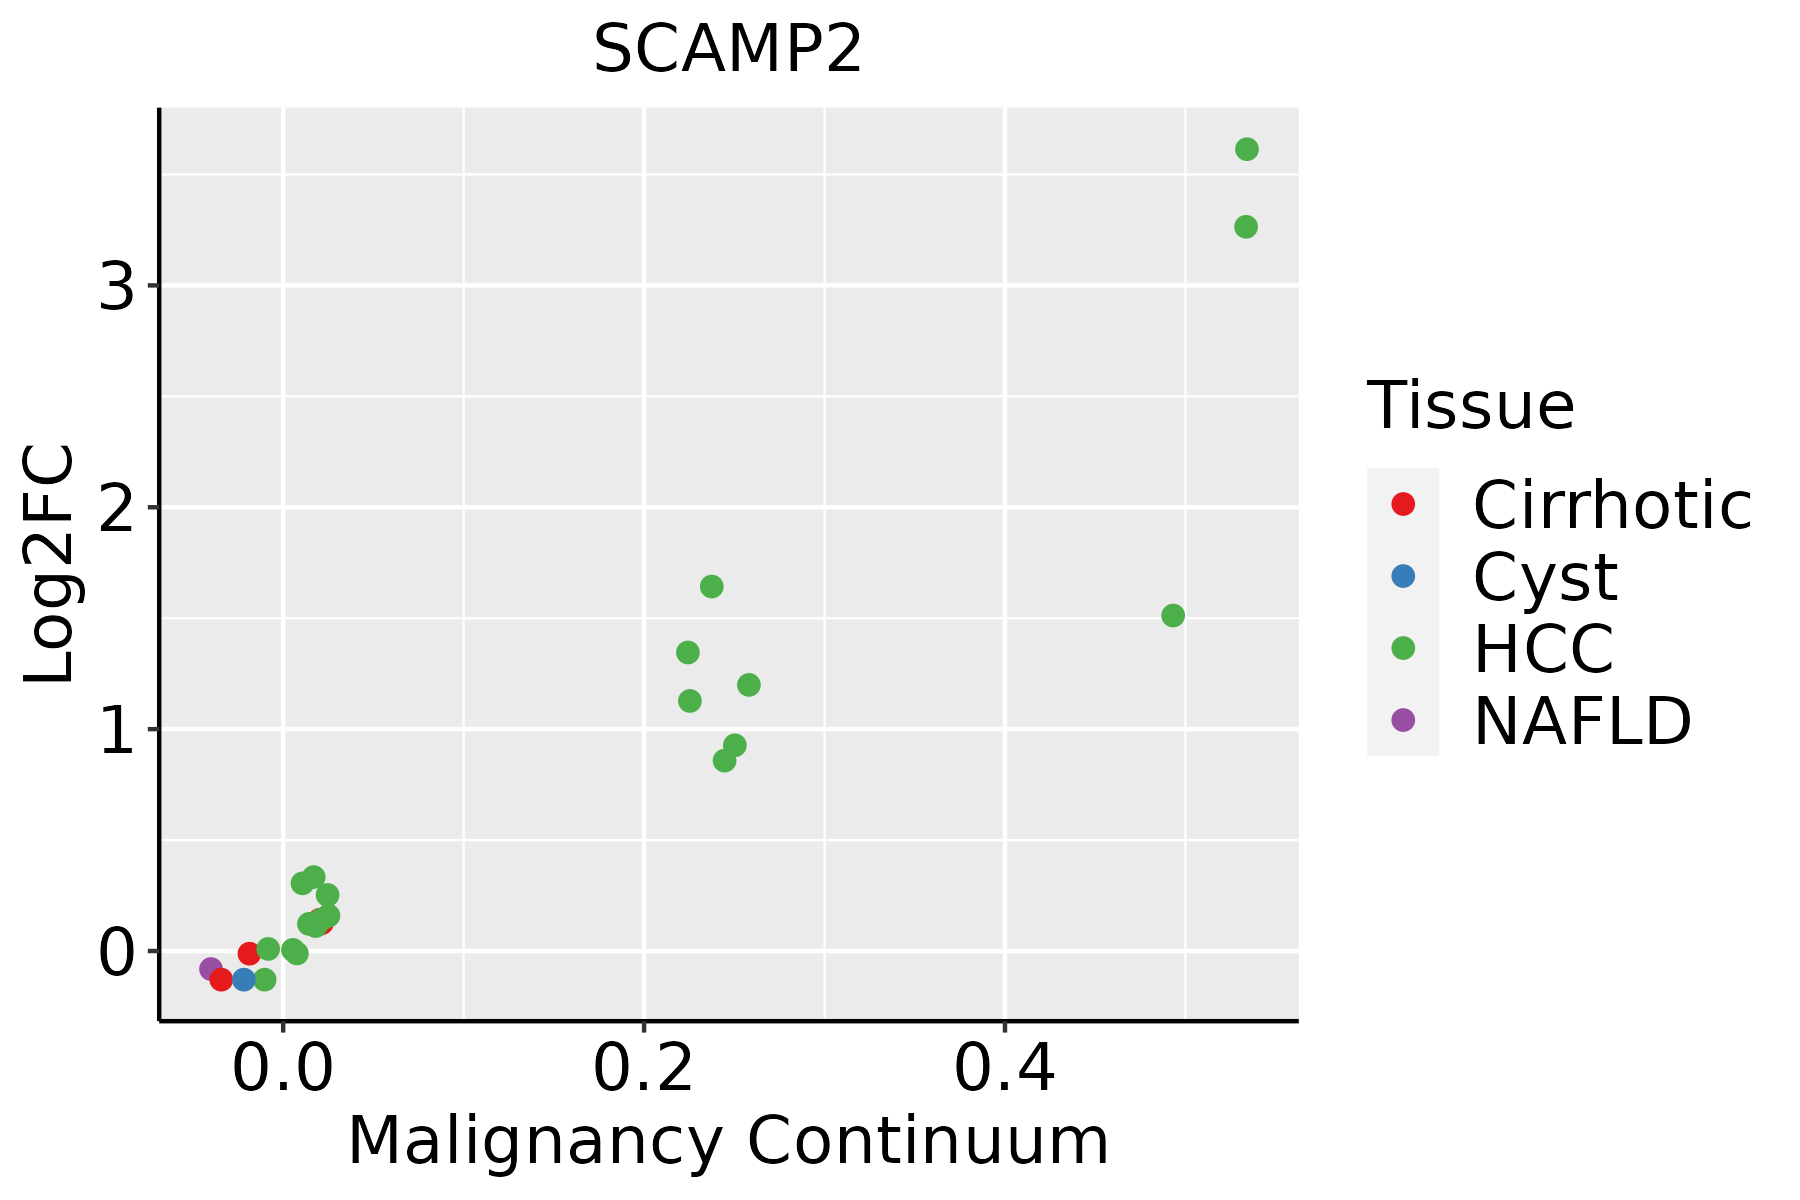 | HCC: Hepatocellular carcinoma |
| NAFLD: Non-alcoholic fatty liver disease | ||
| Oral Cavity | 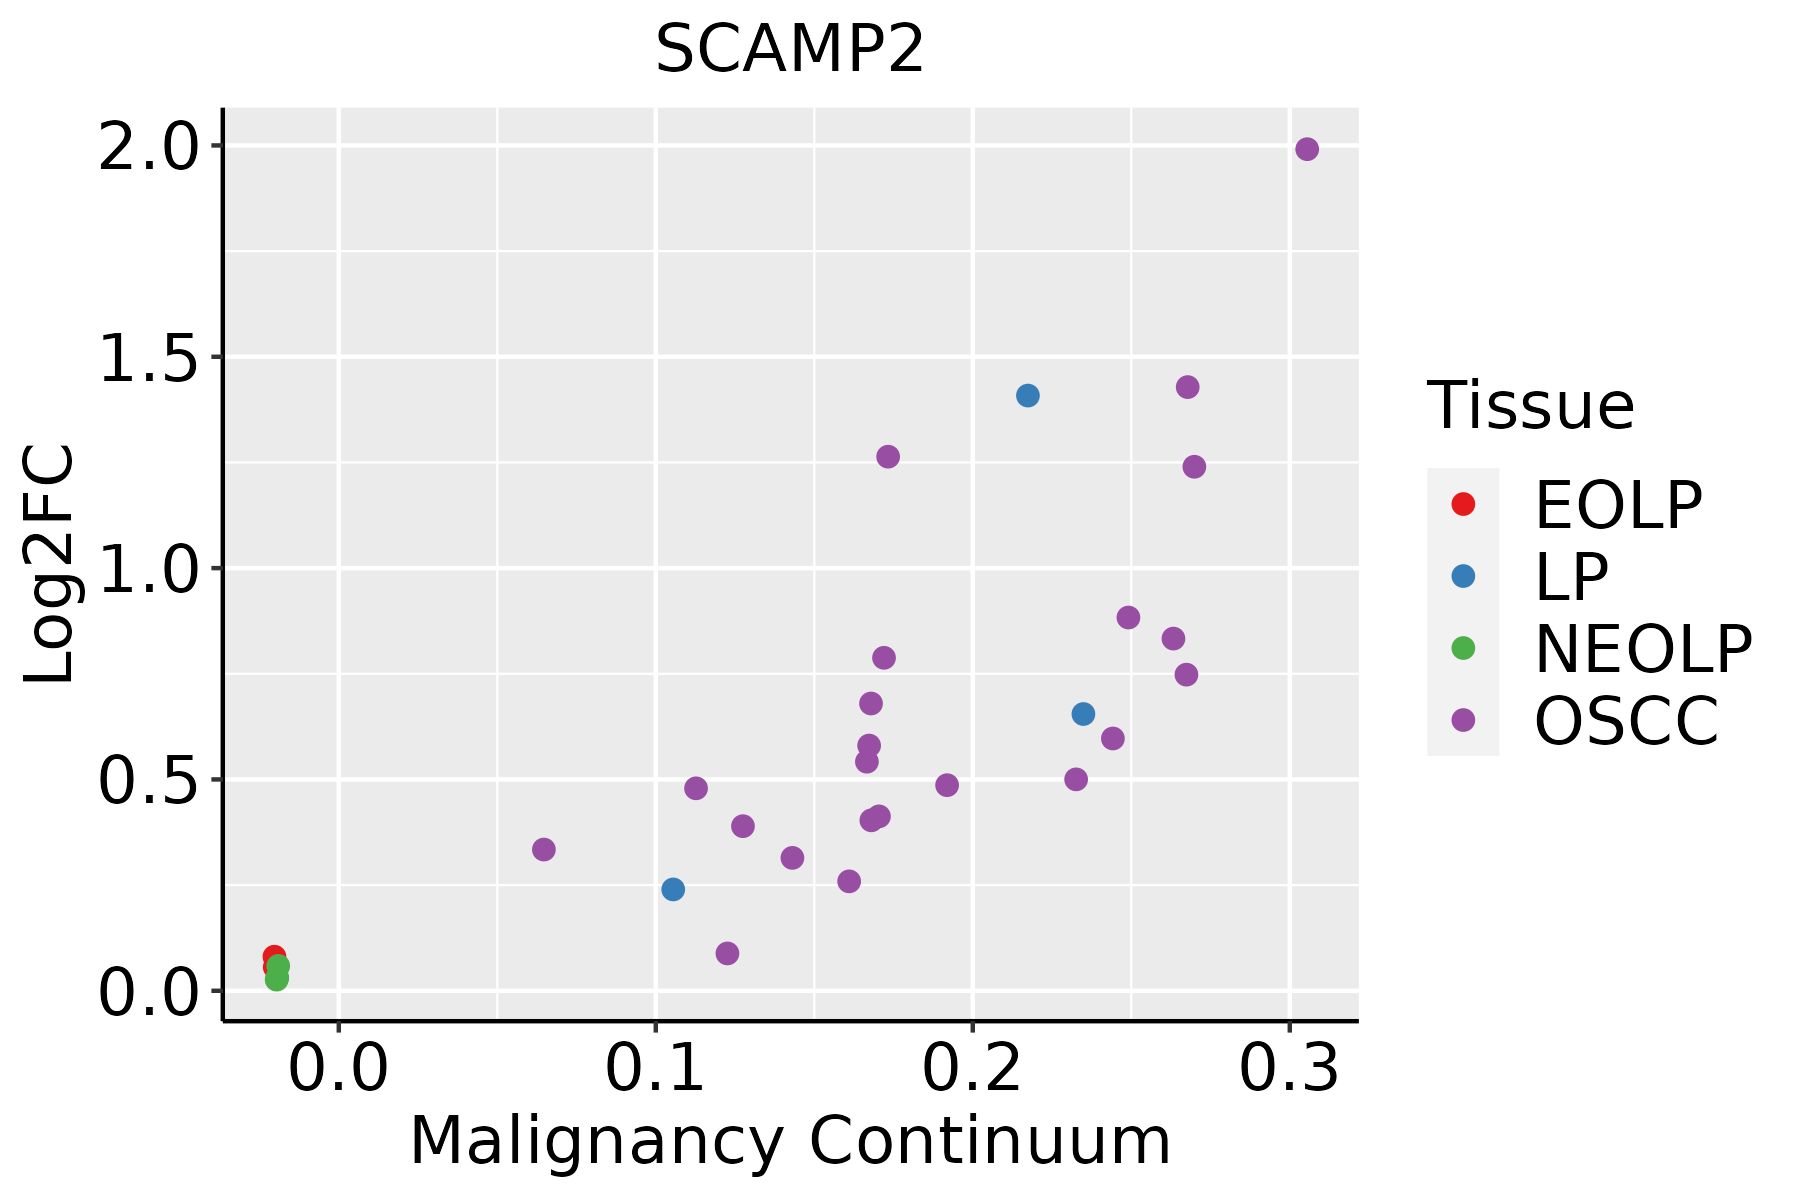 | EOLP: Erosive Oral lichen planus |
| LP: leukoplakia | ||
| NEOLP: Non-erosive oral lichen planus | ||
| OSCC: Oral squamous cell carcinoma | ||
| Skin | 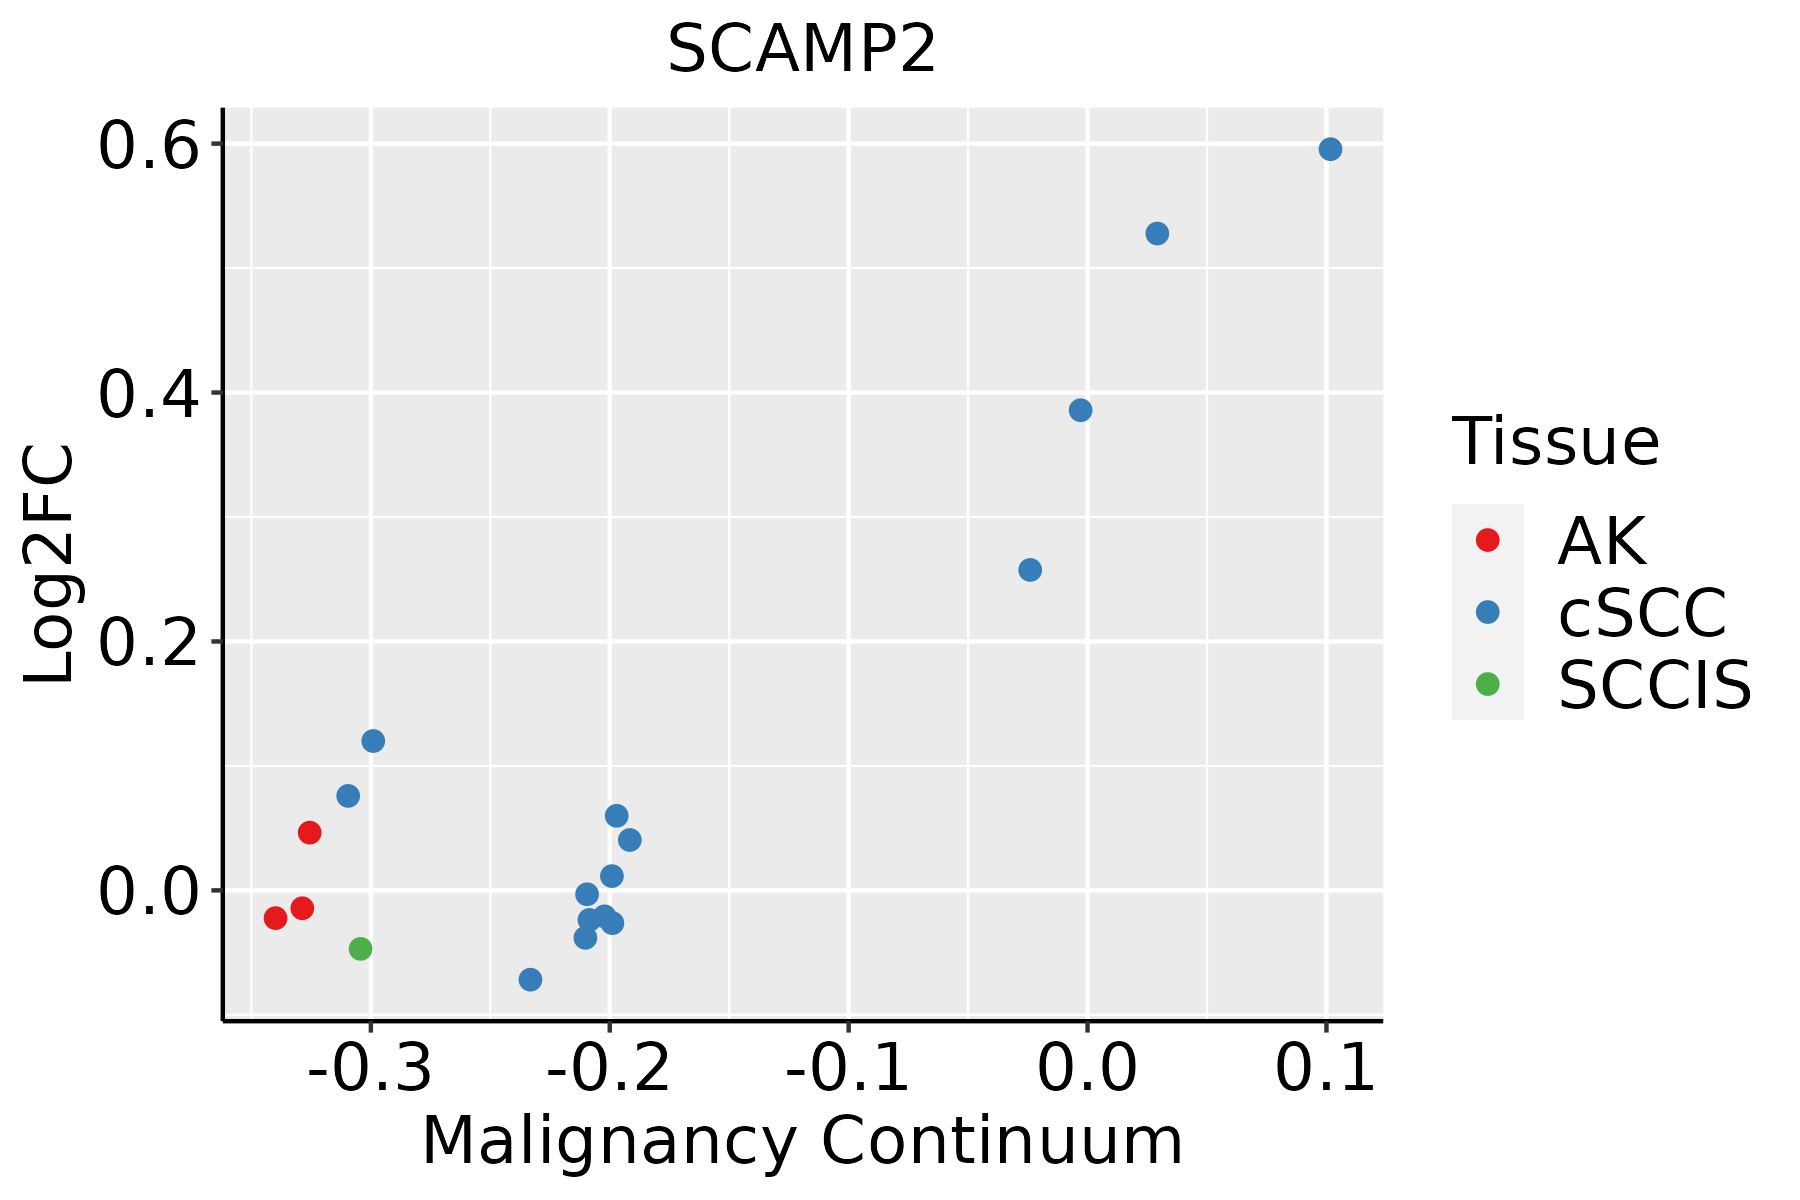 | AK: Actinic keratosis |
| cSCC: Cutaneous squamous cell carcinoma | ||
| SCCIS:squamous cell carcinoma in situ | ||
| Thyroid | 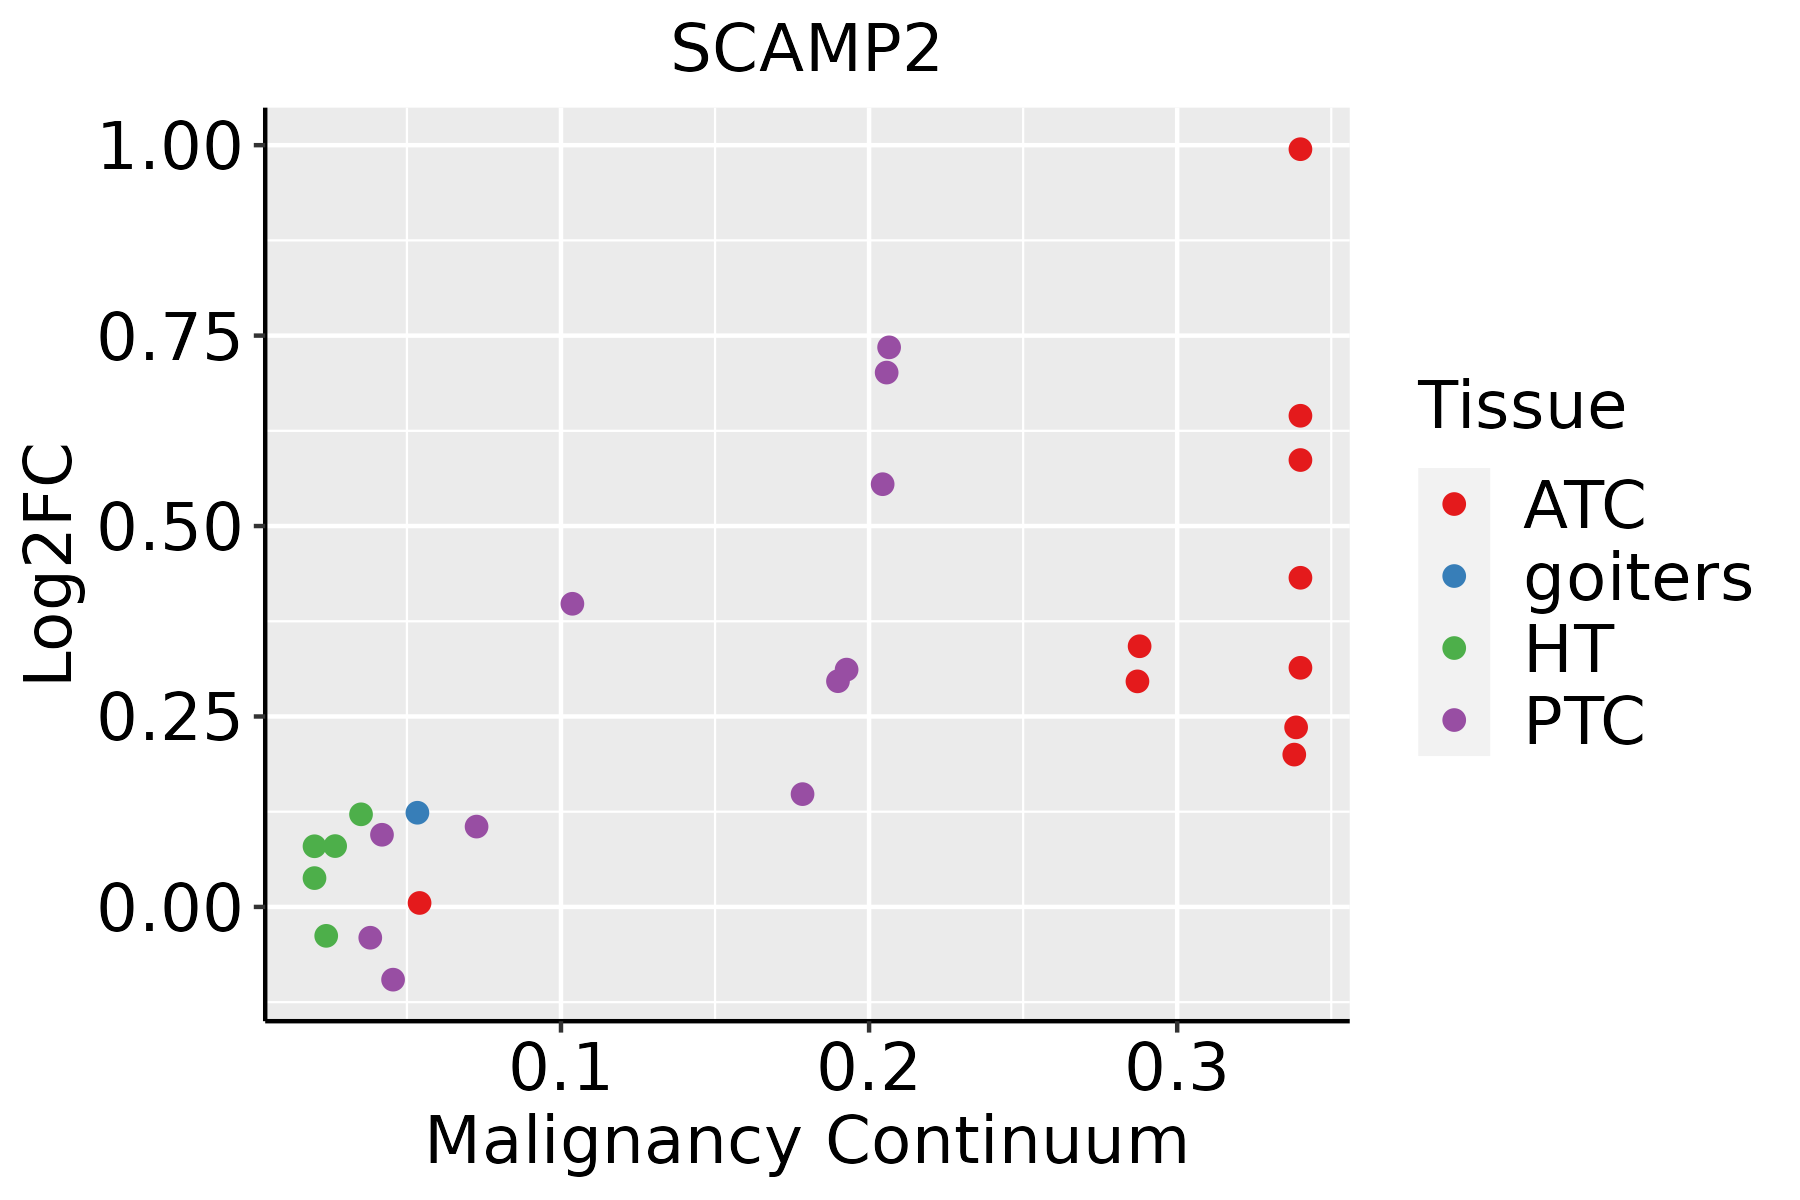 | ATC: Anaplastic thyroid cancer |
| HT: Hashimoto's thyroiditis | ||
| PTC: Papillary thyroid cancer |
| ∗log2FC in expression of this searched gene in stem-like cells from each diseased tissue sample relative to stem-like cells in normal samples in each tissue plotted against the malignancy continuum. Samples are colored based on if they are from different disease stage. |
Top |
Malignant transformation related pathway analysis |
| Find out the enriched GO biological processes and KEGG pathways involved in transition from healthy to precancer to cancer |
| Tissue | Disease Stage | Enriched GO biological Processes |
| Colorectum | AD |  |
| Colorectum | SER |  |
| Colorectum | MSS |  |
| Colorectum | MSI-H |  |
| Colorectum | FAP |  |
| ∗Top 15 enriched GO BP terms are showed in the bar plot of each disease state in each tissue. Each row represents a significant GO biological process which is colored according to the -log10(p.adjust). |
| Page: 1 2 3 4 5 6 7 8 9 |
| GO ID | Tissue | Disease Stage | Description | Gene Ratio | Bg Ratio | pvalue | p.adjust | Count |
| GO:0048193 | Colorectum | AD | Golgi vesicle transport | 109/3918 | 296/18723 | 1.80e-10 | 1.68e-08 | 109 |
| GO:0006892 | Colorectum | AD | post-Golgi vesicle-mediated transport | 45/3918 | 104/18723 | 2.22e-07 | 9.26e-06 | 45 |
| GO:00481931 | Colorectum | SER | Golgi vesicle transport | 79/2897 | 296/18723 | 4.20e-07 | 2.15e-05 | 79 |
| GO:00068921 | Colorectum | SER | post-Golgi vesicle-mediated transport | 31/2897 | 104/18723 | 1.59e-04 | 3.08e-03 | 31 |
| GO:00481932 | Colorectum | MSS | Golgi vesicle transport | 101/3467 | 296/18723 | 9.09e-11 | 9.77e-09 | 101 |
| GO:00068922 | Colorectum | MSS | post-Golgi vesicle-mediated transport | 40/3467 | 104/18723 | 1.45e-06 | 4.82e-05 | 40 |
| GO:00481934 | Colorectum | FAP | Golgi vesicle transport | 77/2622 | 296/18723 | 2.86e-08 | 2.62e-06 | 77 |
| GO:00068923 | Colorectum | FAP | post-Golgi vesicle-mediated transport | 36/2622 | 104/18723 | 9.23e-08 | 6.22e-06 | 36 |
| GO:004819318 | Esophagus | ESCC | Golgi vesicle transport | 231/8552 | 296/18723 | 1.82e-30 | 9.63e-28 | 231 |
| GO:000689215 | Esophagus | ESCC | post-Golgi vesicle-mediated transport | 82/8552 | 104/18723 | 4.00e-12 | 1.55e-10 | 82 |
| GO:004819311 | Liver | Cirrhotic | Golgi vesicle transport | 153/4634 | 296/18723 | 1.02e-23 | 6.43e-21 | 153 |
| GO:000689211 | Liver | Cirrhotic | post-Golgi vesicle-mediated transport | 51/4634 | 104/18723 | 7.12e-08 | 2.15e-06 | 51 |
| GO:004819321 | Liver | HCC | Golgi vesicle transport | 217/7958 | 296/18723 | 2.58e-27 | 1.02e-24 | 217 |
| GO:000689221 | Liver | HCC | post-Golgi vesicle-mediated transport | 77/7958 | 104/18723 | 6.14e-11 | 2.24e-09 | 77 |
| GO:004819315 | Oral cavity | OSCC | Golgi vesicle transport | 209/7305 | 296/18723 | 1.39e-28 | 6.30e-26 | 209 |
| GO:00068929 | Oral cavity | OSCC | post-Golgi vesicle-mediated transport | 71/7305 | 104/18723 | 1.37e-09 | 3.33e-08 | 71 |
| GO:004819316 | Oral cavity | LP | Golgi vesicle transport | 141/4623 | 296/18723 | 6.11e-18 | 1.06e-15 | 141 |
| GO:000689214 | Oral cavity | LP | post-Golgi vesicle-mediated transport | 44/4623 | 104/18723 | 5.90e-05 | 8.05e-04 | 44 |
| GO:0048193110 | Skin | cSCC | Golgi vesicle transport | 153/4864 | 296/18723 | 1.85e-21 | 3.41e-19 | 153 |
| GO:000689217 | Skin | cSCC | post-Golgi vesicle-mediated transport | 49/4864 | 104/18723 | 2.71e-06 | 4.30e-05 | 49 |
| Page: 1 2 |
| Pathway ID | Tissue | Disease Stage | Description | Gene Ratio | Bg Ratio | pvalue | p.adjust | qvalue | Count |
| Page: 1 |
Top |
Cell-cell communication analysis |
| Identification of potential cell-cell interactions between two cell types and their ligand-receptor pairs for different disease states |
| Ligand | Receptor | LRpair | Pathway | Tissue | Disease Stage |
| Page: 1 |
Top |
Single-cell gene regulatory network inference analysis |
| Find out the significant the regulons (TFs) and the target genes of each regulon across cell types for different disease states |
| TF | Cell Type | Tissue | Disease Stage | Target Gene | RSS | Regulon Activity |
| ∗The dot plots of a searched regulon are shown for all cell subpopulations in each disease state of each tissue based on the regulon specific score inferred using pySCENIC and by calculating the average expression. |
| Page: 1 |
Top |
Somatic mutation of malignant transformation related genes |
| Annotation of somatic variants for genes involved in malignant transformation |
| Hugo Symbol | Variant Class | Variant Classification | dbSNP RS | HGVSc | HGVSp | HGVSp Short | SWISSPROT | BIOTYPE | SIFT | PolyPhen | Tumor Sample Barcode | Tissue | Histology | Sex | Age | Stage | Therapy Types | Drugs | Outcome |
| SCAMP2 | SNV | Missense_Mutation | novel | c.89C>A | p.Pro30Gln | p.P30Q | O15127 | protein_coding | tolerated(0.57) | benign(0.003) | TCGA-A7-A0DB-01 | Breast | breast invasive carcinoma | Female | <65 | I/II | Hormone Therapy | arimidex | SD |
| SCAMP2 | SNV | Missense_Mutation | c.160C>T | p.Leu54Phe | p.L54F | O15127 | protein_coding | tolerated(0.7) | benign(0.031) | TCGA-BH-A0B9-01 | Breast | breast invasive carcinoma | Female | <65 | I/II | Chemotherapy | cyclophosphamide | SD | |
| SCAMP2 | SNV | Missense_Mutation | novel | c.177G>T | p.Gln59His | p.Q59H | O15127 | protein_coding | deleterious(0.02) | benign(0.043) | TCGA-EA-A410-01 | Cervix | cervical & endocervical cancer | Female | <65 | I/II | Unknown | Unknown | SD |
| SCAMP2 | SNV | Missense_Mutation | c.836N>T | p.Ser279Leu | p.S279L | O15127 | protein_coding | deleterious(0.01) | benign(0.1) | TCGA-MU-A51Y-01 | Cervix | cervical & endocervical cancer | Female | <65 | I/II | Unknown | Unknown | SD | |
| SCAMP2 | SNV | Missense_Mutation | novel | c.335N>G | p.Asn112Ser | p.N112S | O15127 | protein_coding | tolerated(1) | benign(0) | TCGA-F5-6814-01 | Colorectum | rectum adenocarcinoma | Male | <65 | I/II | Unknown | Unknown | SD |
| SCAMP2 | SNV | Missense_Mutation | novel | c.560N>T | p.Ser187Phe | p.S187F | O15127 | protein_coding | deleterious(0.02) | probably_damaging(0.989) | TCGA-A5-A0G1-01 | Endometrium | uterine corpus endometrioid carcinoma | Female | >=65 | I/II | Unknown | Unknown | SD |
| SCAMP2 | SNV | Missense_Mutation | novel | c.572N>A | p.Phe191Tyr | p.F191Y | O15127 | protein_coding | deleterious(0.01) | benign(0.319) | TCGA-A5-A0G2-01 | Endometrium | uterine corpus endometrioid carcinoma | Female | <65 | III/IV | Unknown | Unknown | SD |
| SCAMP2 | SNV | Missense_Mutation | rs746545894 | c.440N>A | p.Arg147Gln | p.R147Q | O15127 | protein_coding | deleterious(0.02) | possibly_damaging(0.487) | TCGA-A5-A0G2-01 | Endometrium | uterine corpus endometrioid carcinoma | Female | <65 | III/IV | Unknown | Unknown | SD |
| SCAMP2 | SNV | Missense_Mutation | novel | c.560N>T | p.Ser187Phe | p.S187F | O15127 | protein_coding | deleterious(0.02) | probably_damaging(0.989) | TCGA-A5-A0GG-01 | Endometrium | uterine corpus endometrioid carcinoma | Female | >=65 | I/II | Unknown | Unknown | SD |
| SCAMP2 | SNV | Missense_Mutation | novel | c.861N>A | p.His287Gln | p.H287Q | O15127 | protein_coding | deleterious(0) | probably_damaging(0.993) | TCGA-AX-A2HD-01 | Endometrium | uterine corpus endometrioid carcinoma | Female | >=65 | III/IV | Unknown | Unknown | SD |
| Page: 1 2 3 |
Top |
Related drugs of malignant transformation related genes |
| Identification of chemicals and drugs interact with genes involved in malignant transfromation |
| (DGIdb 4.0) |
| Entrez ID | Symbol | Category | Interaction Types | Drug Claim Name | Drug Name | PMIDs |
| Page: 1 |

Copyright 2023-Present -The University of Texas Health Science Center at Houston |