Schematic overview of the cellular and molecular mechanisms involved in the cancer progression, including the proposed cellular and molecular mechanisms in cancer cells trajectory. AT1: alveolar type 1 cells; AT2: alveolar type 2 cells; AAH: atypical adenomatous hyperplasia; AIS: adenocarcinoma in situ; MIA: minimally invasive adenocarcinoma; IA: invasive adenocarcinoma; EMT: epithelial-mesenchymal transition

Home

Download

Statistics

Help

Contact

Center for Computational Systems Medicine
leaf

Gene summary

leaf

Malignant transformation analysis

leaf

Malignant transformation related pathway analysis

leaf

Cell-cell communication analysis

leaf

Single-cell gene regulatory network inference analysis

leaf

Somatic mutation of malignant transformation related genes

leaf

Related drugs of malignant transformation related genes

Gene: SCAMP1

Gene summary for SCAMP1

check button Gene summary.

Gene informationSpeciesHuman
Gene symbol

SCAMP1

Gene ID

9522

Gene namesecretory carrier membrane protein 1
Gene AliasSCAMP
Cytomap5q14.1
Gene Typeprotein-coding
GO ID

GO:0006810

UniProtAcc

A0A087WXB0


Top

Malignant transformation analysis

check button Identification of the aberrant gene expression in precancerous and cancerous lesions by comparing the gene expression of stem-like cells in diseased tissues with normal stem cells
check button Malignant transformation involving gene list.
Entrez IDSymbolReplicatesSpeciesOrganTissueAdj P-valueLog2FCMalignancy
9522SCAMP1LZE2THumanEsophagusESCC2.00e-056.08e-010.082
9522SCAMP1LZE4THumanEsophagusESCC6.79e-185.16e-010.0811
9522SCAMP1LZE5THumanEsophagusESCC6.12e-032.07e-010.0514
9522SCAMP1LZE8THumanEsophagusESCC2.08e-051.04e-010.067
9522SCAMP1LZE22D1HumanEsophagusHGIN3.64e-027.17e-020.0595
9522SCAMP1LZE24THumanEsophagusESCC3.00e-246.82e-010.0596
9522SCAMP1LZE6THumanEsophagusESCC1.20e-037.50e-020.0845
9522SCAMP1P2T-EHumanEsophagusESCC3.70e-356.41e-010.1177
9522SCAMP1P4T-EHumanEsophagusESCC3.89e-253.36e-010.1323
9522SCAMP1P5T-EHumanEsophagusESCC1.49e-132.63e-010.1327
9522SCAMP1P8T-EHumanEsophagusESCC2.15e-182.63e-010.0889
9522SCAMP1P9T-EHumanEsophagusESCC2.07e-174.38e-010.1131
9522SCAMP1P10T-EHumanEsophagusESCC6.27e-324.79e-010.116
9522SCAMP1P11T-EHumanEsophagusESCC1.10e-113.37e-010.1426
9522SCAMP1P12T-EHumanEsophagusESCC5.92e-235.74e-010.1122
9522SCAMP1P15T-EHumanEsophagusESCC7.90e-438.68e-010.1149
9522SCAMP1P16T-EHumanEsophagusESCC1.20e-243.26e-010.1153
9522SCAMP1P17T-EHumanEsophagusESCC1.43e-054.18e-010.1278
9522SCAMP1P19T-EHumanEsophagusESCC1.20e-064.94e-010.1662
9522SCAMP1P20T-EHumanEsophagusESCC5.28e-264.70e-010.1124
Page: 1 2 3 4 5 6 

check button Transcriptomic changes along malignancy continuum.
TissueExpression DynamicsAbbreviation
EsophagusThe image shows the transcriptomic changes along malignancy continuum.log2FC in expression of this searched gene in stem-like cells from each diseased tissue sample relative to stem-like cells in normal samples in each tissue plotted against the malignancy continuum. Samples are colored based on if they are from different disease stage.
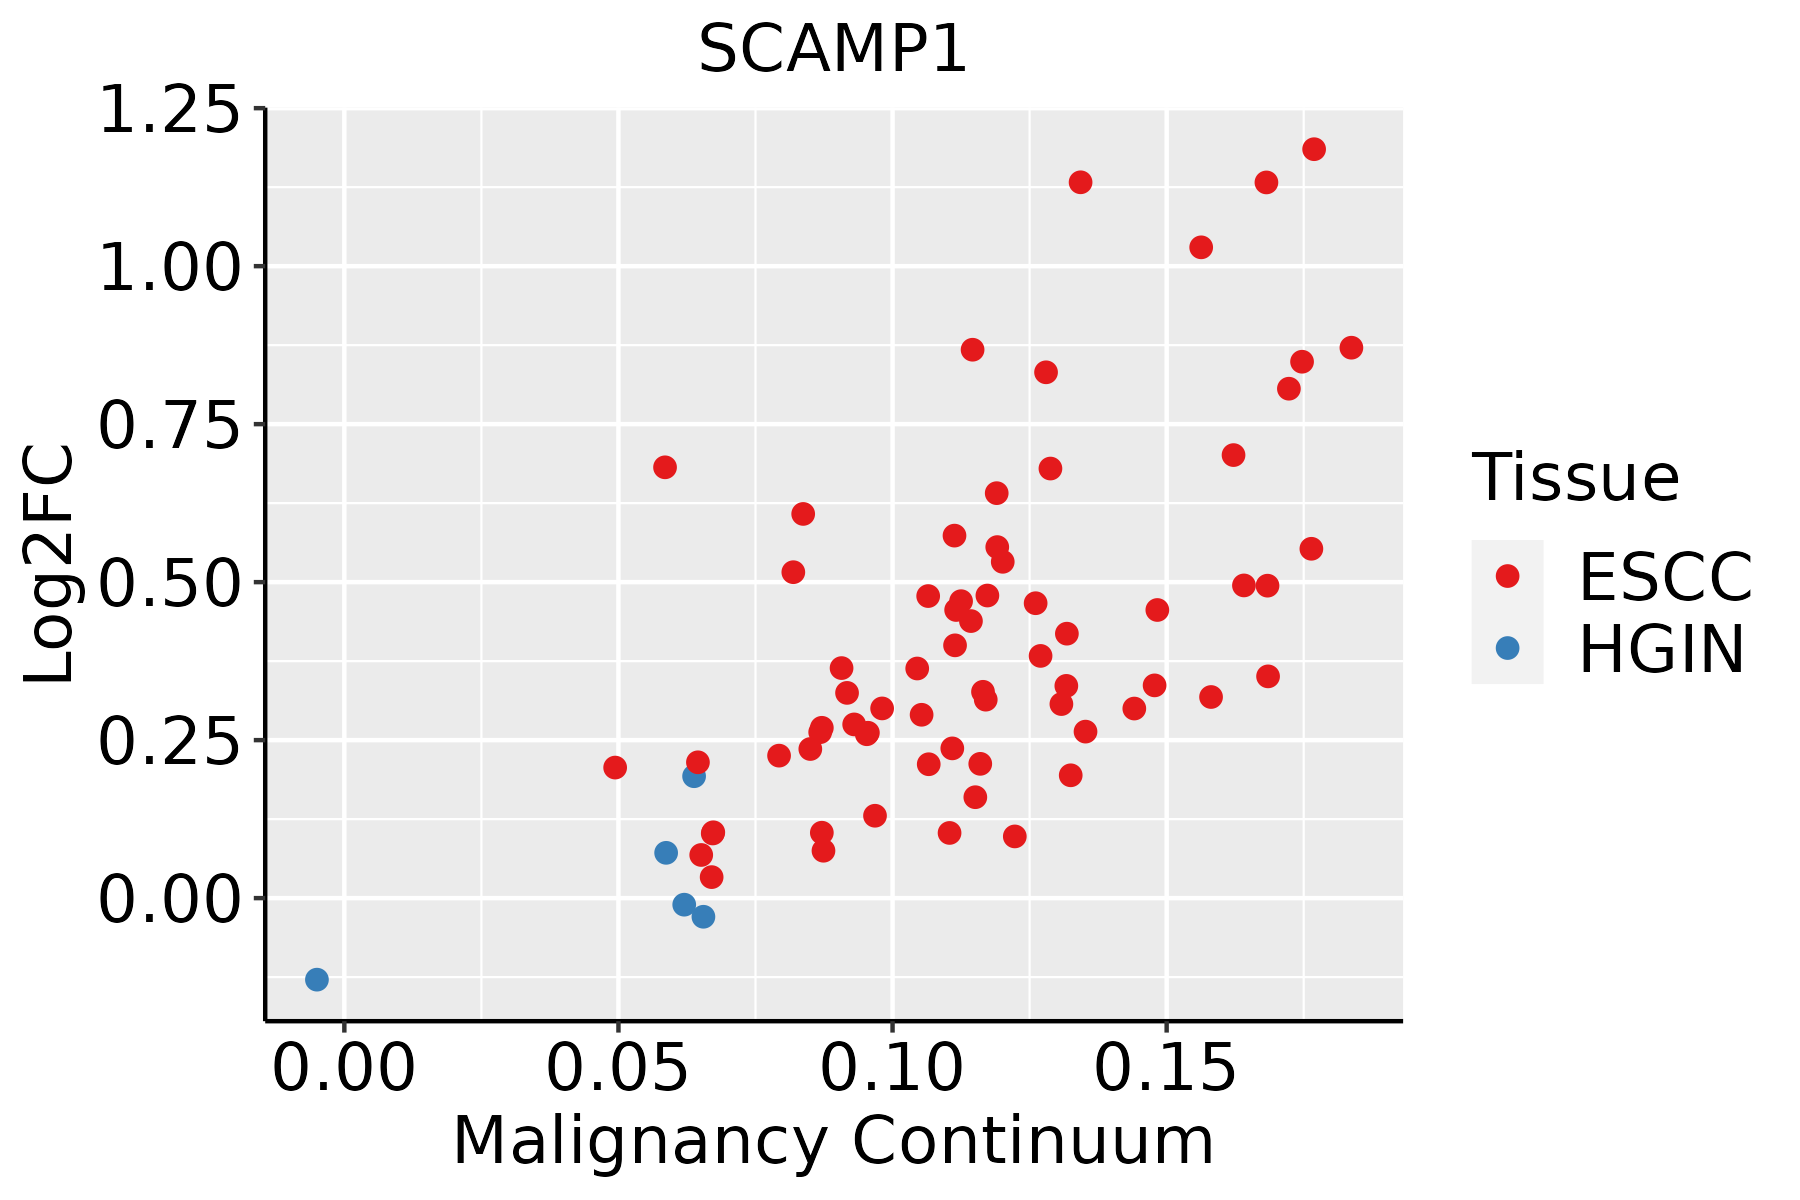
ESCC: Esophageal squamous cell carcinoma
HGIN: High-grade intraepithelial neoplasias
LGIN: Low-grade intraepithelial neoplasias
LiverThe image shows the transcriptomic changes along malignancy continuum.log2FC in expression of this searched gene in stem-like cells from each diseased tissue sample relative to stem-like cells in normal samples in each tissue plotted against the malignancy continuum. Samples are colored based on if they are from different disease stage.
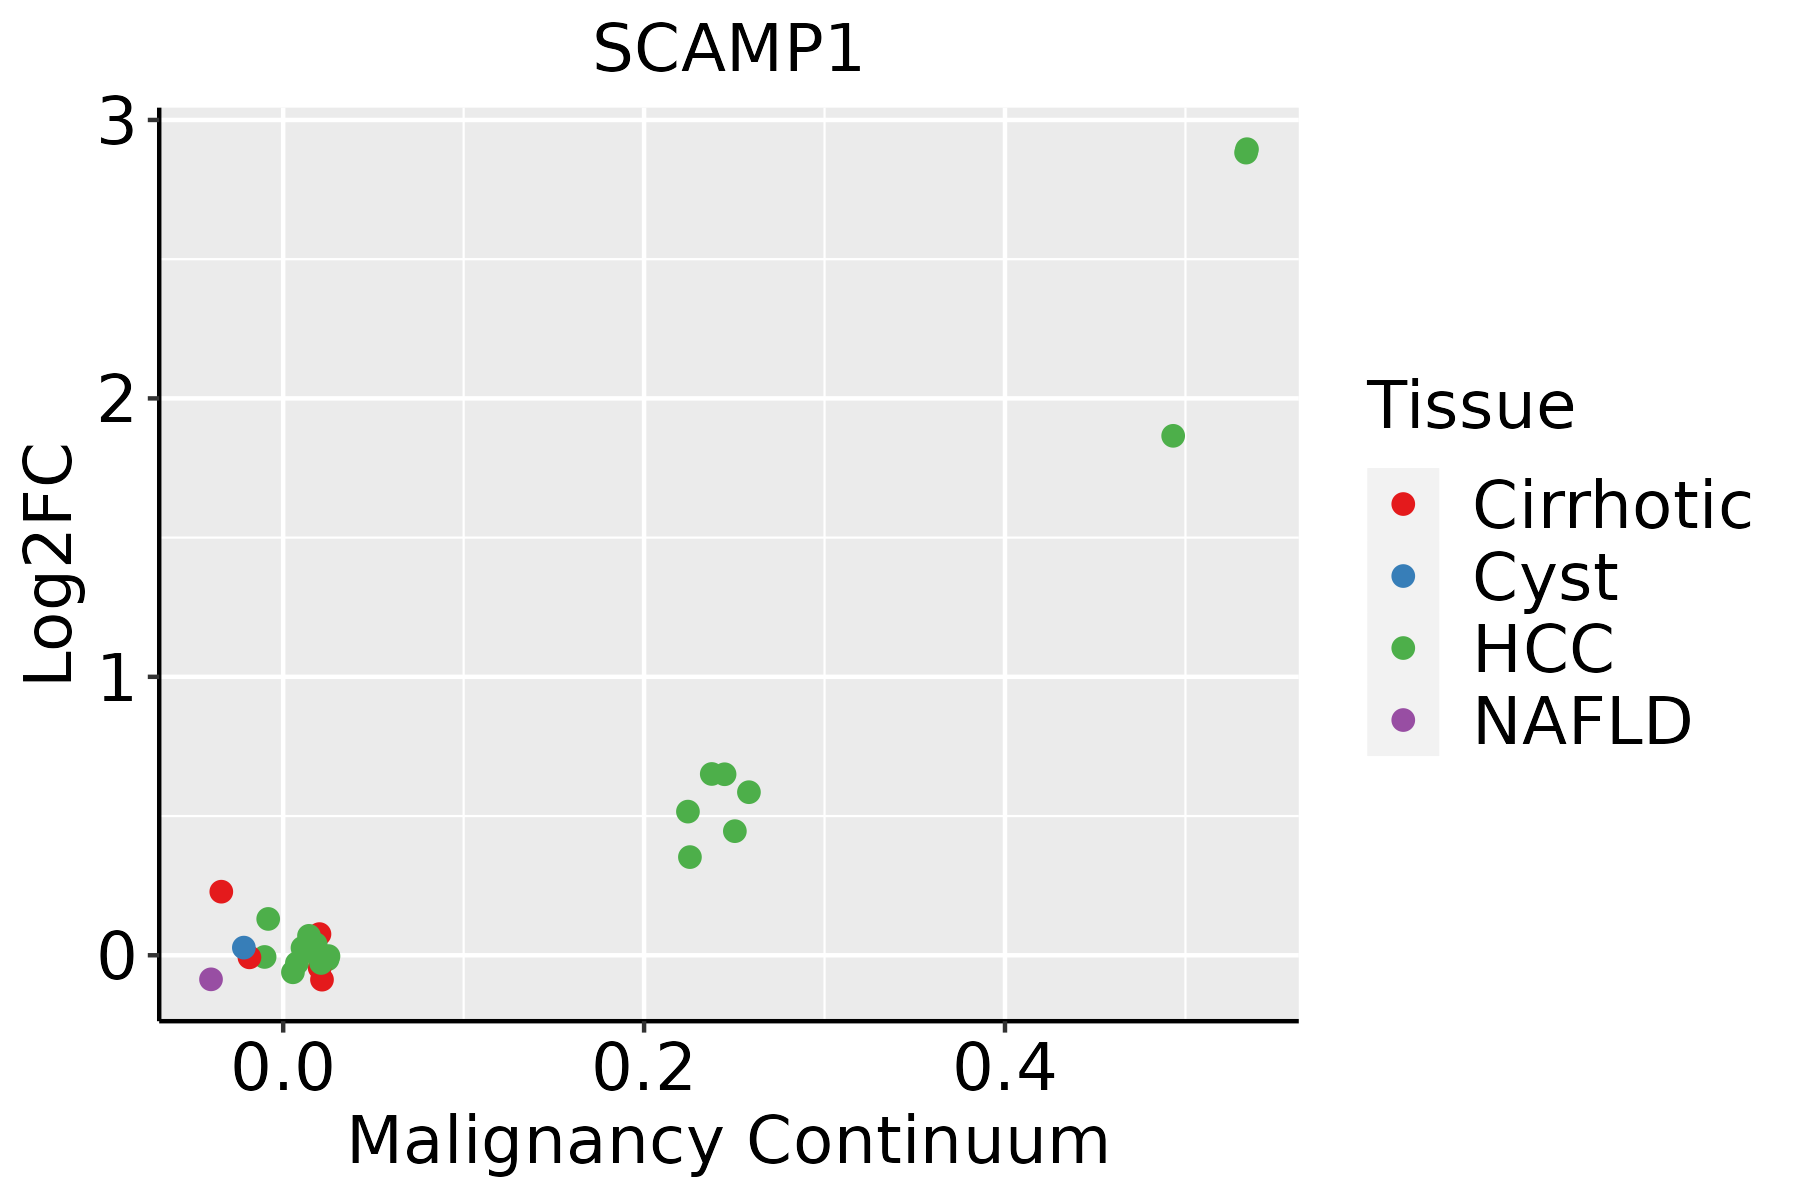
HCC: Hepatocellular carcinoma
NAFLD: Non-alcoholic fatty liver disease
Oral CavityThe image shows the transcriptomic changes along malignancy continuum.log2FC in expression of this searched gene in stem-like cells from each diseased tissue sample relative to stem-like cells in normal samples in each tissue plotted against the malignancy continuum. Samples are colored based on if they are from different disease stage.
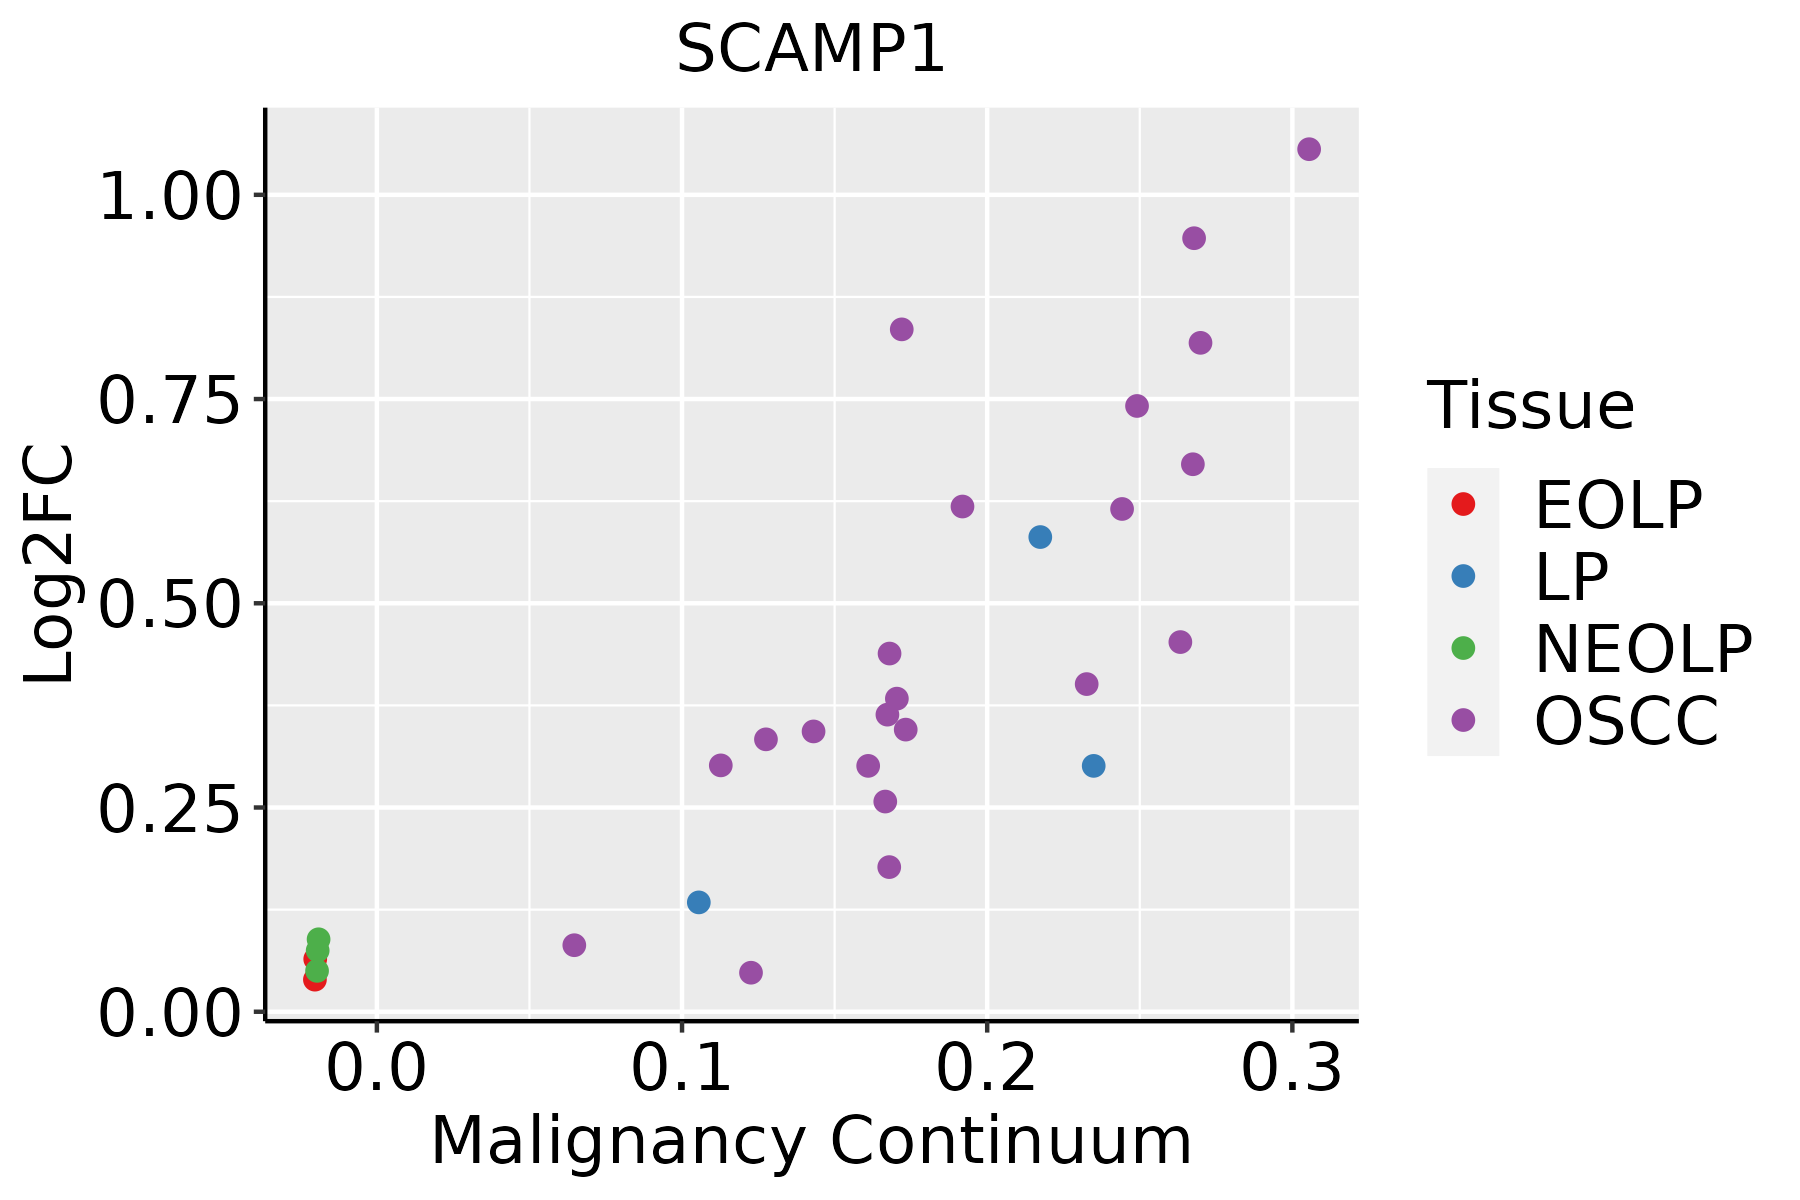
EOLP: Erosive Oral lichen planus
LP: leukoplakia
NEOLP: Non-erosive oral lichen planus
OSCC: Oral squamous cell carcinoma
ProstateThe image shows the transcriptomic changes along malignancy continuum.log2FC in expression of this searched gene in stem-like cells from each diseased tissue sample relative to stem-like cells in normal samples in each tissue plotted against the malignancy continuum. Samples are colored based on if they are from different disease stage.
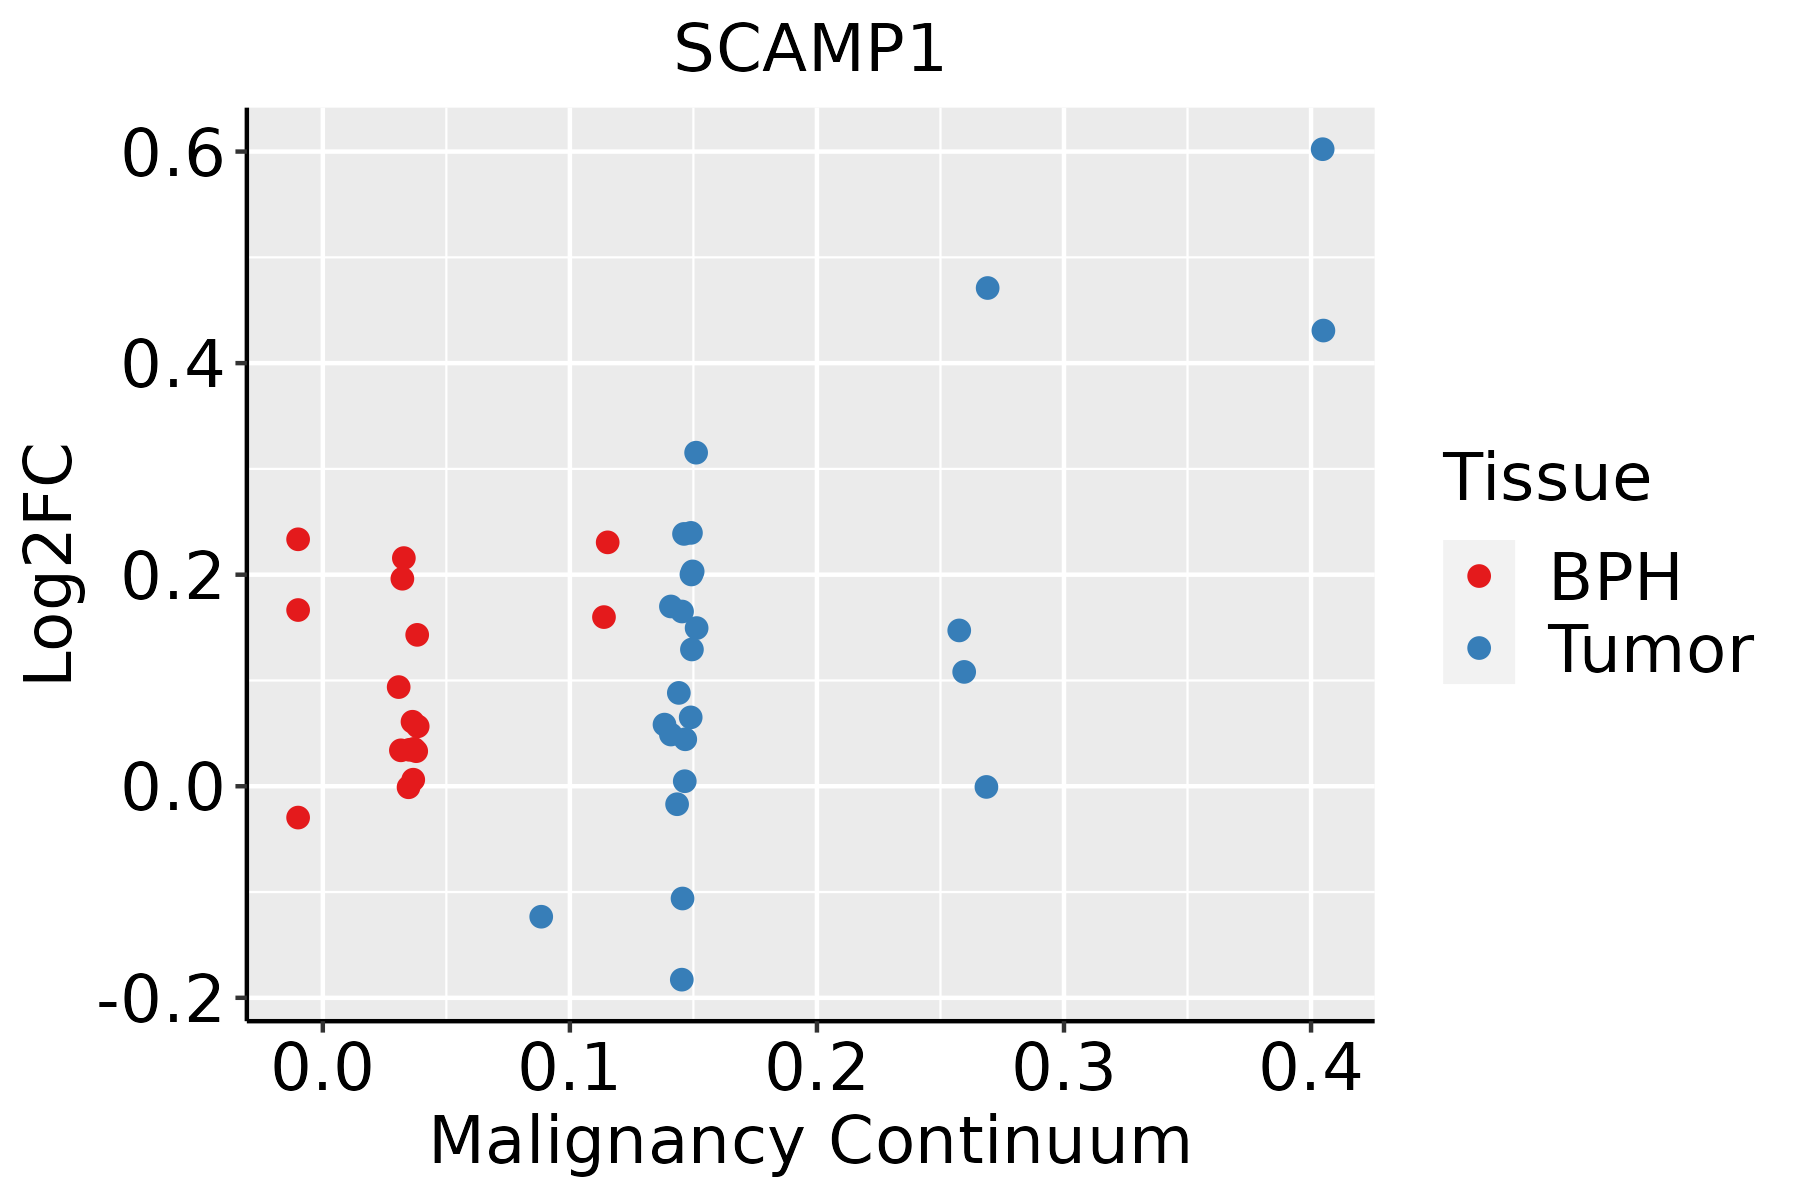
BPH: Benign Prostatic Hyperplasia
SkinThe image shows the transcriptomic changes along malignancy continuum.log2FC in expression of this searched gene in stem-like cells from each diseased tissue sample relative to stem-like cells in normal samples in each tissue plotted against the malignancy continuum. Samples are colored based on if they are from different disease stage.
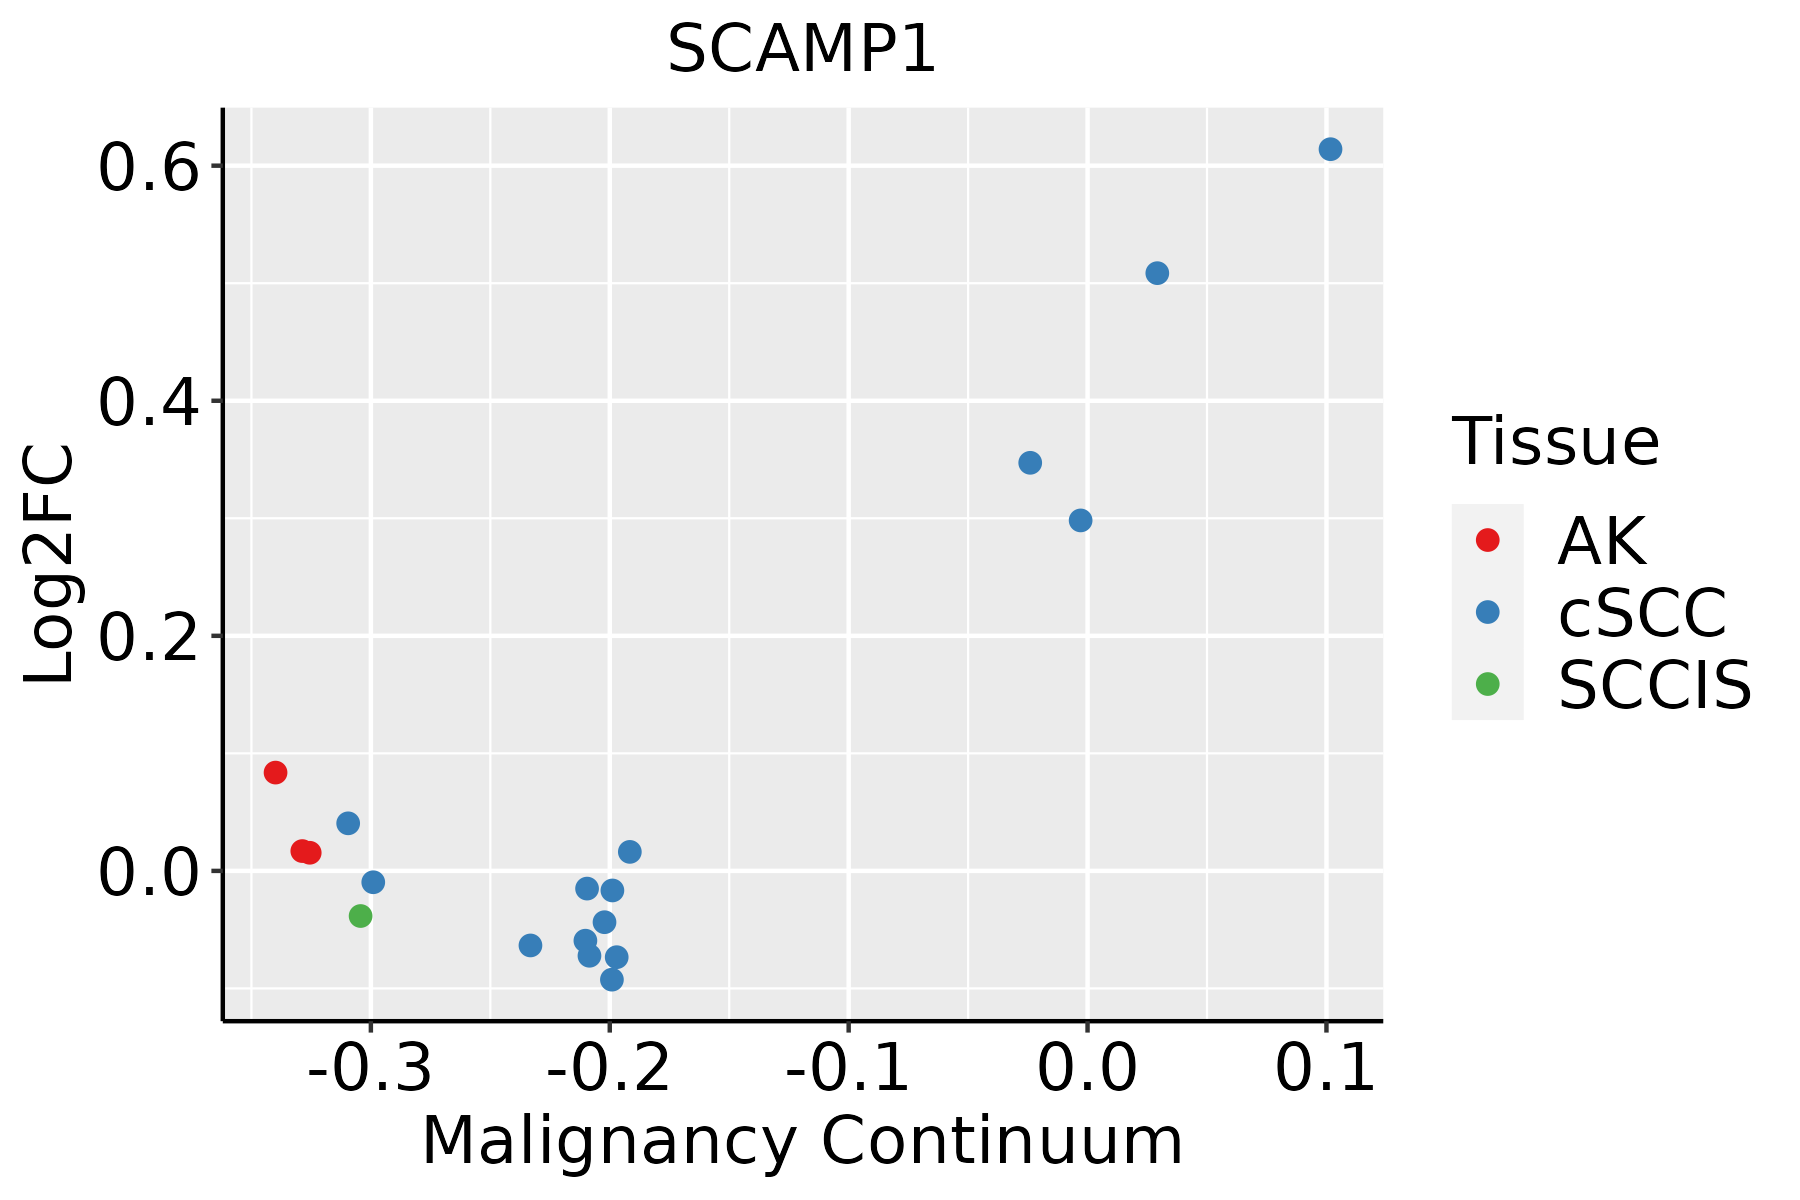
AK: Actinic keratosis
cSCC: Cutaneous squamous cell carcinoma
SCCIS:squamous cell carcinoma in situ
ThyroidThe image shows the transcriptomic changes along malignancy continuum.log2FC in expression of this searched gene in stem-like cells from each diseased tissue sample relative to stem-like cells in normal samples in each tissue plotted against the malignancy continuum. Samples are colored based on if they are from different disease stage.
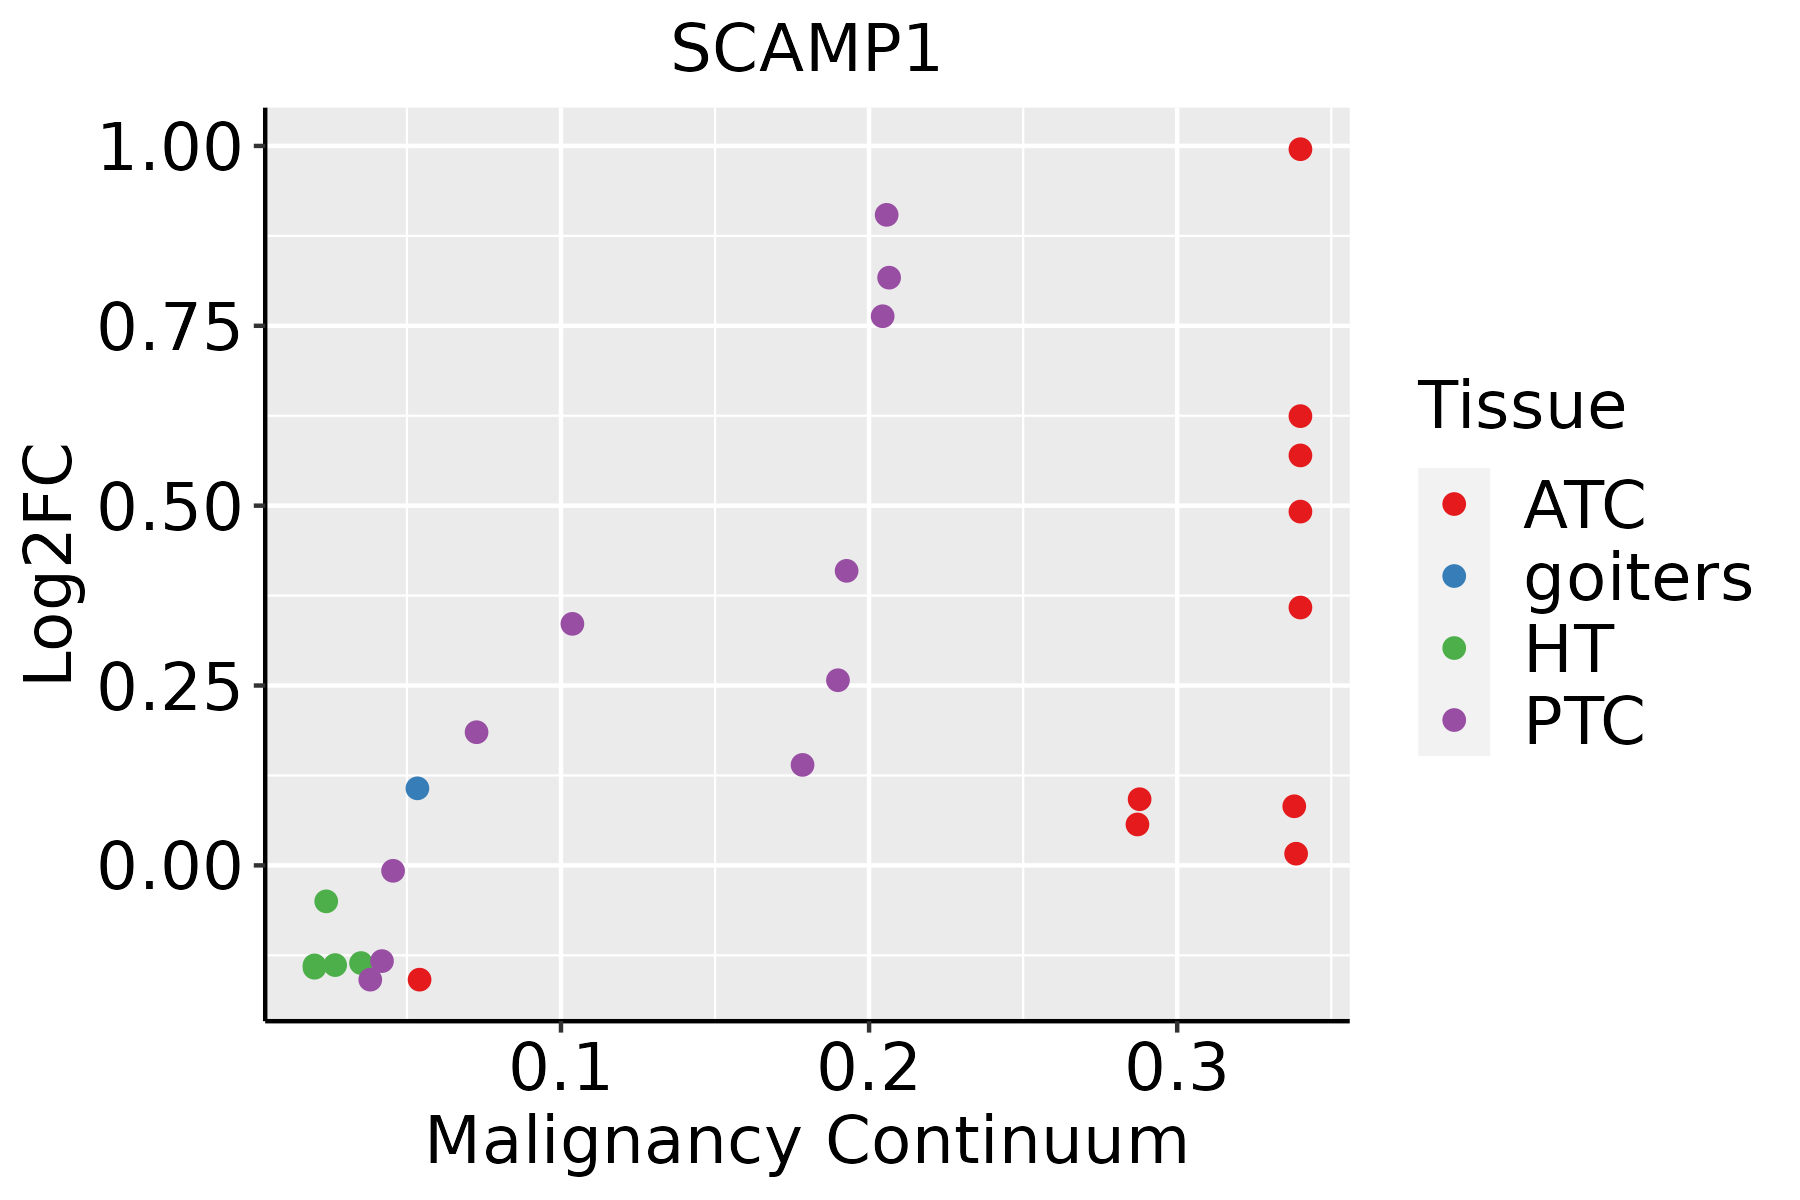
ATC: Anaplastic thyroid cancer
HT: Hashimoto's thyroiditis
PTC: Papillary thyroid cancer
∗log2FC in expression of this searched gene in stem-like cells from each diseased tissue sample relative to stem-like cells in normal samples in each tissue plotted against the malignancy continuum. Samples are colored based on if they are from different disease stage.

Top

Malignant transformation related pathway analysis

check buttonFind out the enriched GO biological processes and KEGG pathways involved in transition from healthy to precancer to cancer
check button Figure of enriched GO biological processes.
TissueDisease StageEnriched GO biological Processes
ColorectumADGO analysis - Figure of enriched GO biological processes: Top 15 enriched GO BP terms are showed in the bar plot of each disease state in each tissue. Each row represents a significant GO biological process which is colored according to the -log10(p.adjust).
ColorectumSERGO analysis - Figure of enriched GO biological processes: Top 15 enriched GO BP terms are showed in the bar plot of each disease state in each tissue. Each row represents a significant GO biological process which is colored according to the -log10(p.adjust).
ColorectumMSSGO analysis - Figure of enriched GO biological processes: Top 15 enriched GO BP terms are showed in the bar plot of each disease state in each tissue. Each row represents a significant GO biological process which is colored according to the -log10(p.adjust).
ColorectumMSI-HGO analysis - Figure of enriched GO biological processes: Top 15 enriched GO BP terms are showed in the bar plot of each disease state in each tissue. Each row represents a significant GO biological process which is colored according to the -log10(p.adjust).
ColorectumFAPGO analysis - Figure of enriched GO biological processes: Top 15 enriched GO BP terms are showed in the bar plot of each disease state in each tissue. Each row represents a significant GO biological process which is colored according to the -log10(p.adjust).
∗Top 15 enriched GO BP terms are showed in the bar plot of each disease state in each tissue. Each row represents a significant GO biological process which is colored according to the -log10(p.adjust).
Page: 1 2 3 4 5 6 7 8 9 

check button Enriched GO biological processes.
GO IDTissueDisease StageDescriptionGene RatioBg Ratiopvaluep.adjustCount
GO:004819317EsophagusHGINGolgi vesicle transport83/2587296/187238.59e-118.89e-0983
GO:000689210EsophagusHGINpost-Golgi vesicle-mediated transport26/2587104/187231.63e-031.81e-0226
GO:004819318EsophagusESCCGolgi vesicle transport231/8552296/187231.82e-309.63e-28231
GO:000689215EsophagusESCCpost-Golgi vesicle-mediated transport82/8552104/187234.00e-121.55e-1082
GO:004819321LiverHCCGolgi vesicle transport217/7958296/187232.58e-271.02e-24217
GO:000689221LiverHCCpost-Golgi vesicle-mediated transport77/7958104/187236.14e-112.24e-0977
GO:004819315Oral cavityOSCCGolgi vesicle transport209/7305296/187231.39e-286.30e-26209
GO:00068929Oral cavityOSCCpost-Golgi vesicle-mediated transport71/7305104/187231.37e-093.33e-0871
GO:004819316Oral cavityLPGolgi vesicle transport141/4623296/187236.11e-181.06e-15141
GO:000689214Oral cavityLPpost-Golgi vesicle-mediated transport44/4623104/187235.90e-058.05e-0444
GO:004819310ProstateBPHGolgi vesicle transport102/3107296/187233.90e-144.56e-12102
GO:00068928ProstateBPHpost-Golgi vesicle-mediated transport34/3107104/187234.14e-054.43e-0434
GO:004819314ProstateTumorGolgi vesicle transport105/3246296/187233.55e-144.33e-12105
GO:000689213ProstateTumorpost-Golgi vesicle-mediated transport35/3246104/187234.14e-054.70e-0435
GO:0048193110SkincSCCGolgi vesicle transport153/4864296/187231.85e-213.41e-19153
GO:000689217SkincSCCpost-Golgi vesicle-mediated transport49/4864104/187232.71e-064.30e-0549
GO:004819320ThyroidPTCGolgi vesicle transport186/5968296/187233.09e-281.22e-25186
GO:000689218ThyroidPTCpost-Golgi vesicle-mediated transport66/5968104/187233.36e-111.24e-0966
GO:0048193111ThyroidATCGolgi vesicle transport189/6293296/187239.58e-275.05e-24189
GO:000689219ThyroidATCpost-Golgi vesicle-mediated transport68/6293104/187233.30e-111.10e-0968
Page: 1 

check button Enriched KEGG pathways.
Pathway IDTissueDisease StageDescriptionGene RatioBg Ratiopvaluep.adjustqvalueCount
Page: 1 

Top

Cell-cell communication analysis

check buttonIdentification of potential cell-cell interactions between two cell types and their ligand-receptor pairs for different disease states
LigandReceptorLRpairPathwayTissueDisease Stage
Page: 1 

Top

Single-cell gene regulatory network inference analysis

check buttonFind out the significant the regulons (TFs) and the target genes of each regulon across cell types for different disease states
TFCell TypeTissueDisease StageTarget GeneRSSRegulon Activity
∗The dot plots of a searched regulon are shown for all cell subpopulations in each disease state of each tissue based on the regulon specific score inferred using pySCENIC and by calculating the average expression.
Page: 1 

Top

Somatic mutation of malignant transformation related genes

check buttonAnnotation of somatic variants for genes involved in malignant transformation
Hugo SymbolVariant ClassVariant ClassificationdbSNP RSHGVScHGVSpHGVSp ShortSWISSPROTBIOTYPESIFTPolyPhenTumor Sample BarcodeTissueHistologySexAgeStageTherapy TypesDrugsOutcome
SCAMP1SNVMissense_Mutationnovelc.399N>Gp.Phe133Leup.F133LO15126protein_codingdeleterious(0)probably_damaging(1)TCGA-BH-A0B6-01Breastbreast invasive carcinomaFemale<65I/IIUnknownUnknownSD
SCAMP1SNVMissense_Mutationnovelc.509N>Ap.Cys170Tyrp.C170YO15126protein_codingdeleterious(0)probably_damaging(0.981)TCGA-D8-A1XJ-01Breastbreast invasive carcinomaFemale>=65III/IVHormone TherapytamoxiphenSD
SCAMP1insertionNonsense_Mutationnovelc.990_991insGGGCTAGGAGAATTGTAGGTTGTTGGTATTGGAAGATGAp.Gln330_Asn331insGlyLeuGlyGluLeuTerValValGlyIleGlyArgTerp.Q330_N331insGLGEL*VVGIGR*O15126protein_codingTCGA-AR-A0TY-01Breastbreast invasive carcinomaFemale<65I/IIUnspecificPaclitaxelPD
SCAMP1SNVMissense_Mutationrs763582841c.269G>Ap.Arg90Hisp.R90HO15126protein_codingdeleterious(0)probably_damaging(0.919)TCGA-AA-A01R-01Colorectumcolon adenocarcinomaMale<65III/IVChemotherapy5-fluorouracilPD
SCAMP1SNVMissense_Mutationnovelc.233N>Cp.Lys78Thrp.K78TO15126protein_codingtolerated(0.29)benign(0.001)TCGA-AM-5821-01Colorectumcolon adenocarcinomaFemale>=65I/IIUnknownUnknownSD
SCAMP1SNVMissense_Mutationnovelc.381N>Gp.Phe127Leup.F127LO15126protein_codingtolerated(0.22)benign(0.225)TCGA-CK-4950-01Colorectumcolon adenocarcinomaFemale>=65III/IVChemotherapyfolfoxSD
SCAMP1insertionFrame_Shift_Insnovelc.326_327insTGTTCCTp.Gln109HisfsTer10p.Q109Hfs*10O15126protein_codingTCGA-AM-5821-01Colorectumcolon adenocarcinomaFemale>=65I/IIUnknownUnknownSD
SCAMP1SNVMissense_Mutationnovelc.815N>Tp.Thr272Ilep.T272IO15126protein_codingdeleterious(0.01)probably_damaging(0.999)TCGA-AJ-A23O-01Endometriumuterine corpus endometrioid carcinomaFemale>=65I/IIUnknownUnknownSD
SCAMP1SNVMissense_Mutationnovelc.728G>Ap.Gly243Aspp.G243DO15126protein_codingdeleterious(0)probably_damaging(0.992)TCGA-AJ-A3EK-01Endometriumuterine corpus endometrioid carcinomaFemale<65I/IIChemotherapycarboplatinCR
SCAMP1SNVMissense_Mutationnovelc.83G>Tp.Arg28Ilep.R28IO15126protein_codingtolerated(0.18)benign(0.01)TCGA-AX-A2HC-01Endometriumuterine corpus endometrioid carcinomaFemale<65III/IVChemotherapypaclitaxelPD
Page: 1 2 3 

Top

Related drugs of malignant transformation related genes

check buttonIdentification of chemicals and drugs interact with genes involved in malignant transfromation
(DGIdb 4.0)
Entrez IDSymbolCategoryInteraction TypesDrug Claim NameDrug NamePMIDs
Page: 1